XAU/USD | Further drop for gold? (READ THE CAPTION) Good morning folks, Amirali here with another analysis on Gold.
As you can clearly see, BSL was taken and a pool of liquidity now awaits above the 4264.50 level, exactly below the lower part of the FVG, at 4272.50 level.
Gold also reached the $4174 FVG (in a lower timeframe) and then surged to $4186 level before dropping and now is being traded at 4176 level.
There's an old NDOG at $4164.50 level which I expect a reaction from Gold to it. Just below this NDOG, there's an IFVG in 4111-4159 zone which I believe after the reaction to $4164 level, Gold might drop there and will react to it.
Sincerely, Amirali
Metals

Gold – Bearish Retracement Toward Structural SupportGold is currently moving inside a broad rising wedge, and today’s structure adds more clarity to the short-term direction.
A smaller pennant formation developed inside the wedge and has now been broken to the downside — a signal that momentum is shifting and the market may be preparing for a corrective drop toward the wedge’s lower boundary.
The key downside target aligns with 4113 – 4127 , which overlaps:
The lower trendline of the main rising wedge
A previous demand zone
A natural symmetry completion of the pennant breakdown
As long as price stays below the 4208 invalidation level , the expectation remains for price to revisit the bottom of the wedge before any significant bullish continuation can be confirmed.
Watching the reaction at the lower wedge boundary will be crucial, as this area can determine whether gold resumes its larger bullish trend or fails structurally.

Gold Traders: The Calm Before the Breakdown — Are You Ready?1. Current Market Structure
Gold is entering a technical correction phase after fully completing the bullish impulse cycle (1) → (5).
Key structural points:
- The bullish wave cycle has completed, signaling the start of a corrective phase.
- The first corrective leg Wave A has already formed, matching the classical ABC correction model.
- The 4163–4157 zone (blue region) acts as the primary support for Wave A.
- Beneath this area lies the major Liquidity Cluster 4128–4135, where large liquidity pools are positioned—this is the ideal destination for Wave C to complete.
2. Today's Market Scenario
🔹 Main Scenario – Aligned With the Ongoing Corrective Trend
The price is expected to follow a typical ABC behavior:
Step 1 – Formation of Wave B
- Gold may experience a mild upward retracement to complete Wave B.
- This bounce is expected to be weak, as market structure remains in a corrective state.
Step 2 – Completion of Wave C
After Wave B:
- Price is likely to continue downward to complete Wave C.
- The target lies at the 4128–4135 liquidity zone.
- This move will absorb liquidity, attract large buy orders, and prepare the market for the next bullish cycle.
This is the highest-probability scenario, supported by:
Elliott Wave structure
Liquidity mapping
Current price behavior
Psychological flow ahead of major news
3. Market Psychology
- Major timeframes are signaling a short-term correction, not a reversal.
- The market is moving slowly and narrowly, reflecting caution from both sides.
- This type of movements is classic accumulation → compression before volatility expansion.
- Sideways behavior shows the market is collecting orders for the next significant move.
4. Intraday Trading Setups – Correction Strategy
📌 SETUP 1 – Timing Sell Zone
XAUUSD SELL:
👉 4265 – 4268
Take Profit (TP):
🎯 4262 – 4257
Stop Loss (SL):
❎ 4272
⚠️ Apply strict risk management.
📌 SETUP 2 – Timing Buy Zone
XAUUSD BUY:
👉 4147 – 4150
Take Profit (TP):
🎯 4153 – 4158
Stop Loss (SL):
❎ 4143
⚠️ Prioritize capital safety during corrections.
5. Conclusion
The market continues to follow the exact wave cycle previously analyzed:
✔ Wave B: Expected short-term upward retracement
✔ Wave C: Expected decline into 4128–4135 liquidity zone
✔ Overall: Correction phase still dominant
Gold is behaving textbook perfect according to Elliott Wave + liquidity structure.
Stay disciplined, trust the structure — great traders profit from patience, not luck.
XAUUSD(GOLD) BEARISH OR TRAP (READ CAPTION)Hi traders what do you think about gold
Gold (XAUUSD) is currently forming a bearish trade setup, showing weakness below the major resistance zone 4217–4230. This area has rejected price multiple times, indicating strong seller presence.
🔹 Resistance Zone: 4217–4230
This is the main bearish rejection zone.
As long as price stays below 4230, the market remains in a bearish bias.
Any retest of this zone can act as a selling opportunity for continuation moves.
🔹 Support Level: 4180
This is the first support level where short-term buyers may attempt to react.
A clean break below 4180 will confirm further downside continuation.
🔹 Demand Zone: 4150
This is the strong demand area where buyers are expected to become active.
If price drops into 4150, the market may show a bullish bounce, but overall sentiment remains bearish until major resistance breaks.
📉 Market Outlook
Below 4217–4230 → Market remains bearish
Break below 4180 → Opens the path toward 4150 demand zone
First target for sellers → 4180
Second target → 4150 demand zone
This structure shows a clean bearish retracement + resistance rejection setup, ideal for downside continuation trades.

Gold Is Setting a Trap — The Real Move Comes After the LiquidityMarket Analysis — XAUUSD (H1)
1. Current Price Structure
- The market previously created a series of Higher Highs (HH) and Higher Lows (HL) → bullish order flow.
- After the last HH, the price showed multiple CHoCH events → early signs of a shift from bullish to bearish structure.
- Current consolidation is forming around 4,207 – 4,210, with price struggling to regain bullish conviction.
- A rising dotted trendline represents the last support of short-term buyers — once broken, bearish momentum strengthens.
2. Liquidity Zones
- Upper liquidity zone: 4,225 – 4,230 → where you expect price to sweep before reversal.
- Key support: 4,181 – 4,183 → first downside liquidity zone.
- Major target liquidity zone: 4,163 – 4,165 → final liquidity cluster before deeper bearish continuation.
3. Today’s Primary Scenario
This matches the green projection drawn on your chart:
🔹 Main Scenario (Bearish Continuation After Liquidity Sweep)
Price is likely to:
- Push upward to retest the 4,225 zone → sweep liquidity and create a final LH.
- Reject strongly → break the rising trendline.
- Drop into 4,181 → first liquidity target.
- Minor pullback → forming a reactionary LH.
- Continue down toward 4,163 → completing the corrective leg.
This aligns perfectly with the market structure + liquidity logic in your chart.
4. Market Psychology
- Buyers are weakening: repeated CHoCH + BOS bearish signals.
- Liquidity is building above and below → ideal for manipulation before expansion.
- Narrow movement before news = accumulation phase.
- Smart money likely pushes up first, then aggressively sells into trapped buyers.
5. Intraday Strategy Guidance
📌 SELL Setup (High Probability)
Sell Zone: 4,225 – 4,228
TP1: 4,181
TP2: 4,165
SL: 4,232
This aligns perfectly with your chart projection.
📌 BUY Setup (Low Probability – Countertrend)
Buy Zone: 4,163 – 4,166
TP: 4,178 – 4,185
SL: 4,158
⚠️ Notes
• Recent BOS patterns favor continuation to the downside.
• Avoid chasing trades in the middle of liquidity zones
Stay patient — the market always pays those who wait for the right setup, not the fast setup.

Gold Surges Strongly but Fails to Maintain MomentumHello everyone, the recent movement of gold reflects a market heavily influenced by “news-driven support overshadowed by selling pressure.” XAUUSD made an impressive breakout to 4,237 USD/ounce — the highest level in six weeks — as safe-haven flows returned on geopolitical tensions and expectations that the Fed will continue its rate-cut cycle. But only hours later, profit-taking rushed in, sending gold down more than 30 USD and pulling the metal back to the 4,207 USD region this morning.
This weakness mainly stems from improving risk sentiment: US equities rebounded, with the S&P 500 turning green and the Nasdaq pushing higher as tech stocks led the move. Japanese markets also stabilised as bonds cooled, reducing demand for safety. And with the DXY climbing to 99.18, downward pressure on gold became even more evident — a stronger USD rarely favours the precious metal.
From a technical perspective, the 4,180–4,190 FVG zone helped lift price again after the sharp drop, but gold remains capped beneath the upper FVG resistance. The Ichimoku cloud on the 2H timeframe shows price approaching the Kijun–Senkou intersection — an area that historically attracts selling pressure. This keeps the current price action more aligned with a supply retest rather than the beginning of a genuine bullish trend.
In summary, gold is facing an important test. The 4,235–4,245 region remains the key barrier: a breakout could quickly extend momentum toward 4,260–4,285, while another rejection could push XAUUSD back toward 4,190 to collect liquidity before deciding on its next direction.
Gold Surges on Weak US Data but Momentum FadesHello everyone,
Last night, spot gold on the international market saw a sharp rally of several dozen dollars per ounce after the US released a series of economic reports that came in weaker than expected — particularly labour market data, which strengthened expectations that the Fed may accelerate its rate-cutting path. This is generally positive for gold, as lower interest rates reduce the opportunity cost of holding non-yielding assets.
However, shortly after the breakout, the market witnessed a large wave of profit-taking from institutional investors, causing gold to reverse and drop sharply.
The downside pressure did not come solely from profit-taking; it was also reinforced by a US economic backdrop showing mixed and increasingly unstable signals: weak employment data, slowing growth prospects, and rising expectations of imminent Fed rate cuts. These factors have left capital flows uncertain — torn between holding gold for safety or shifting toward risk assets as US equities recover slightly.
From my perspective, gold is now standing at a critical crossroads:
Weak US data could support another upward leg.
A dovish Fed remains a strong underlying foundation.
But persistent profit-taking may prolong the short-term correction.
Gold’s next move will depend heavily on upcoming US economic releases this week and how the market reacts to shifting expectations around the Fed’s monetary policy.
Wishing everyone a clear-headed and successful trading day ahead!
Gold: Bullish Fundamentals, but Technicals Still Blocking the BOHello everyone, gold continues to gain support from macro data after the ADP report showed a surprise loss of 32,000 private-sector jobs, strengthening expectations of a 0.25% Fed rate cut in the December meeting. This normally benefits gold as USD and yields cool down.
However, the chart still refuses to confirm any breakout. Price remains compressed inside 4,195–4,205 with low volume, sitting right on the Ichimoku cloud. Overhead resistance/FVG 4,215–4,225 and support at 4,180 keep price locked in a tight 4,180–4,225 range.
Ahead of today’s PCE data, gold is likely to stay boxed in until the market receives a stronger catalyst from PCE or the Fed.

Gold Buyers Lose Momentum as Correction Risks IncreaseHello everyone,
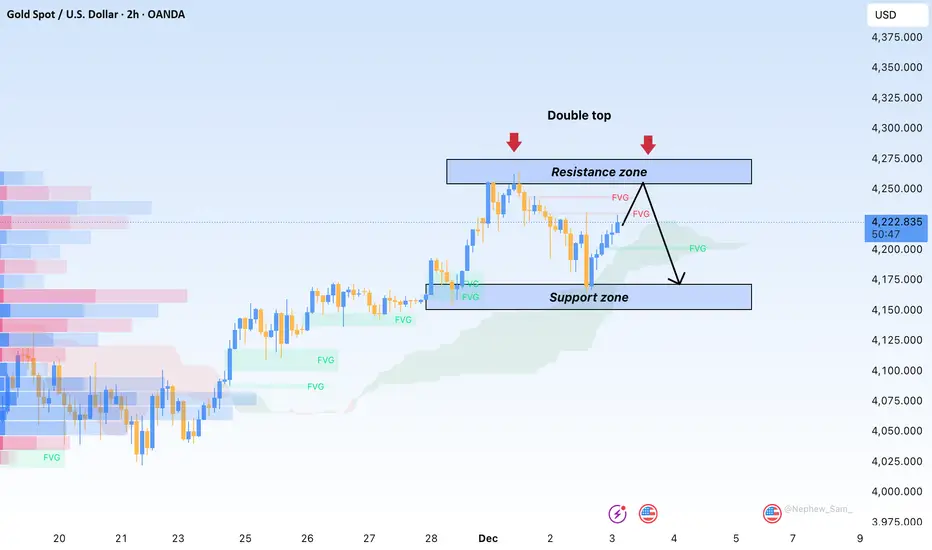
On the H4 timeframe, gold continues to face heavy resistance as it approaches the 4,225–4,235 USD zone — an area that has repeatedly formed bearish FVGs and concentrated liquidity at the highs, causing every bullish attempt to be rejected. The latest strong bearish candle pushed the price below the equilibrium zone and dragged gold back toward 4,200 USD, clearly reflecting a more cautious market sentiment as buyers fail to maintain previous momentum.
From a structural perspective, gold is moving within a weakening sideways phase, consistently forming lower highs around 4,230–4,235 USD. This signals that buyers have lost their advantage, while larger players appear to be distributing positions at resistance. Although the price still trades above the Ichimoku cloud edge, consecutive candle closes below the equilibrium line are creating visible corrective pressure. This pattern is typical before gold attempts a deeper downward move to sweep liquidity beneath current levels.
The Volume Profile further reinforces this view. The dense trading range observed between 11–19 November has established a strong supply zone at 4,220–4,235 USD. Every time the price retests this area, immediate selling pressure emerges, showing sellers are defending the zone effectively while buyers lack the strength to break through. The combination of weakening structure, resistance FVGs, and a significant supply cluster continues to elevate the short-term correction risk for gold.

GOLD MARKET ANALYSIS AND COMMENTARY - [Dec 08 - Dec 12]At the beginning of this week, international OANDA:XAUUSD prices fell from 4,264 USD/oz to 4,164 USD/oz, then recovered to 4,259 USD/oz, before declining again and closing the week at 4,198 USD/oz.
International gold prices continue to rise, hovering around 4,200 USD/oz as U.S. inflation remains relatively stable and data shows the country’s labor market is clearly slowing, reigniting expectations of interest rate cuts ahead of the upcoming Federal Reserve meeting. According to CME’s FedWatch tool, the market is once again pricing in nearly a 90% probability that the Fed will continue cutting interest rates at next week’s meeting.
According to many experts, an interest rate cut by the Fed at the upcoming meeting may not significantly affect gold prices next week, as this has already been priced into gold during recent trading sessions. However, if the Fed signals more rate cuts in 2026 compared to the guidance given at its September meeting, it could provide a stronger boost for gold prices.
Besides pressure from lower interest rates, the U.S. is also facing a large budget deficit and massive public debt, meaning it will have to inject a considerable amount of money into the economy. This not only carries the risk of driving inflation higher but also poses potential instability for the U.S. economy in particular and the global economy in general.
Overall, the future trajectory of gold prices will depend on whether the Fed continues to ease monetary policy, or whether macroeconomic conditions—such as weaker growth or rising geopolitical risks—emerge. To reach a new all-time high, gold prices will require a combination of more aggressive Fed rate cuts, continued weakening of the U.S. dollar, stronger safe-haven demand, and especially more robust gold buying from central banks.
In addition to the Fed’s monetary policy meeting, the Reserve Bank of Australia, the Bank of Canada, and the Swiss National Bank will also announce their interest rate decisions. The market expects all three central banks to keep interest rates unchanged.
📌Technically, gold is showing signs of sideways movement with a narrowing range on the H4 chart, the resistance level is established around the 4,264 mark, breaking through this level will create momentum for gold prices to find the 4,380 mark. In case gold prices trade below the 4,200 mark, next week the price may only fluctuate in the range of 4,100-4,265 USD/oz.
SELL XAUUSD PRICE 4222 - 4220⚡️
↠↠ Stop Loss 4226
BUY XAUUSD PRICE 4168 - 4170⚡️
↠↠ Stop Loss 4164

Stop!Loss|Market View: GOLD🙌 Stop!Loss team welcomes you❗️
In this post, we're going to talk about the near-term outlook for GOLD ☝️
Potential trade setup:
🔔Entry level: 4167.192
💰TP: 3900.356
⛔️SL: 4370.061
"Market View" - a brief analysis of trading instruments, covering the most important aspects of the FOREX market.
👇 In the comments 👇 you can type the trading instrument you'd like to analyze, and we'll talk about it in our next posts.
💬 Description: After breaking out of the accumulation in a symmetrical triangle, gold prices formed an accumulation near the 4200 level, indicating the emergence of a potential limit seller who, after breaking out of the accumulation, will sell the instrument to those willing to buy at the breakout. Against this backdrop, a downward movement is likely expected, and given the potential volatility this week, two scenarios are being considered.
Thanks for your support 🚀
Profits for all ✅

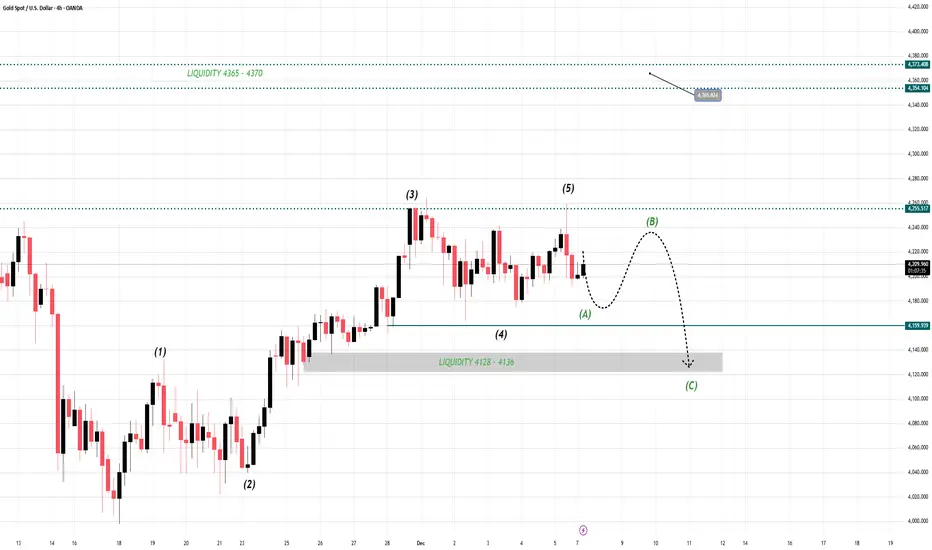
Gold Is Preparing for a Deep Liquidity SweepMost traders chase the final push of wave (B) and get trapped right before the market reverses. When you understand wave structure + liquidity zones, you stop trading emotions and start trading precision.
📌 1. Market Structure
Gold has just completed a 5-wave impulsive structure (1 → 5) into the resistance zone.
Immediately after wave (5), price shifted into a corrective phase, forming leg (A) downward.
This is classic Elliott behavior: Impulsive (5 waves) → Corrective (ABC).
Current structure is entering wave (B) retracement before dropping into wave (C).
📌 2. Key Zones
Resistance Zone:
Price reacted strongly at the previous swing-high cluster where wave (5) completed — confirming heavy sell orders.
Support Zone:
The zone around wave (2) & (4) provided multiple rejections, but a break below (A) suggests this support is weakening.
Liquidity Zone (Target): 4128 – 4136
This is the major liquidity pocket where the market likely aims for a sweep during wave (C).
📌 3. Price Action
- Wave (A) formed with clear momentum down.
- Current upward leg into (B) shows weaker volume, typical of a corrective pullback.
- The projected path shows price retesting resistance before a deeper drop.
- Structure is no longer bullish — it’s transitioning into a corrective sequence.
- The dashed path is perfectly aligned with typical ABC behavior.
📌 4. Technical Confirmation
- Wave Theory: 5-wave impulse completed → ABC retracement is expected.
- Liquidity Map: Price has unfinished business at the 4128–4136 zone.
- Support Break: Wave (A) broke below the previous minor support, shifting short-term bias bearish.
- Resistance Rejection: Wave (B) is likely to fail at the previous top structure.
Everything aligns with a bearish continuation into wave (C).
📌 5. Trading Plan
🎯 SELL Setup (High probability)
Entry: 4,230 – 4,255 (top of wave B retracement)
Stop-Loss: 4,290 (above previous swing & invalidation of B)
Take Profit 1: 4,165
Take Profit 2: 4,140
Final Target: Liquidity 4128 – 4136 (wave C completion)
Why this setup is strong:
You are shorting into the end of wave B, which typically traps breakout buyers before wave C dumps sharply.

Gold Bulls Are Making Hard Work of New HighsI remain sceptical of gold’s latest bounce and continue to look for signs of a swing high. A less-dovish — or relatively hawkish — Fed cut this week could be the catalyst for a stronger US dollar and lower gold. Either way, it’s hard to imagine gold breaking back above its record high without a meaningful dip first.
Matt Simpson, Market Analyst at City Index.

Gold 1H – Will 4232 Trap Liquidity or 4170 Spark Expansion?🟡 XAUUSD – Intraday Smart Money Plan | by Ryan_TitanTrader (08/12)
📈 Market Context
Gold trades inside politically-driven liquidity as Donald Trump signals that the current method of tariffing through the US Supreme Court is “more direct, less cumbersome, and much faster.”
This introduces fresh uncertainty for USD flows, increasing short-term volatility across commodities.
Expect engineered sweeps on both sides as institutions react to policy-sensitive sentiment shifts.
On H1, price compresses between premium supply (4230–4232) and discount demand (4170–4168).
A confirmed MSS + BOS + displacement is required before any directional leg becomes valid.
🔎 Technical Framework – Smart Money Structure (1H)
Current Phase: Liquidity-rich compression inside a minor bullish channel
Key Idea: Sweeps first, real move later
Liquidity Zones & Triggers
• 🔴 SELL GOLD 4230 – 4232 | SL 4240
• 🟢 BUY GOLD 4172 – 4170 | SL 4162
Bias shifts only via structural break + clean displacement.
Expected Institutional Sequence:
sweep → MSS/CHoCH → BOS → displacement → FVG/OB retest → expansion
🎯 Execution Rules (matching your exact zones)
🔴 SELL GOLD 4230 – 4232 | SL 4240
Rules:
✔ Price taps 4231–4232 → bearish MSS/CHoCH on M5–M15
✔ BOS down + strong displacement candle
✔ Entry on bearish FVG fill / supply OB retest
Targets:
1. 4200
2. 4185
3. 4170
🟢 BUY GOLD 4172 – 4170 | SL 4162
Rules:
✔ Sweep below 4169 → bullish MSS/CHoCH
✔ BOS up + displacement from discount
✔ Entry on FVG fill or refined OB retest
Targets:
1. 4186
2. 4210
3. 4230 – 4232
⚠️ Risk Notes
• Headlines may induce fake sweeps; do not pre-commit without BOS + displacement
• No averaging inside compression
• SLs must sit at structural invalidation
• Reduce risk during tariff-related spikes
📍 Summary
Today’s playbook offers two institutional paths:
• 4231 sweep → bearish MSS → BOS → retest → delivery into 4170
or
• 4169 sweep → bullish MSS → BOS → retest → expansion back toward 4230+
Trade confirmations only.
Let gold show its hand — patience is your edge. ⚡️
📌 Follow @Ryan_TitanTrader for daily Smart Money breakdowns.

Gold Supported by the Fed but Still Trapped Near 4,200 USDGold opened around 4,209 USD/ounce — about 10 USD higher than last weekend — mainly thanks to continued weakness in the US Dollar as the DXY broke below 99 and slipped to 98.9. At the same time, markets are broadly aligned with expectations that the Fed will cut another 0.25% at the 10 December meeting, creating a favourable backdrop for gold as both yields and USD remain depressed. From a macro perspective, gold is clearly being “supported,” but on the 2-hour chart this still looks like a rebound within the broader 4,200 consolidation box — not yet enough to confirm a new bullish leg.
Structurally, the medium-term trend remains upward, with gold forming higher lows since late November. However, what stands out is the inability of recent highs in the 4,245–4,250 region to surpass previous peaks. This signals weakening buying pressure as price approaches the upper range, locking the market inside the 4,185–4,230 zone — essentially a tight tug-of-war between buyers and sellers. While the macro trend remains bullish, the short-term structure is leaning toward a sideways–corrective mode, reflecting a market waiting for PCE data and the upcoming Fed meeting.

XAUUSD: The Calm Before the BreakoutOANDA:XAUUSD Over the past few sessions the price has shown remarkable strength, yet the market has recently slowed and slipped into a sideways phase. This type of behavior is common after a strong rally and does not necessarily indicate weakness. It is more of a natural pause, allowing buyers to regroup while maintaining control of the overall trend.
The decisive moment will come if the price breaks convincingly above the upper boundary of this consolidation. That would confirm that bullish momentum is returning and that the market is preparing to move toward new highs.
This is the scenario I am watching: a calm accumulation phase, a temporary slowdown, and then a renewed move higher once consolidation has run its course. At this stage, the breakout appears less like a possibility and more like something that is gradually taking shape.

Will the Sky clear for higher Goldprice? Week 8-12 DecContext: After a quiet week with little impact from economic data, Gold FX_IDC:XAUUSD has been moving sideways within a triangle structure. The US economy looks resilient—better than many expected—shifting all eyes to the FED rate cut decision this Wednesday. 🇺🇸👀
📅 Market Recap:
Mon Dec 1 (Asia Session): Price pumped +$60 up to $4264, only to dump -$101 back down to $4163, sweeping liquidity in the beginning of the US Session. 🧹
Consolidation: Since then, Gold has consolidated in a narrow range between $4190 and $4226. ↔️
Friday: US Inflation data was less dramatic than feared, but Gold still dropped around -$64, closing the week near $4191.
🔥 The Week Ahead:
We have key dates coming up, but with the Rate Cut Decision pending on Wednesday, data needs to be dramatic to force a major move before then.
Quiet/Choppy markets until Wednesday. 💤
The Exception: Tuesday, when US Job Data is released. 📊
🎯 The Trade Setup:
If the US Job Market remains stable, there is room for further downside. I am watching for a dip to sweep liquidity before looking for entries.
📉 Downside Targets (Buy Zones):
Primary Target: $4150 🥇
Secondary Target: $4110 🥈
There is strong support between this zones, so it is very possible the drop stops right at $4150 without reaching the second target.
🐂 Strategy: I see the market chopping sideways until the announcement. My plan is to look for LONG positions 🚀 if price sweeps into my targets ($4150 / $4110).
My last idea about was not longer valid because the right shoulder did not went down, but a Quasimodo pattern could be a thing... Maybee FED does skip the cut? Let's see...
-------------------------------------------------------------------------
This is just my personal market idea and not financial advice! 📢 Trading gold and other financial instruments carries risks – only invest what you can afford to lose. Always do your own analysis, use solid risk management, and trade responsibly.
Good luck and safe trading! 🚀📊

GOLD Consolidation Starts (Correction zone) Buyers Slow ExitNow after the all time high of 3482.
GOLD enters into a Consolidation zone Starts or (Correction zone) Buyers Slow Exit.
So at current market price 4180 Sell and again buy at 4000 and again sell at 4170 range and again buy at 3890 and again sell at 4050 and again buy at 3890 and again sell at 4160 and again buy at 3737.
This is for Education Purpose only, am still testing WD Gann theory!

THE KOG REPORTTHE KOG REPORT:
In last week’s KOG Report we said we would look for the price to tap into the lower level where we wanted a bounce to then target the red box above. We managed to get that long into the defence level for it to give us a nice tap and bounce again giving the short and following the path into the lower defence box. It’s here that we faced the range but as you can see we failed to breach the box, hence giving us that opportunity to target that long into the active defence above again.
We then mentioned we would protect and manage and see if there is another reaction or breach at that box, leading to price rejecting again following the range and completing all our targets as well as the hot spots for the week.
A successful week in Camelot not only on Gold but also the other pairs we trade and analyse.
So, what can we expect in the week ahead?
For the start of the trading week we have two key levels to keep an eye on, 4175 support and 4210 resistance. These are the levels that need to be broken either side in order to make the next move, and could be the range we play for Monday as there is no economical catalyst to bring the extra volume into the market.
For that reason, we’ll stick with the plan from last week, apart from looking for price to create that higher high before attempting the lower defence level.
There is strong support here on the close so if we can get an undercut low here we can bounce into that 4210 level and above that 4220 which is the level that will need to hold! As long as we can stay below, we should see price attempt the lower levels initially starting with our target level 4180 and below that 4155.
As you can see on our chart, our ideal long opportunity comes from the lower level which is also our potential target and a region we would like to see a RIP!
The levels are on the chart as our the red boxes which have proven to be effective for swing and intra-day trading.
RED BOXES:
Break above 4210 for 4220, 4230, 4235 and 4240 in extension of the move
Break below 4190 for 4180, 4173, 4165, 4155 and 4147 in extension of the move
Please do support us by hitting the like button, leaving a comment, and giving us a follow. We’ve been doing this for a long time now providing traders with in-depth free analysis on Gold, so your likes and comments are very much appreciated.
As always, trade safe.
KOG

XAGUSD 1h
Silver hold the price above a resistance line in the consolidation zone, if the 4h candle closed above this line there would be chance to move upward, also for swingers, we need to see close of daily candle above the box to meet ATH.
Stay tuned for our next updates.

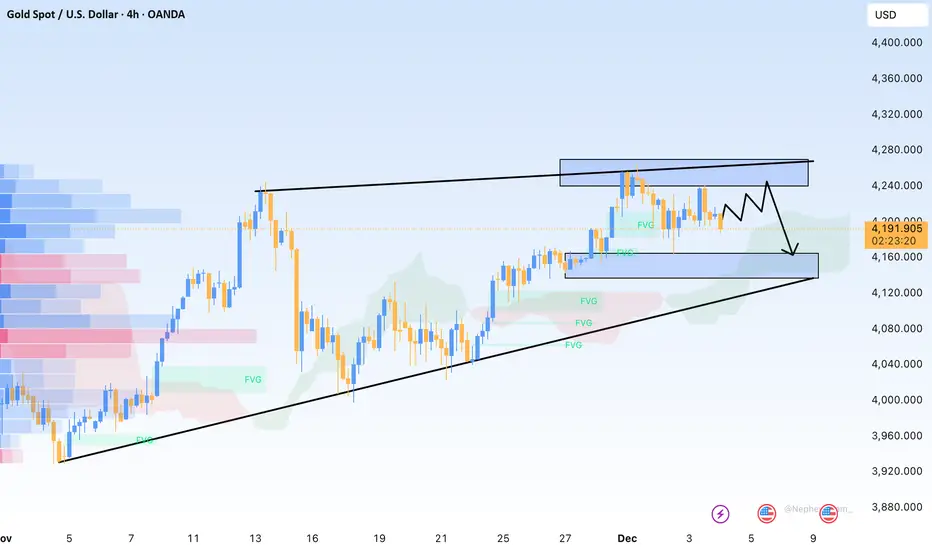
XAUUSD 4H MA50 break signals lower prices.Gold (XAUUSD) has been trading within a Channel Up in the past 1.5 month. Within this pattern, every time the 4H MA50 (blue trend-line) broke downwards, the price tested the Higher Lows trend-line.
As a result, we expect Gold to reach 4115 next, which will be an interesting cluster as marginally below will be the Support Zone o the 4H MA200 (orange trend-line) and more importantly the 1D MA50 (red trend-line). That will most likely decide the long-term trend.
---
** Please LIKE 👍, FOLLOW ✅, SHARE 🙌 and COMMENT ✍ if you enjoy this idea! Also share your ideas and charts in the comments section below! This is best way to keep it relevant, support us, keep the content here free and allow the idea to reach as many people as possible. **
---
💸💸💸💸💸💸
👇 👇 👇 👇 👇 👇

XAU/USD – Major Resistance Test With Potential Bearish ContinuatXAU/USD is approaching a major resistance area near 4260, where price has previously shown strong rejection. The recent rising channels on the chart indicate short-term bullish attempts, but each move has been followed by a corrective decline, showing weakening momentum.
If the market fails to hold above the nearby structure, a move toward the 4167 support zone may develop. A clear break below this level could signal a stronger bearish continuation toward lower liquidity levels.
For now, price remains between resistance pressure above and structural support below, making these two zones important for the next directional move.
Key Levels to Watch:
Resistance: 4260
Support: 4167
Bias: Bearish if support breaks, neutral while price ranges

As long as the trend support holds, the outlook remains bullish#XAUUSD OANDA:XAUUSD TVC:GOLD
Looking at the intraday trend, the overall volatility was very limited, but it did not break the upward trend line. The short-term support level to watch is 4200-4185. If the price does not break through the support level on the first pullback, we can continue to consider going long on gold. Pay attention to the short-term resistance level at 4235-4245.
