MSTR Trade Setup – BTC Correlation PlayMicroStrategy NASDAQ:MSTR caught a strong bid in yesterday’s session, driven by upward momentum in Bitcoin (BTC). With MSTR’s heavy BTC exposure, it often mirrors crypto market trends—and right now, it’s pressing against a key resistance zone.
🟢 Setup:
We're watching the $173.00 resistance level for a potential breakout and clean retest. A successful confirmation above this zone would trigger a long spot entry. Volume confirmation and BTC’s price action will be critical for conviction.
🎯 Targets & Risk:
TP Zones: $200–$230, then $280–$320
Stop Loss: Below $155
This is a momentum-based setup tied closely to BTC’s direction. Monitoring both charts is essential for trade management.
Microstrategy

MSTR Macro analysis | The bigger picture | Long-term holdersNASDAQ:MSTR
🎯 Sentiment is low, the asset is hated and misunderstood by TradFi and retail. It’s a recipe for a bottom! Price is now below the weekly 200EMA and pivot, in wave 4, hitting the 0.382 Fibonacci retracement. The bears are in control.
📈 Weekly RSI hit oversold with hidden bullish divergence
👉 Analysis is invalidated if we close back below $101
Safe trading

MSTR Short-term analysis | Trading and expectationsNASDAQ:MSTR
🎯 Price dropped hard wave Y of 4, invalidating the previous analysis. Wave Y can complete any time in this flat correction pattern, but is approaching the 0.382 Fibonacci retracement, a high probability bottom.
📈 Daily RSI went deep into oversold on bullish divergence
👉 Continued downside has a target of the S1 pivot, $136
Safe trading

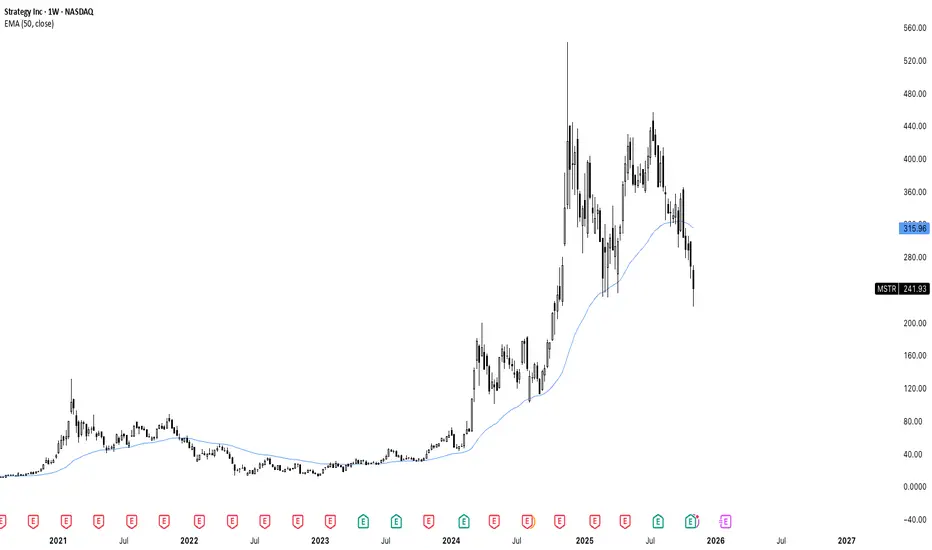
STRATEGY Is this a 2000 Dotcom crash all over?Strategy (MSTR) has been on a strong sell-off since its November 2024 All Time High (ATH). A little more than 1 year of downtrend is classified as a Bear Cycle and it may be no coincidence that this ATH was priced marginally above Strategy's previous ATH of March 2000.
That was at the peak of the infamous Dotcom Bubble and its subsequent collapse. So are we having a 2000 crash all over again? Well, with Strategy's core business being exclusively Bitcoin related, we are poised to have a big one (since it follows BTC's Cycle to a certain extent) but not just as enormous as 2000's, which exceeded -99%, dropping the company to the brink of extinction.
Technically, we can have a correction of -90% though, which is the decline that the previous Bear Cycle in 2022 suffered. After all the dominant multi-decade pattern since the Dotcom bottom, has been a Channel Up, with the recent ATH testing its top and the 1M MA200 (orange trend-line) marking its Lows, hence the best buy opportunities in the last 10 years.
As a result, our long-term Target on MSTR remains $60.00, which would be a -90% correction from the Top, while also making direct contact with the 1M MA200. P.S. Notice also the similarities between the 1M RSI sequences.
---
** Please LIKE 👍, FOLLOW ✅, SHARE 🙌 and COMMENT ✍ if you enjoy this idea! Also share your ideas and charts in the comments section below! This is best way to keep it relevant, support us, keep the content here free and allow the idea to reach as many people as possible. **
---
💸💸💸💸💸💸
👇 👇 👇 👇 👇 👇

MSTR: Now I can't unsee itWas on a Livestream Friday talking about my (now closed) short and migrated to the Monthly timeframe on $NASDAQ:MSTR. I've seen this pattern many times before and now I can't unsee it.
Turns out there is nothing new under the sun... of finance. All the same patterns of human behavior repeat just with different narratives.

BTC = Bout To Collapse
I'm not trading bitcoin, but I trade the highly correlated stock Microstrategy. This is a pristine setup before the Asian session punishes Bitcoin for that faux breakout we saw into market close.
The downtrend on the daily chart is the dominant trend on BTC right now, and cracked the whip anytime Bitcoin even thought about crossing that downtrend.
BTC hit massive daily resistance.
Asia rarely breaks resistance overnight.
Max pain favors a move DOWN, not up.
Dealers are short gamma into the strike zone you’re playing.
Your deltas (–0.41) will explode to –0.55 to –0.70 on a gap-down.
IV crushed today → will expand tomorrow morning, benefiting you.
MSTR ALWAYS overreacts to BTC.
Strong Open Interest build at 185, 180 and 175 - temporarily OTM ;)
Max pain sits well below current price on MSTR of $186 at $175
Market Makers hedge delta, not max pain
The largest Open Interest of call options sit at $190.
My prediction for Bitcoin and MSTR for 12/5:
BTC opens below 91,400 and MSTR opens below $183
Under $183, Market Makers hedge mildly bearish
Under $181, MM's hedge strongly bearish (accelerating fall similar to what we saw today around 2-2:45pm)
Under $179, Gamma Squeeze in control - move down accelerates
Under $177, MMs forced to short to $175 (current max pain level)
Under $175, Max pain magnet realized. If we hit $175 - expect price to be pinned by MMs.
Options are pricing in a big downward movement for the overnight session pointing at a 65-70% likelihood of a big selloff.

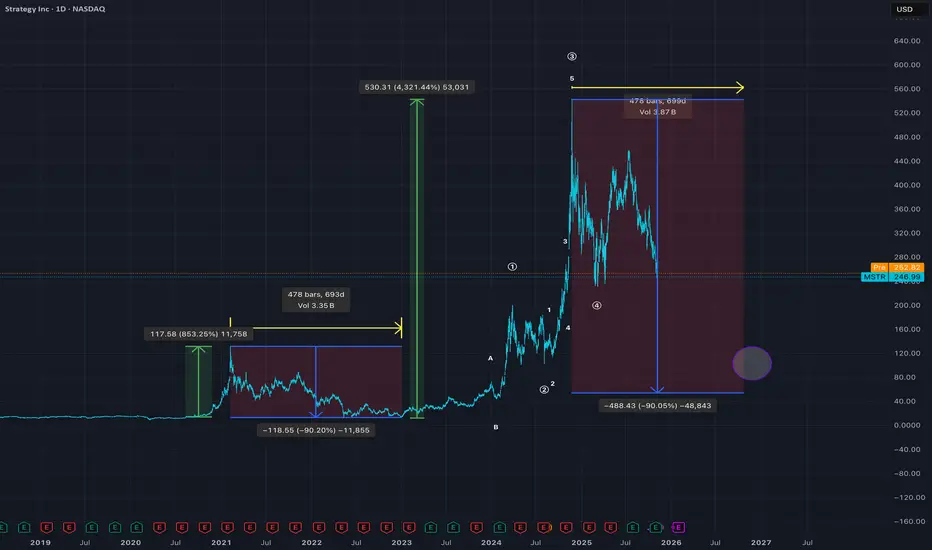
STRATEGY Mirror crash with 2022 to $60 has started.Michael Saylor won't like this. But the chart is what it is and that's an objective dynamic.
** The 5-year Channel Up and Bear Cycle **
Strategy (MSTR) has been trading within almost a 5-year Channel Up since the February 2021 Top of its previous Cycle. Within this lines, it has had its latest top (Higher High) on the week of November 18 2024 and since then it has been on a structured strong decline.
This decline has gotten even stronger once the price broke below its 1W MA50 (blue trend-line). So far, the 2025 correction is mirroring the 2021 one, which was the start of a 2-year (2021/21) Bear Cycle.
** The three Stages **
Based on that, we have valid reasons to expect that 2026 will also mirror the past Bear Cycle. What stands out on this analysis is that we have classified the whole Bear Cycle into three Stages. Based on that, we have now already entered Stage 2 as the price has broken below its 1W MA50 (and should stay as the Resistance for the remainder of the Cycle) and almost touched its 1W MA200 (orange trend-line). When that happened in January 2022, the market rebounded towards the 1W MA50 where it was rejected and when it broke below the 1W MA200 as well, Stage 3 started. This Stage made the Bear Cycle bottom on the 1M MA250 (red trend-line) after a -90% decline in total. It was completed when the price broke above the 1W MA50 again, essentially confirming the start of the new Bull Cycle.
** Where is the bottom now? **
As a result, we may now see a short-term rebound, limited by the 1W MA50, which after it gets rejected and breaks below the 1W MA200, Stage 3 may start. If this Bear Cycle also crashes by -90%, we should then be expecting a bottom at $60 (at least), supported by the 1M MA250 again.
Notice also the striking symmetry among the 1W RSI patterns of the two Cycle fractals. The 1W RSI has currently hit the 30.00 oversold barrier (similar to Jan 2022) and it was a second break and then a Higher Lows Bullish Divergence that confirmed the bottom of the Bear Cycle, essentially turning Strategy Inc. into a long-term buy opportunity again.
---
** Please LIKE 👍, FOLLOW ✅, SHARE 🙌 and COMMENT ✍ if you enjoy this idea! Also share your ideas and charts in the comments section below! This is best way to keep it relevant, support us, keep the content here free and allow the idea to reach as many people as possible. **
---
💸💸💸💸💸💸
👇 👇 👇 👇 👇 👇

MSTR when will it end? Soon...NASDAQ:MSTR Sentiment is low, the asset is hated and misunderstood by TradFi and retail. It’s a recipe for a bottom!
Price hit the weekly 200EMA in wave 4. Not much more to add, there is room to fall to $101 High Volume Node, but a bottom should emerge soon.
🎯 Terminal target for the business cycle could see prices as high as $1000 based on pivots
📈 Weekly RSI hit oversold with bullish divergence from wave 2
👉 Analysis is invalidated if we close back below $84
Safe trading
Why We Loaded $MSTR at $169 (5:1 Risk/Reward to $355)Have you ever watched a stock pull back 65% and wondered if it was opportunity or disaster?
Have you ever missed a major setup because fear told you to stay away?
This analysis breaks down why NASDAQ:MSTR at $169 presented a textbook geometric retracement opportunity with exceptional risk/reward asymmetry.
Hello ✌️
Spend 3 minutes ⏰ reading this educational breakdown of structure-based position entry.
🎯 Analytical Insight on MSTR
MicroStrategy pulled back from $543 to $169 a 65% retracement that brought price directly into a major accumulation zone. This wasn't random. It aligned perfectly with:
Fibonacci retracement from 2020 lows to 2024 highs
A long-term ascending trendline dating back to 2020
The monthly $112 support zone that held as a floor
Our position entry: $169
Our invalidation level: $131.80 (below structure)
Our first target: $360 (previous resistance zone)
Risk: $37.20 per share
Reward: $191 per share
Ratio: 5.13:1
This setup didn't require predicting the future. It required identifying where risk was defined and reward was probable based on historical price structure.
📚 Educational Section: Why Geometric Retracements Work
The Psychology of Pullbacks
When price drops 65%, most traders experience:
Fear that it will continue falling forever
Doubt about whether the trend is still valid
Paralysis from watching others panic sell
Professional traders see the same chart differently:
Defined risk at structural support
Historical patterns of mean reversion
Favorable asymmetry when risk is small relative to potential reward
The majority fears what professionals buy.
📉 Understanding Market Structure
Markets don't move in straight lines. They:
Trend in one direction (impulse)
Retrace to gather liquidity (correction)
Resume the primary direction (continuation)
The 0.618 to 0.786 retracement zone historically shows the highest probability of reversal in trending assets. Why?
Early sellers have exhausted
Value buyers recognize the discount
Risk can be defined tightly below support
At $169, MSTR offered:
Clear invalidation below $131.80
Multiple timeframe confluence
Structural support from prior consolidation
🎯 Why This Entry Made Sense
Risk Was Defined
Below $169, the next logical support was $131.80. If price broke below that level, the bullish structure would be invalidated. This gave us a clear exit point before entering.
Reward Was Probable
The previous resistance zone at $360 represented a 113% gain from entry. Even a conservative 50% retracement would target $220+, still offering excellent reward.
Structure Aligned
Monthly support held
Trendline from 2020 intact
Retracement zone tested multiple times
Volume showed exhaustion, not acceleration
📊 Tools Used for This Analysis
Fibonacci Retracement
Identified the 0.786 level as a deep pullback zone where buyers historically step in.
Trendline Analysis
The ascending line from 2020 provided dynamic support that price respected.
Volume Profile
Showed accumulation at lower levels with decreasing selling pressure.
Horizontal Support Zones
The $105-110 monthly level acted as a psychological floor, preventing further collapse.
Risk/Reward Calculator
Entry: $169
Stop: $131.80
Target: $360
Result: 5.13:1 asymmetry
🛡️ Risk Management Framework
Stop Loss Below Structure
Our stop at $131.80 was placed below the invalidation point. If price reached that level, our thesis would be wrong and we'd exit with controlled loss of $37.20 per share.
Position Sizing Based on Risk
With $37.20 risk per share, position size was calculated to risk only 1-2% of total capital. This meant even if wrong, the account remained intact.
Target Based on Structure, Not Hope
$360 wasn't arbitrary. It represented previous resistance where sellers had historically appeared. We planned to reduce exposure at that level.
🧠 Trader Psychology: Why Most Miss These Setups
Fear of Catching a Falling Knife
After a 65% drop, the brain assumes it will continue. But without defined support, there's no knife just falling into the void. At $169, support was visible and the stop at $131.80 was clear.
Recency Bias
The most recent price action (the drop) feels like it will continue forever. Historical structure suggests otherwise, but emotions overpower data.
Herd Mentality
When everyone is bearish, contrarian positions feel uncomfortable. But the best risk/reward setups rarely have crowd consensus.
Waiting for Confirmation
Many traders wait for price to "prove" itself by moving higher first. By then, risk has expanded and reward has diminished. Entry at $169 with $37.20 risk is superior to entry at $250 with $118.20 risk to the same stop level.
📌 Proper Entry Execution
We didn't enter the entire position at once:
First third at $169 (initial position)
Second third at $155 if support retested (average down if structure held)
Final third reserved if $140 tested (closer to stop but maximum opportunity)
This scaling approach:
Reduced emotional pressure
Improved average entry if structure tested
Maintained discipline through volatility
🏆 What Professionals Do Differently
They Don't Chase Momentum
Entry at $543 (the top) felt safe because price was rising. Entry at $169 felt dangerous because price was falling. Professionals understand that perceived safety is often maximum risk.
They Define Risk First
Before asking "how much can I make," they ask "how much can I lose." The $131.80 level answered that question clearly.
They Accept Being Wrong
If MSTR broke $131.80, the position would be exited without hesitation. No hoping, no averaging down into a broken structure. Wrong is wrong.
They Journal Every Decision
Entry logic, risk parameters, and target zones were documented before entry. This removes emotion from exit decisions later.
🎯 Key Takeaways
✅ Risk/reward asymmetry matters more than being right: A 5:1 setup allows you to be wrong multiple times and still profit overall if position sizing is consistent.
✅ Structure defines opportunity: Random entries have random outcomes. Entries at defined support with clear invalidation have statistical edges.
✅ Emotions are the enemy: When $169 felt scary, that was the signal. When $543 felt safe, that was the warning.
✅ Patience beats prediction: We didn't predict $169 was the bottom. We identified it as a zone where risk was small ($37.20) and reward was large ($191). That's enough.
⚠️ Important Disclaimers
This analysis is educational and reflects a specific position entry based on technical structure. It is not financial advice or a recommendation to buy or sell MSTR or any security.
Position entries, stop losses, and targets are shared for educational purposes to demonstrate risk management principles. Your risk tolerance, timeframe, and capital allocation should differ based on your individual circumstances.
Past price structure does not guarantee future performance. MSTR could have broken $131.80 and invalidated this setup entirely, resulting in a controlled loss. Not all setups work, which is why risk management exists.
Always conduct your own analysis, consider your risk tolerance, and consult with a financial professional before making investment decisions. All trading and investing involves risk of loss.
✨ Support This Content
If this breakdown helped you understand structure-based entries and risk management, leave a comment with your thoughts or questions. Your engagement helps us create more educational content like this.
📜 Do your own research. Manage your risk. Trade with discipline.

MSTR nearing bottom?NASDAQ:MSTR Price dropped hard wave Y of IV, invalidating the previous analysis.
Wave Y can complete any time in this flat correction pattern, but is approaching the 0.382 Fibonacci retracement, a high probability bottom.
📈 Daily RSI went deep into oversold, negating the bullish divergence
👉 Continued downside has a target of the High Volume Node, $101
Safe trading

MSTR still bullish. MSTR bullishness is still intact but it should close above the upper yellow line for the bullishness confirmation intact. If that happens then there's a big possibility that we will see a big sharp last parabolic run to new ATH. Of course this is not financial advised.
If this failed then the last hope is on the Red Line.

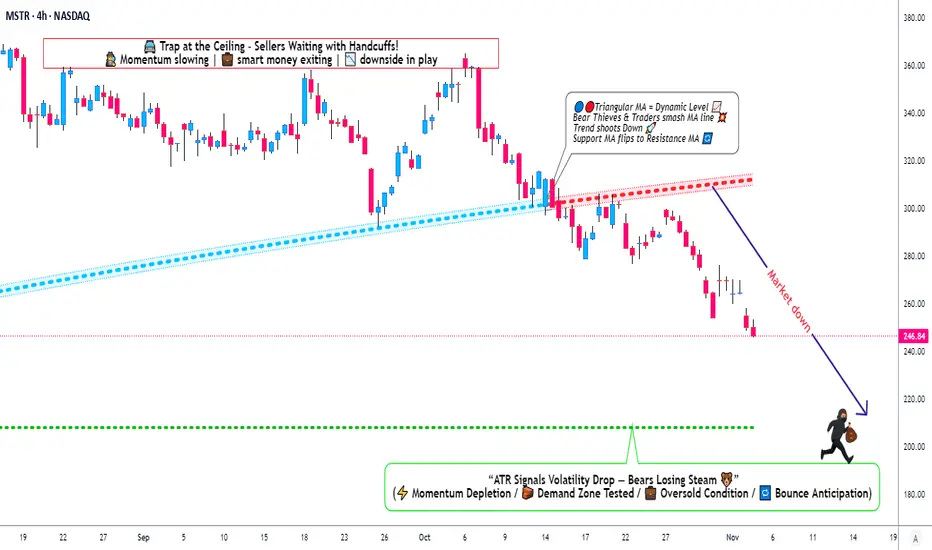
MicroStrategy Under Pressure: Bearish Playbook in Action🎯 MSTR: The "Thief's Playbook" - Strategic Bear Trap Setup! 💰🔥
📊 Asset Overview
MicroStrategy Inc. (MSTR) - Bitcoin's Proxy Play in the Stock Market
🎭 The Setup: When Bears Come to Party
Alright folks, gather 'round! We've got ourselves a textbook triangular moving average breakdown on MSTR that's screaming "short opportunity" louder than my portfolio after a bad trade week! 😅
Current Market Sentiment: 🐻 BEARISH CONFIRMED
The technicals are aligning like planets before a lunar eclipse - and trust me, this eclipse might cast some shadows on those long positions!
🎯 The "Thief Strategy" Game Plan
🚪 Entry Zones - The Layering Approach
Here's where it gets spicy! 🌶️ Instead of going all-in like a degen at a casino, we're using the "Thief Layering Method" - multiple limit sell orders to scale into this position:
Suggested Entry Layers:
🥇 Layer 1: $300
🥈 Layer 2: $290
🥉 Layer 3: $280
💎 Layer 4: $270
🔥 Layer 5: $260
Pro Tip: You can add MORE layers based on your risk appetite and account size. More layers = Better average entry = Smoother sleep at night! 😴
🛡️ Risk Management - The "Oh Sh*t" Line
Stop Loss: 🚨 $320
⚠️ IMPORTANT NOTICE: Dear Thief OGs, Ladies & Gentlemen! This SL is MY line in the sand. YOU need to decide YOUR own risk tolerance. Trade at your own risk, manage your own money, and don't blame me if things go sideways! This ain't financial advice - it's entertainment with charts! 🎪
🎁 Target Zone - Where We Cash Out
Take Profit Target: 🎯 $210
Why $210?
💪 Strong historical support level
📉 Oversold territory expected
Classic bull trap zone where longs get liquidated
⚠️ ANOTHER IMPORTANT NOTICE: Thief OGs! This is MY target. You do YOU! If you see profits earlier and want to secure the bag - DO IT! Don't be greedy. Take profits when YOU feel comfortable. Your account, your rules, your responsibility! 💼
🔗 Related Assets to Watch - The Correlation Game
Keep your eyes on these bad boys for confirmation:
📈 Direct Correlations:
NASDAQ:MARA (Marathon Digital) - Bitcoin miner, moves with crypto sentiment
NASDAQ:RIOT (Riot Platforms) - Another BTC miner, similar volatility pattern
NASDAQ:COIN (Coinbase) - Crypto exchange, sentiment indicator
CRYPTOCAP:BTC (Bitcoin spot) - The godfather! MSTR holds massive BTC, direct correlation
🧠 Key Points:
MSTR trades with ~1.5x-2x Bitcoin beta (more volatile than BTC itself)
When Bitcoin dumps, MSTR often dumps HARDER 📉
Watch BTC support at $60K - if it breaks, MSTR likely follows to our target zone
Tech sector weakness ( NASDAQ:QQQ , AMEX:SPY ) adds bearish pressure
⚡ Trading Psychology - The "Thief Mindset"
Look, this setup requires PATIENCE! 🧘♂️ Don't FOMO in at market price. Layer in like a professional thief planning a heist - calculated, methodical, strategic! This isn't gambling; it's probability management with a side of humor! 😎
🎪 Final Word from Your Friendly Neighborhood Chart Thief
Remember: Markets are wild, unpredictable, and don't care about your feelings OR your bills! This analysis is for educational and entertainment purposes ONLY. The "Thief Strategy" is MY trading style - it's risky, it's aggressive, and it's definitely NOT for everyone!
Do your own research. Manage your own risk. Trade what you can afford to lose. And for the love of all that's holy, don't mortgage your house based on some random internet chart analysis! 🏠❌
✨ If you find value in my analysis, a 👍 and 🚀 boost is much appreciated — it helps me share more setups with the community!
🏷️ #MSTR #MicroStrategy #ShortSetup #BearishBreakdown #SwingTrade #DayTrade #ThiefStrategy #BitcoinStocks #TechnicalAnalysis #MovingAverageCrossover #LayeringStrategy #RiskManagement #StockMarket #TradingIdeas #BTC #CryptoStocks #BearTrap #SupportAndResistance #ChartAnalysis #TradeSmart
🎯 Trade smart, layer in, manage risk, and may the profits be ever in your favor! 💰🚀
$MSTR Pullback Into Monthly Demand🟠 NASDAQ:MSTR Pullback Into Monthly Demand
✓ Price has rotated cleanly back into a major demand zone
✓ Structure still supports higher time-frame strength
✓ Buyers have stepped in here before with conviction
A strong area to watch as momentum rebuilds.
We have already started adding via out tier system.
Saylor’s Master Plan at Risk? MSCI Drops the HammerMSCI May Exclude Crypto-Heavy Companies: What It Means for MicroStrategy and the Market
MSCI recently published a proposal that could dramatically reshape how global indices treat companies with large crypto exposure.
According to the framework, companies holding more than 50% of their market capitalization in digital assets may be excluded from national and international indices.
This sounds technical - but the consequences are huge.
What This Means in Practice
If the rule is implemented, companies like MicroStrategy, Bitfarms, Marathon, Hut8, Coinbase, or any firm holding a large percentage of crypto on their balance sheet, may:
be excluded from major indices,
lose exposure to institutional investors,
be off-limits for pension funds, insurers and conservative hedge funds,
face reduced liquidity and forced selling.
This is not a small development.
This is a structural shift.
🧩 Why MicroStrategy Is the Most Exposed
MicroStrategy’s business model has been extremely straightforward:
issue new shares
raise debt (including convertible notes)
use the proceeds to buy Bitcoin
rising BTC → rising MSTR
rising MSTR → more borrowing capacity
A perpetual loop.
But if MSTR gets excluded from key indices, the loop breaks:
passive funds must sell
institutional investors face compliance risk
liquidity dries up
volatility increases
borrowing costs rise
And remember:
MicroStrategy currently trades below the fair value of its Bitcoin holdings.
A forced outflow amplifies the structural imbalance.
⚠️ Why Institutions Bought MicroStrategy Instead of Bitcoin
Many funds legally cannot buy Bitcoin.
They also cannot buy high-risk crypto exchange stocks like Coinbase.
But they can buy:
reputable corporate debt
convertible notes
equity from a listed U.S. corporation
Michael Saylor gave them a regulatory loophole:
“Want Bitcoin exposure? Buy my convertible debt.
If BTC rises, convert the notes into shares.”
This workaround is now cracking.
Convertible Debt Holders Are in a Tough Spot
If MSTR is excluded from indices:
index funds sell → share price drops
falling price → convertible notes lose value
institutions holding the debt face losses
the balance sheet risk increases
This is why regulatory decisions matter so much.
Insider Selling: VP of Bitcoin at MicroStrategy Sells ~$19.7M Worth of Stock
The timing is… interesting.
Started selling on September 18
Sold options-based shares in multiple lots
Continued selling until November 14
Total realized profit: ~$19.69M
Selling into regulatory uncertainty is not random behavior.
It’s a signal.
Key Takeaways
1. MSCI’s proposal changes the rules:
companies with >50% crypto exposure may become “non-indexable”.
2. MicroStrategy’s core model—borrowing to buy BTC—depends on institutional inflows.
Index exclusion disrupts it.
3. Convertible note investors may face severe pressure.
4. Insider selling suggests internal awareness of structural risk.
5. If MSTR is removed from indices, forced selling could create significant downside pressure.
📉 Conclusion
MicroStrategy has long been a “Bitcoin ETF before ETFs existed”.
Institutions bought MSTR because they couldn’t buy BTC directly.
But now:
Bitcoin ETFs exist,
regulations are tightening,
index providers are updating risk frameworks.
MicroStrategy may become a victim of its own success strategy.
Best regards EXCAVO

MSTR – Approaching Major Support as Downtrend ContinuesMicroStrategy remains in a clear higher-timeframe downtrend, and if Bitcoin continues to weaken, NASDAQ:MSTR could slide further toward the next major support level — now sitting roughly 63% below its all-time high. This zone may act as a potential reversal area, especially if market sentiment stabilizes.
Trade Setup:
• Entry Zone: $170 – $180
• Take Profit Targets:
🥇 $280
🥈 $360
• Stop Loss: $122

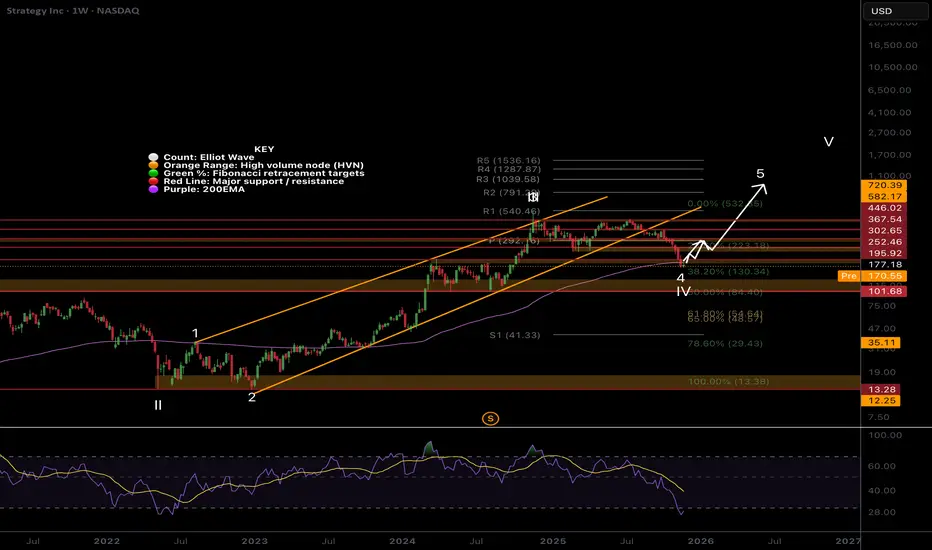
Strategy: Downward Pressure Intensifies Strategy has continued to develop downward pressure as anticipated since our last update, bringing it closer to the targeted low of the turquoise wave 2. Our alternative—and now grayed-out—Target Zone has been breached to the downside, allowing us to remove the alternative scenario of a premature breakout to the upside. Investors who speculated on this alternative and entered within the alternative Target Zone with a stop 1% below the lower edge have likely been stopped out by now. For now, we are still allowing some room for turquoise wave 2 to move lower; however, it should find its bottom above the support at $102.40 to set the stage for wave 3 to advance further above the resistance at $674.18.

$MSTR bounce above $300 before falling further?Ever since Early October, MSTR has been falling. We've now reached the bottom of a flag structure and I'd expect a bounce here before we fall further.
I think the most likely path from here is that we see a rally into the $300 zone, however, it's possible that we can go up to the top of the flag before falling further.
That said, if we get a rally, it'll be a rally you want to sell because eventually I think we're heading down to the $100 level before you want to become a long term buyer.
I've marked off key resistances on the path up to take profits on a long, should the rally play out from here.

Microstrategy is who Satoshi warned us about. MSTR has broken below the 50 day moving average and is now at 52 weeks low. All while they hold the most bitcoin they ever have, now at 641,000 BTC. Some would even say they are trying to corner the market, using debt - while they claim they will never sell, but also they are not even earning any yield on their holdings. They will owe over $600 million in dividend payments next year. You simply can not create value out of thin air. NASDAQ:MSTR
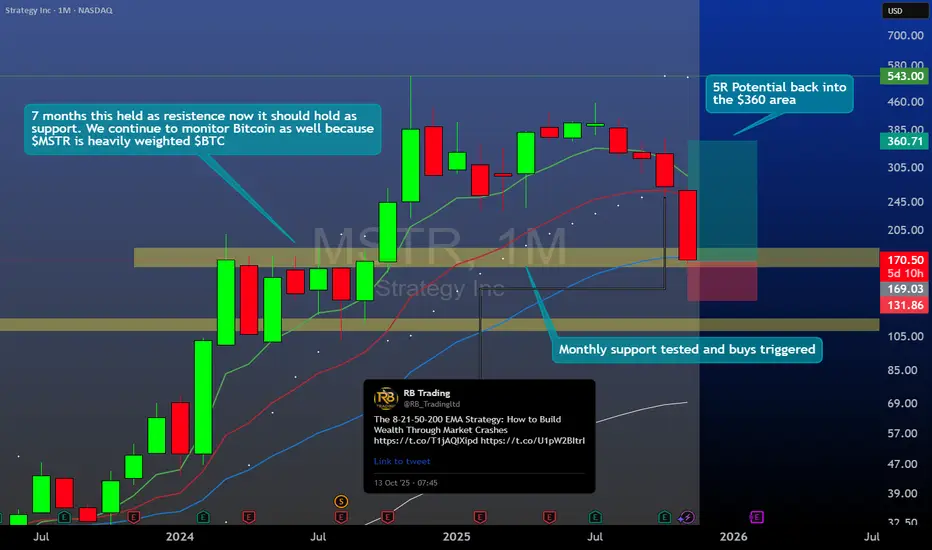
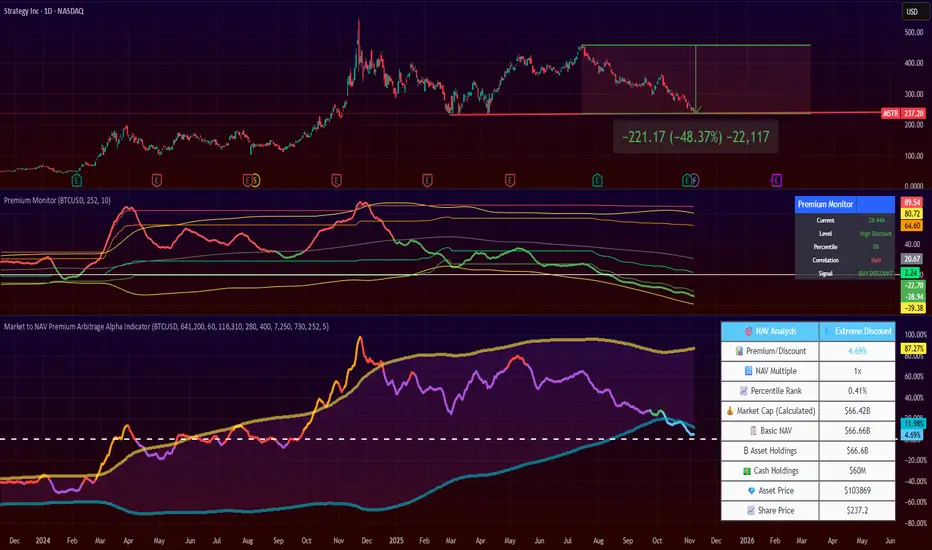
Strategy's Premium is Gone. Time to Load? 4 months ago, I posted that NASDAQ:MSTR premium was unsustainable and the stock price would drop.
Since then, the price dropped by 50%!!
Now, Strategy's is close to zero, and I flip my views on it.
If you like this kind of trade, it might be a good time to start DCA'ing it.
Note that Strategy continues to be a highly volatile stock, more volatile than Bitcoin itself.
Finally, the stock is now at a technical resistance level.
You can keep an eye on the premium/discount of this stock by looking at my 2 indicators:
Market to NAV Premium Arbitrage Alpha Indicator , and
Asset Premium/Discount Monitor
Will Microstrategy $MSTR follow the 2021 cycle?
Top was around the most greedy time in the market per Election '24. As bitcoin put in new all time highs MSTR continued lower highs, just like in '21. Last line of support around $230, it should continue putting in lower highs as the cycle comes to an end.
$MSTR still bullish at supportstrategy has lately been underperforming compared with simular assets. It's stuck in this arc and the diagonal line. When it finds support and breaks the arc you will teleport to the next arc. This gets invalidated when breaking to the downside!

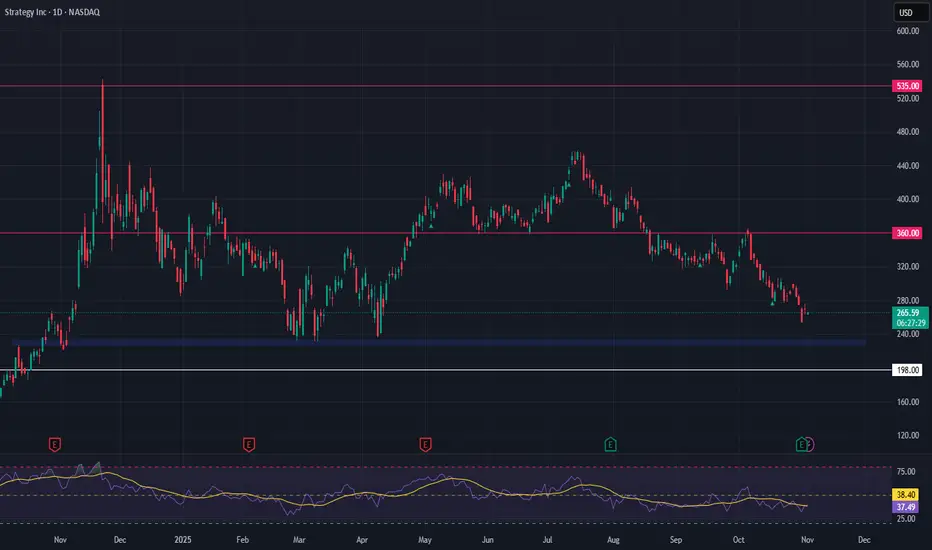
Strategy Inc (MSTR) – High-Beta Bitcoin Proxy at Key SupportStrategy Inc NASDAQ:MSTR has delivered another strong quarterly report, underscoring its continued commitment to aggressive Bitcoin accumulation. With over 158,000 BTC on the books, MSTR has firmly positioned itself as a leveraged proxy for Bitcoin, offering equity traders indirect crypto exposure. This bold balance sheet strategy has also pushed MSTR into alignment with S&P 500 inclusion criteria — a potential catalyst if index inclusion materializes.
Technically, the stock is now retesting a key support zone between $228 and $233. This level has historically held well and may offer a high-conviction entry for those anticipating a BTC rebound. Should Bitcoin aim for new highs, MSTR could respond with outsized upside, though traders must account for the volatility and downside risks that come with crypto-correlated equities.
🎯 Trade Setup:
Entry Zone: $228 – $233
Take Profit Targets: $360 and $535
Stop Loss: $198
This setup offers a high-risk, high-reward opportunity. As always, manage position size carefully and watch BTC price action for confirmation.
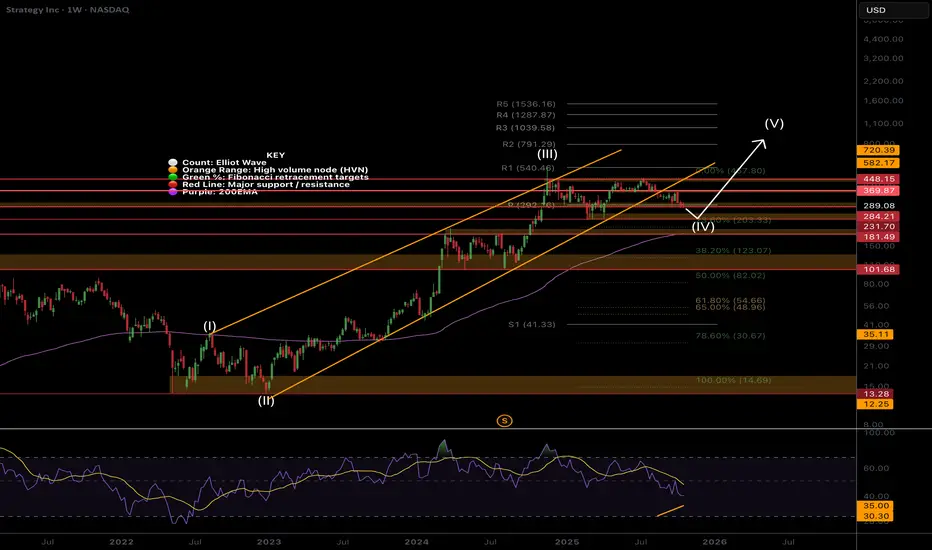
MSTR still in wave 4 rangeNASDAQ:MSTR Price is still in a wave (IV) which are expected to be long and drawn out, yet shallow which is what we have here. I don’t expect wave (V) to kick in until Bitcoin moves. Wave (V) has an expected of the R3 daily pivot at $1039 but will overextend if Bitcoin does.
Price has fallen out of the lower channel boundary and sitting at the weekly pivot, still above the weekly 200EMA so the outlook us bullish. wave (4) may complete at the 0.236 Fibonacci retracement at $203. For now I am waiting to see what happens before entering but believe good opportunities are setting up.
Safe trading