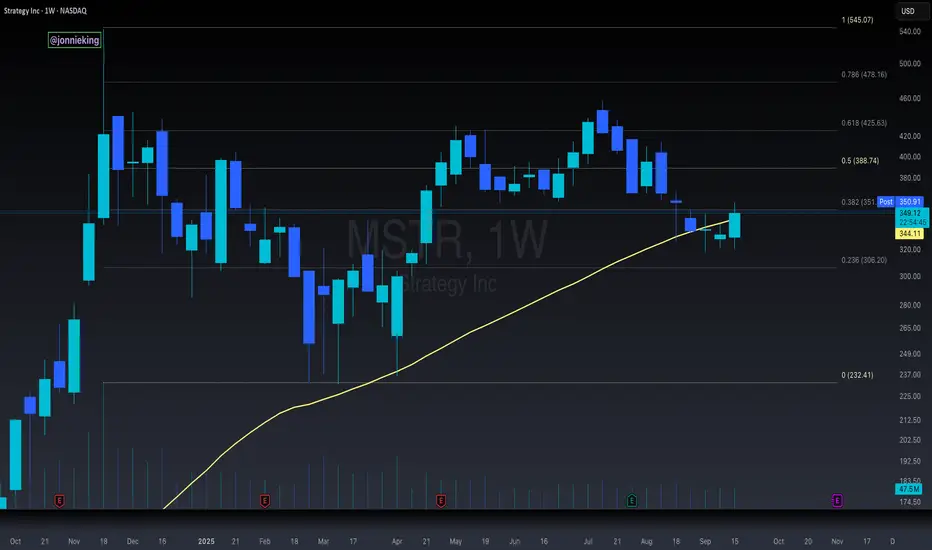
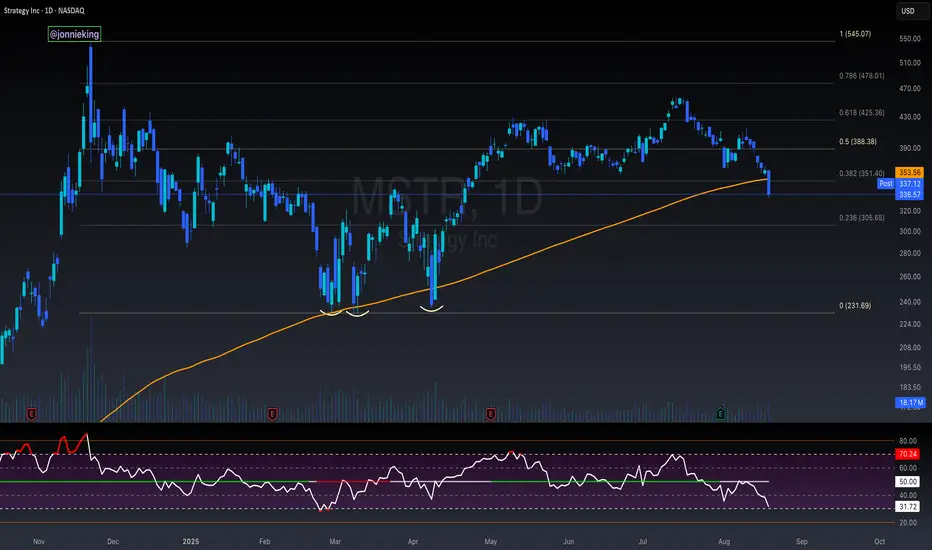
$MSTR 6th Consecutive Week BELOW 50WMAStill kinda shocked at how terrible the NASDAQ:MSTR chart is.
Working on its 6th consecutive week below the 50WMA.
What a complete disaster @saylor
If PA doesn't start showing some real strength here off the .236 Fib then down to ~$235 she blow 🌬️
Microstrategy

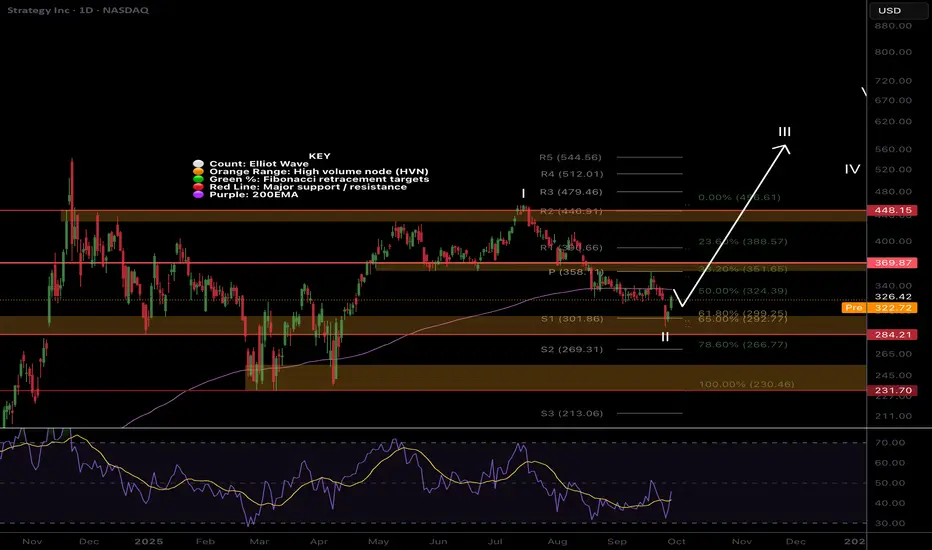
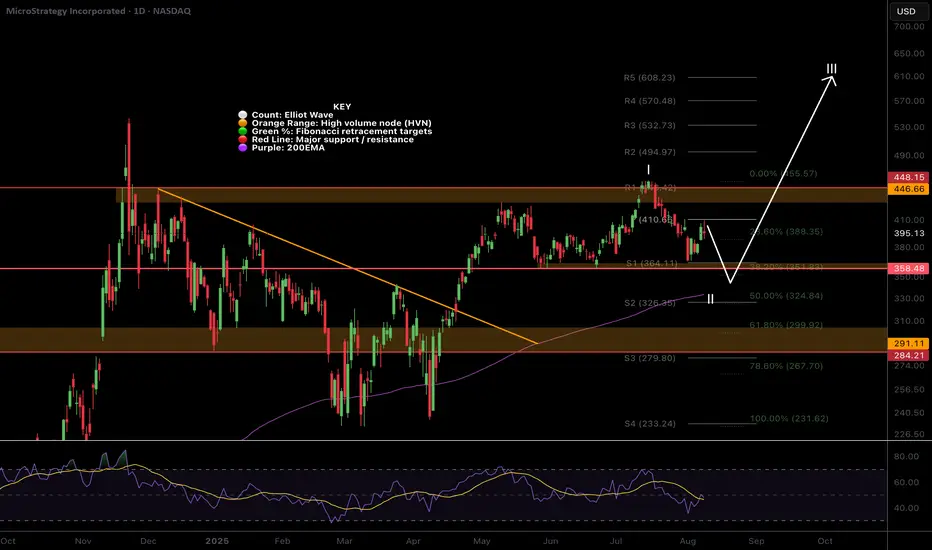
MSTR Wave II bottom?NASDAQ:MSTR is finally catching a bid from the triple support zone of the Fibonacci golden pocket, S1 pivot and High Volume Node.
It must overcome the daily 200EMA to add confidence to a reversal and wave II bottom being in.
Daily RSI has printed bullish divergence from oversold. Vanguard disclosed massive MSTR holdings ad the sentiment is awful online adding confluence to a bottom soon.
Wave III target is the R5 daily pivot $544, losing the support zone has a downside target of $232
Safe trading
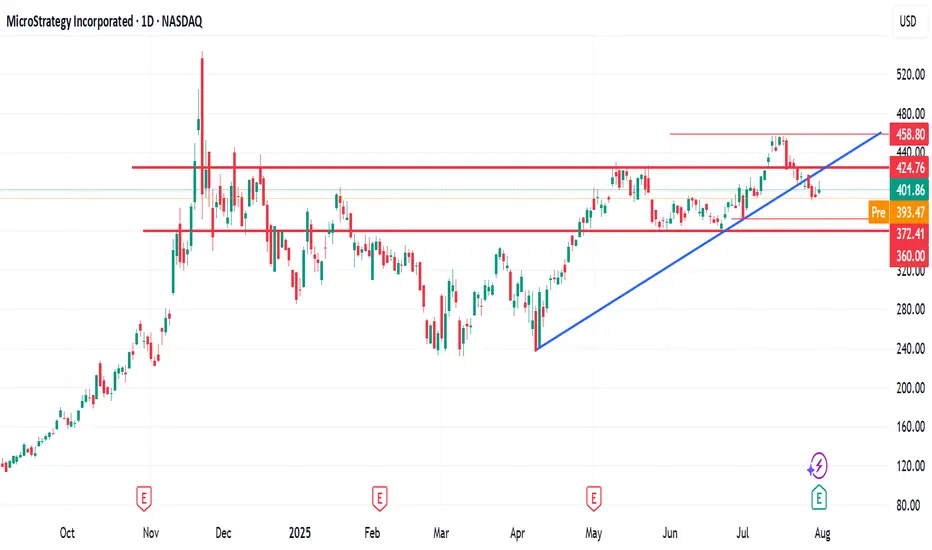
$MSTR to push above $400 again?NASDAQ:MSTR had it's 3rd touch off this blue trend line and usually when it does that, it forms a strong move in the other direction.
As long as this trend line holds, I think it's likely that we can see a move back above $400.
I've marked off key levels as resistance.
Took calls between $367.5 and $410.

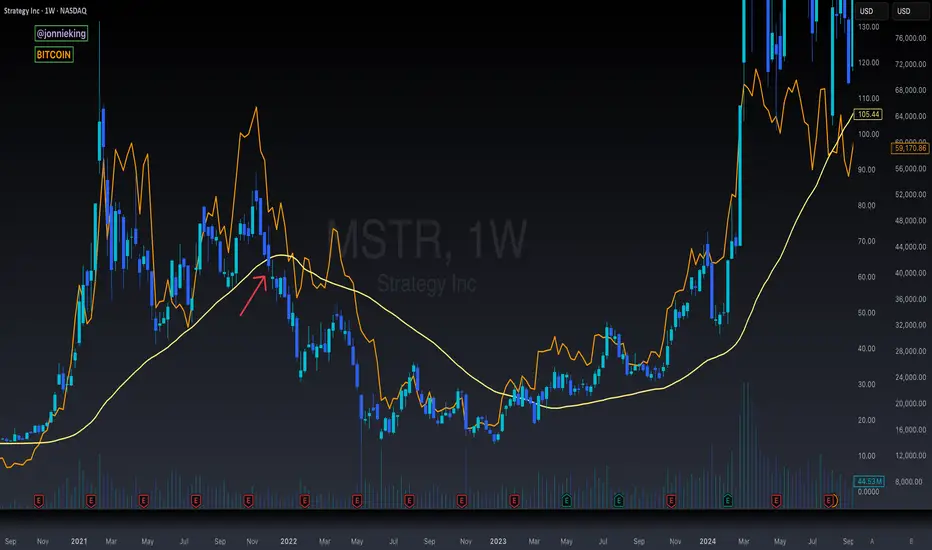
$MSTR Falling Below the 50WMA in 2021 Bull Market Here's a look at last cycle where NASDAQ:MSTR trading under the 50WMA for several weeks led to the CRYPTOCAP:BTC bear market.
The reason why this was so significant last cycle is because they were responsible for such a large share of BTC buy pressure.
This cycle we have lots of other treasury companies, with many more to come, as well as ETFs of course, so I'm not as concerned with this PA.
$MSTR Must Close This Week Above the 50WMA Or Else...The MicroStrategy chart is the only top signal that is somewhat cause for concern at the current moment.
You can see NASDAQ:MSTR has closed the past several weeks below the 50WMA, which signaled the start of the bear market last cycle.
Having said that, it has had a bullish rally this week and is trading above the 50WMA once again.
MSTR must close the week above this level, otherwise the stock could be in for a much deeper correction, which could negatively affect CRYPTOCAP:BTC in October.
Where have you heard that October prediction before?
Coincidence? 🥸
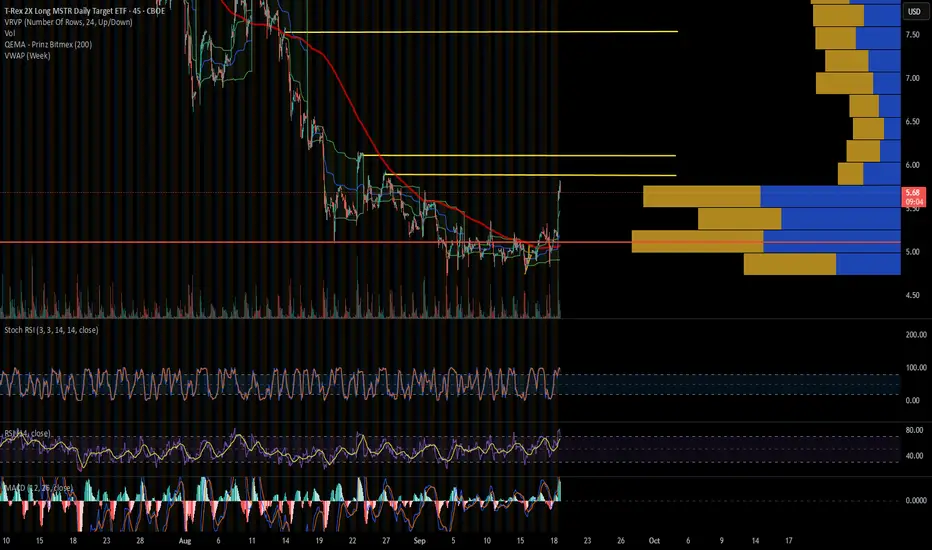
MSTU, Microstrategy 2x leverage etfThis ETF is a great way to get degenerately long on Bitcoin. If Microstrategy doesn't wet your beak, this one might. We have some gaps in the chart that I didn't see before. They are not visible on the higher time frames. I have been long on call options for a few days and was considering taking profit but because they are long dated leaps I am holding tight for now. Not financial advice, DYOR.
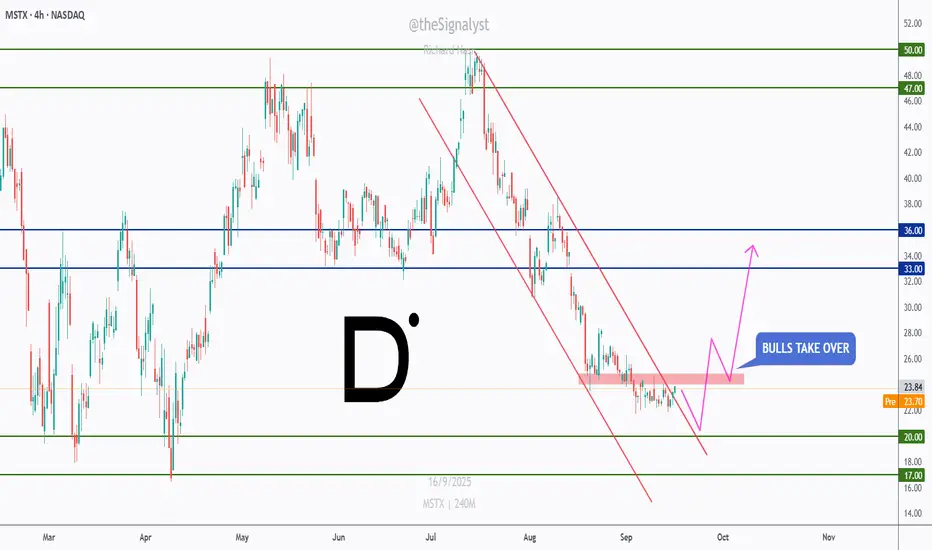
MSTX – Bulls Preparing a Reversal Move!MSTX has been overall bearish 📉, trading inside a well-defined descending channel.
Recently, price approached the $23 – $24 support area, where buyers started showing signs of activity. This zone could act as a potential turning point if momentum continues.
🟢 Support at $23 – $24: A critical level where bulls may step in.
📈 Upside targets: If buyers take over, the first resistance sits around $33, followed by $36 and higher toward $47 – $50.
As long as $23 support holds, bulls 🐂 could drive a short-term reversal that turns into a bigger recovery move.
Patience ⏳ is key — waiting for confirmation before entering can provide a higher-probability setup.
⚠️ Disclaimer: This is not financial advice. Always do your own research and manage risk properly.
📚 Stick to your trading plan regarding entries, risk, and management.
Good luck!
All Strategies Are Good; If Managed Properly!
~Richard Nasr
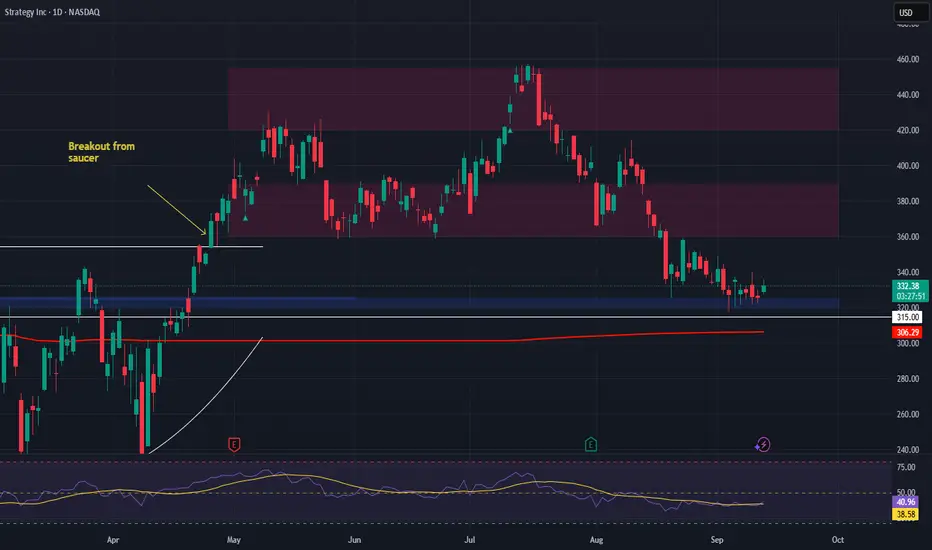
MSTR Long Setup at $320 Support — Targets Up to $455MicroStrategy NASDAQ:MSTR is trading at a critical support zone between $320 – $325. This area has historically attracted buyers, and with price consolidating at the lows, we’re eyeing a potential spot long entry if support holds.
📌 Trade Setup:
• Entry Zone: $320 – $325
• Take Profit Targets:
🥇 $360 – $390
🥈 $420 – $455
• Stop Loss: Just below $315
#MSTR #MicroStrategy #Stocks #TradingSetup #TechnicalAnalysis
#SupportZone #StockWatchlist #PriceAction
#SwingTrade #LongSetup #MarketAnalysis
Bitcoin Maxis - Brace for Impact !!!🚨 Bitcoin Maxis, brace for Impact 🚨
There is clear, recent evidence that Tether is actively diversifying its reserves and investments by both selling some of its Bitcoin holdings and significantly increasing its exposure to gold, including direct investments in gold mining:
1. Selling Bitcoin and Buying Gold
Tether has reported substantial profits from both Bitcoin and gold price appreciation. In 2024, the company booked. How does Tether generate its profits beyond Bitcoin and gold investments?" with \5 billion coming from unrealized appreciation of its gold and Bitcoin holdings. However, recent reports indicate Tether has been increasing its gold reserves while adjusting its Bitcoin treasury. For example, Tether disclosed holding $8.7 billion in gold bars in its Q2 2025 attestation report, and its gold-backed stablecoin (XAU₮) is backed by over 7.7 tons of physical gold as of April 2025.
2. Entering Gold Mining
Tether is in active discussions to invest in gold mining, aiming to channel its crypto profits into the metals market. CEO Paolo Ardoino has publicly referred to gold as “natural Bitcoin” and expressed a strong affinity for gold as a foundational asset. The company is exploring opportunities across the entire gold supply chain, including mining, refining, and trading.
Tether has already invested over $200 million in Elemental Altus Royalties, a Canadian firm that buys future revenue streams from gold mines, giving Tether exposure to multiple mines with less operational risk.
3. Strategic Shift
Tether’s move into gold and gold mining is part of a broader diversification strategy, which also includes investments in AI, Bitcoin mining, and other sectors. The company’s leadership has repeatedly emphasized gold’s role as a hedge and a complement to Bitcoin.
In summary, Tether is not only selling some Bitcoin and buying gold but is also directly entering the gold mining sector as part of its diversification and profit deployment strategy.
Sources:
www.zerohedge.com
www.coindesk.com
www.fxleaders.com
bitcoinethereumnews.com
BITSTAMP:BTCUSD NASDAQ:TSLA NASDAQ:NVDA NASDAQ:MSTR TVC:DXY TVC:GOLD TVC:SILVER VANTAGE:SP500 FX:EURUSD COINBASE:USDTUSD AMEX:NUGT AMEX:GDX

Trump’s Bond Strategy vs. Saylor’s High-Stakes Bitcoin BetBitcoin ( BITSTAMP:BTCUSD ) Macro Analysis: Trump’s Bond Strategy vs. Saylor’s High-Stakes Bitcoin Bet
1. Trump’s Bond Play and Crypto Ventures: A Dual Macro Hedge
Since returning to office in January 2025, Donald Trump has purchased over $100 million in corporate and municipal bonds, including debt from Meta, Citigroup, and local governments. These purchases are notable for two reasons:
Yield Lock: Trump’s bond buys were made at yields near 5%, a level not seen since the pre-2022 low-rate era. If the Federal Reserve cuts rates as expected in late 2025, the value of these bonds will rise, and their fixed 5% coupons will become increasingly attractive compared to new, lower-yielding issues.
Policy Alignment: Trump has publicly pressured the Fed to lower rates, which would further inflate the value of his bond portfolio. His administration’s fiscal and trade policies (e.g., tariffs, deregulation) could also indirectly support bond markets by stimulating demand for safe-haven assets.
Trump’s Crypto Ventures: Profiting from the Public
Unlike traditional crypto investors, the Trump family’s involvement in the sector is not built on holding Bitcoin or other digital assets. Instead, their companies focus on selling crypto-related products, cashing in on trading fees, and enriching themselves at the expense of an uninformed public. These ventures have been widely criticized as predatory, leveraging Trump’s political influence and public persona to attract unsuspecting investors into high-fee, low-value schemes—effectively an open scam that prioritizes short-term profits over genuine market participation.
Implications for Bitcoin:
If rates fall, bond yields become less competitive with risk assets like Bitcoin, potentially driving capital back into crypto.
However, Trump’s bond strategy and his family’s exploitative crypto ventures signal a preference for traditional financial instruments and extractive business models over supportive crypto policies. This could temper any positive impact on Bitcoin from his administration’s economic agenda.
2. Michael Saylor’s MicroStrategy: A Leveraged Bitcoin Bet
MicroStrategy, under Michael Saylor, has become the world’s largest corporate holder of Bitcoin, with over 446,000 BTC (worth ~$50 billion as of September 2025). The company’s strategy relies heavily on convertible debt issuance:
Debt Structure: MicroStrategy has issued billions in zero- or ultra-low-interest convertible notes (as low as 0.625%), using the proceeds to buy Bitcoin. This allows the company to avoid high interest payments and benefit from Bitcoin’s price appreciation.
Risks:
Leverage: If Bitcoin’s price falls sharply, MicroStrategy may face margin calls or be forced to sell BTC to meet debt obligations, exacerbating downward pressure on $BTCUSD.
Equity Dilution: The company’s aggressive stock issuance (planned dilution from 330M to 10B shares) could depress shareholder value if Bitcoin underperforms.
Recent Performance:
MicroStrategy’s stock NASDAQ:MSTR has outperformed Bitcoin in 2024–2025, but its valuation is now highly correlated with BTC’s price and market sentiment toward leverage.
3. Federal Reserve Policy: The Wild Card
Current Rates: The Fed has held rates at 4.25–4.50% since late 2024, but markets anticipate cuts in late 2025 (potentially 0.50–0.75% by year-end).
Impact on Bitcoin:
Rate Cuts: Historically, lower rates boost risk assets. Bitcoin could benefit from increased liquidity and weaker dollar, as seen in late 2024 when BTC rallied following Fed easing.
Inflation & Macro Risks: If cuts are delayed or inflation resurges, Bitcoin may face headwinds as investors favor bonds or cash.
4. The Crypto Winter Thesis: Is Doomsday Coming?
Bull Case: If the Fed cuts aggressively and liquidity floods markets, Bitcoin could resume its upward trajectory, especially if institutional demand (e.g., ETF inflows) remains strong.
Bear Case:
MicroStrategy’s Leverage: A sharp BTC drop could force NASDAQ:MSTR to liquidate holdings, triggering a cascade effect.
Regulatory Risks: Trump’s bond focus, his family’s extractive crypto ventures, and potential regulatory crackdowns could dampen sentiment.
Macro Uncertainty: Geopolitical tensions, recession fears, or a stronger-than-expected dollar could further pressure risk assets.
Technical Outlook:
BITSTAMP:BTCUSD is currently trading at $109,430 (as of September 4, 2025), up 1.63% over the past week but still range-bound between $107K–$112K.
Support/Resistance: Watch $105K (psychological support) and $115K (next resistance). A breakout or breakdown here could signal the next major move.
Conclusion: A Tale of Two Strategies
Trump’s bond purchases and push for rate cuts could indirectly benefit Bitcoin by reducing the appeal of fixed income, but his administration’s stance on crypto, and his family’s history of exploiting the public through crypto ventures, remains a significant red flag. Meanwhile, MicroStrategy’s leveraged Bitcoin bet is a high-risk, high-reward play that could either propel BITSTAMP:BTCUSD to new highs or accelerate a downturn if forced liquidations occur.
Traders should monitor:
Fed meetings (next: September 16–17, 2025) for rate cut signals.
MicroStrategy’s debt maturity schedule and Bitcoin holdings.
Trump’s policy shifts on crypto regulation and fiscal stimulus, as well as any new developments in his family’s crypto-related businesses.
Final Thought: The stage is set for a volatile Q4 2025. While the macro backdrop favors risk assets if the Fed eases, the specter of leverage unwinding, regulatory risks, and the Trump family’s extractive crypto practices looms large. Caution and active risk management are advised.
NASDAQ:MSTR NASDAQ:COIN TVC:GOLD TVC:SILVER NASDAQ:MARA BITSTAMP:ETHUSD CRYPTOCAP:USDC NASDAQ:TSLA NASDAQ:NVDA

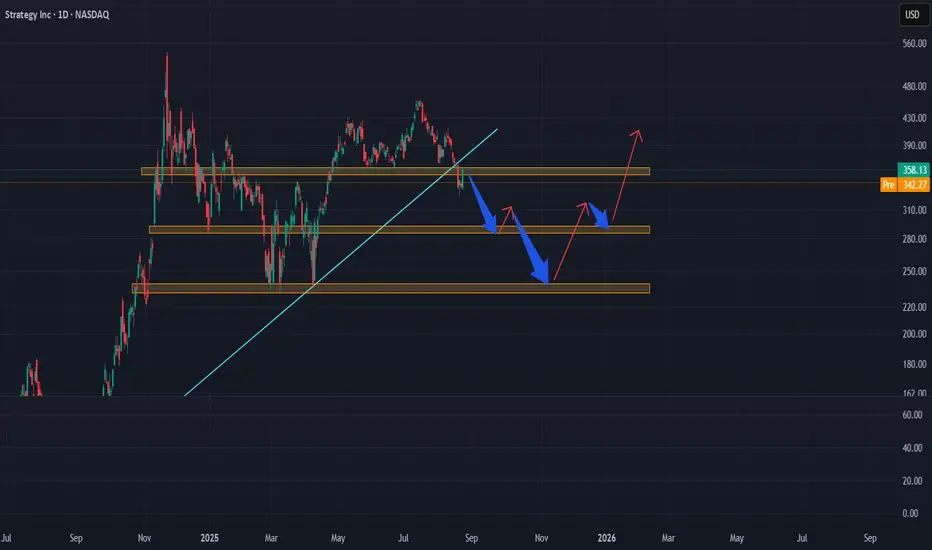
Microstrategy: Further DeclineAfter a brief consolidation, MSTR continued its decline since our last update, further developing turquoise wave 2, where we still see price positioned. We continue to anticipate the low of this wave above the support at $153.49. In the meantime, we have revised the magenta substructure of wave 2 to a - - formation, with the final (wave- ) leg currently unfolding. Once turquoise wave 2 completes, we expect a strong rally above resistance at $674.18, which should significantly advance the broader upward impulse. However, under our new alternative scenario, a different wave count could prevail: price may currently be forming magenta wave alt. to the upside, developing a blue three-part substructure in the process. In this 25% likely scenario, the next move would be for blue wave alt. (b) to finish within the nearby blue alternative Target Zone between $306.60 and $252.67, before wave alt. (c) pushes up toward the top of magenta wave alt. near $674.18. Within this alternative, the blue zone could offer long entry opportunities, though heightened caution is warranted: since this remains only an alternative scenario, risk is elevated, and we consider strict risk management—such as setting a stop 1% below the lower edge of the zone—absolutely essential.

MSTR Bottoming Soon?NASDAQ:MSTR continues to range while weekly RSI heads into oversold without a significant pullback, a good sign for a bullish long term outlook.
My downside target for this move remains the High Volume Node, weekly pivot and golden ratio Fibonacci retracement at $290.
The R3 weekly pivot is a solid terminal target at $1039 but could overextend in an irrational environment.
Analysis is invalidated below wave (IV)
Safe trading

BNC - The Trio Intersection Ahead!The chart is lining up something interesting: a trio intersection of cycle timing, trendline support, and horizontal demand. This is often where momentum shifts from hesitation to acceleration.
📊 Technical Analysis
- NASDAQ:BNC is consolidating above the $20 zone , with $15 still the key line in the sand for bulls.
- Cycles are showing another low forming right into support — a repeating pattern we’ve been tracking closely.
- The trio intersection (cycle + support + trendline) suggests a potential inflection point. If buyers step in here, the projected cycle points to a move toward $50 first , then possibly triple digits in the next leg.
💡 Bigger Picture
What makes this setup powerful isn’t just the chart — it’s the backdrop.
- CEA Industries has already deployed over $240M into BNB, with an ambitious target to own 1% of BNB’s total supply by end of 2025.
- Backed by 10X Capital, YZi Labs, and even CZ’s family office, the company is accumulating BNB ahead of expected ETF and institutional demand.
- Think of it as MicroStrategy 2.0 — but with a coin that’s outpaced Bitcoin over the last five years, and underpins one of the busiest ecosystems in crypto.
📊In brief:
Technicals and fundamentals are aligning at a key junction. If this trio intersection holds, BNC could be gearing up for its next major bullish cycle.
📌 Previous BNC analysis is attached for context.
➡️ Talk to your financial advisor and start your due diligence on CEA Industries (NASDAQ: BNC) before the institutions move in.
📚 Always follow your trading plan => including entry, risk management, and trade execution.
Good luck!
All Strategies Are Good, If Managed Properly.
~ Richard Nasr

Bearish MSTR is temporary; Rise to more than 412$ in the future.As it's obvious, MSTR has broken it's bullish trendline and a great pullback has happened. I believe after breaking a support at 293$, It will head toward 239$ then will rise and break the bearish trendline. After surpassing the 293$ resistance, It will catch 412$. Also it's evident that buying crypto by Michael Saylor can improve the stock price.
$MSTR Testing Historical Key Support at 200DMAMicroStrategy had its largest daily close below the 200DMA in the past 893 days.
Historically this support level has market key bottoms.
RSI allows for a bit more pain to the downside, but NASDAQ:MSTR should find a bottom soon.
If not, $305 is in play.
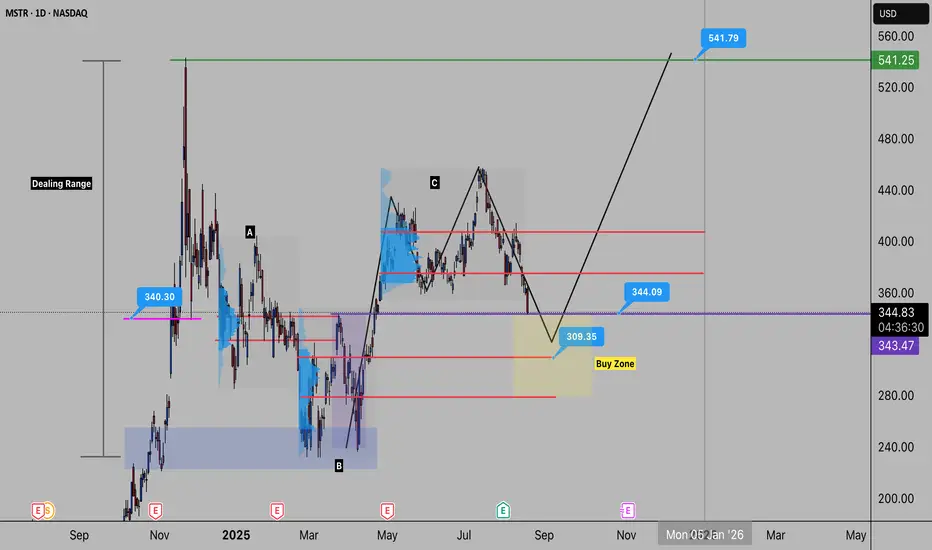
Buy the F out of MSTR? - Bullish IdeaI’m watching MicroStrategy (MSTR) closely here — the chart is setting up for what looks like a strong bullish opportunity.
(the content below is documenting the chart from left to right)
🔎 Key Observations
Demand Zone: Back in August 2024, price reacted strongly from the $225 zone, rallying ~100%. Clear evidence of institutional demand.
Current Structure: Price has been ranging between $225 – $550. The midpoint zone (~$325–$375) is where the most important reactions are likely to form.
Volume Zones:
Zone A → Already tested.
Zone B → Untested, showing potential bullish reaction.
Zone C → Looks bearish on the surface, but could be a manipulation zone (push down to fill institutional orders).
Liquidity Sweep: The purple zone shows price ran weekly highs, reversed, then closed back above — a classic liquidity grab, suggesting institutions may defend this area.
🧩 Market Structure & Pattern
Structure shows a bullish impulse with a crab pattern forming.
Completion expected around 50–61.8% retracement, possibly as deep as 78.6%.
Buy zone of interest: $325.
🎯 Trade Plan
Entry Zone: $325 area.
Targets:
First resistance: $375–$400 (must clear here).
Final target: $550.
Bias: Bullish, holding for continuation higher as long as $225 remains protected.
✅ To summarize: I’m bullish on MicroStrategy here. Watching for a buy reaction around $325 with a target of $550. Price will need to prove itself through the $375–$400 zone before continuation.
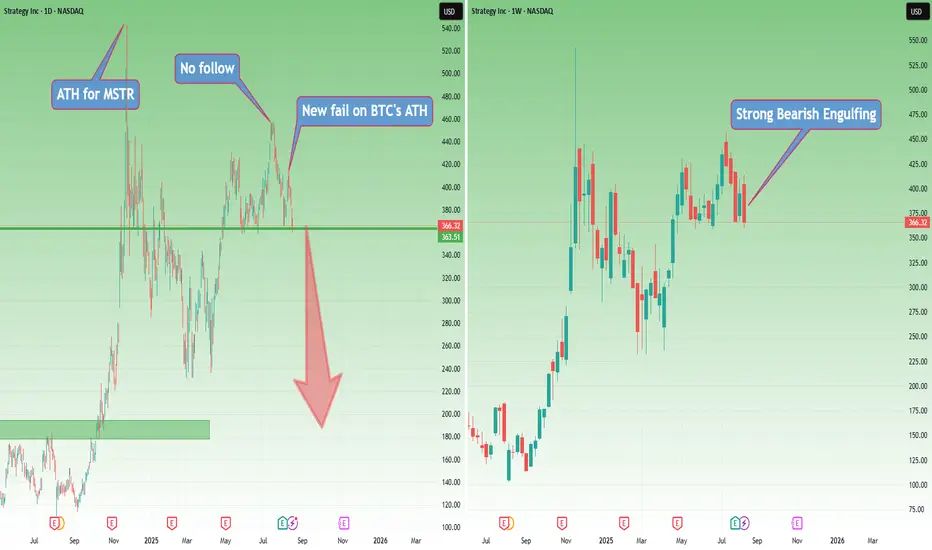
MSTR: A Giant with Feet of ClayExactly two weeks ago, I wrote an article with a rhetorical question: “Why should you buy Strategy if you want exposure to BTC?” and argued that MSTR could fall—and fall hard.
Two days ago, BTC printed a new ATH. That move was visible in MSTR as well; however, we’ve got a lower high and a new fail for the stock.
Even more, this fail has formed the right shoulder of an H&S pattern.
On the weekly chart, there’s a strong bearish engulfing that ended exactly at the neckline of the pattern.
This type of price action is far from bullish, regardless of what one may want to dream of.
BTC is above confluence support. If it breaks this level, Strategy will fall even harder.
In my last post, out of 12 comments, 5 were hate comments—because “how can I say such enormities, that Strategy could fall.”
The answer is simple: the chart doesn’t look good at all.
Even if BTC reverses from this support, in my opinion the reflection in MSTR will be minimal.
And anyway, I trade what I see, not what Saylor sells me.
That being said, a drop of BTC under confluence support will most probably lead to a break below the neckline for Strategy. And if BTC delivers a meaningful correction, Strategy will fall like a giant with feet of clay that it is.
BNC — The Wall Street Backdoor to BNBMost U.S. investors can’t buy BNB (the world’s #3 cryptocurrency) directly in their brokerage accounts. Yet it powers one of the most-used blockchains in the world => it is deflationary, pays yield, and has outperformed Bitcoin over the last five years.
But there’s now a backdoor … and it trades on the NASDAQ.
📌 Meet CEA Industries ( NASDAQ:BNC )
BNC is the first publicly traded U.S. company to make BNB its core treasury asset; much like MicroStrategy did with Bitcoin, but with arguably even greater upside potential.
The company has already deployed over $500 million into BNB, backed by institutional names like 10X Capital and YZi Labs , positioning itself ahead of expected demand from ETFs, exchanges, and even sovereign funds.
For everyday investors, this could be the easiest way to get one-click exposure to BNB; before Wall Street catches on.
📊 Technical Analysis
After deploying over $500M into BNB 💰, BNC has skyrocketed by more than 880% 🚀.
Missed the initial rally? No problem. BNC had entered a markdown phase 📉, retracing to fill the previous gap — a classic textbook pattern 📚. Historically, once such gaps are filled, the stage is often set for the next big bullish impulse 📈.
That key moment has now arrived ✅ — price has broken above the $23 accumulation zone 🔓, confirming a decisive momentum shift from bearish (markdown) ➡️ bullish (markup).
With the markup phase underway, our targets are:
- Short-term: $50 — key resistance level & psychological milestone 🧠
- Medium-term: $82.30 — filling a major gap from earlier price action 📊
💡 Why This Matters
- BNB has outperformed Bitcoin over the last 5 years (25x vs 9x).
- Deflationary supply + staking yield potential.
- Global adoption despite regulatory headwinds.
- First-mover advantage => no other U.S. public company is building its treasury around BNB.
Bottom line?
This could be MicroStrategy 2.0 - but with a token that may have an even stronger growth story ahead.
➡️ Talk to your financial advisor and start your due diligence on CEA Industries (NASDAQ: BNC) before the institutions move in.
📚 Always follow your trading plan => including entry, risk management, and trade execution.
Good luck!
All Strategies Are Good, If Managed Properly.
~ Richard Nasr

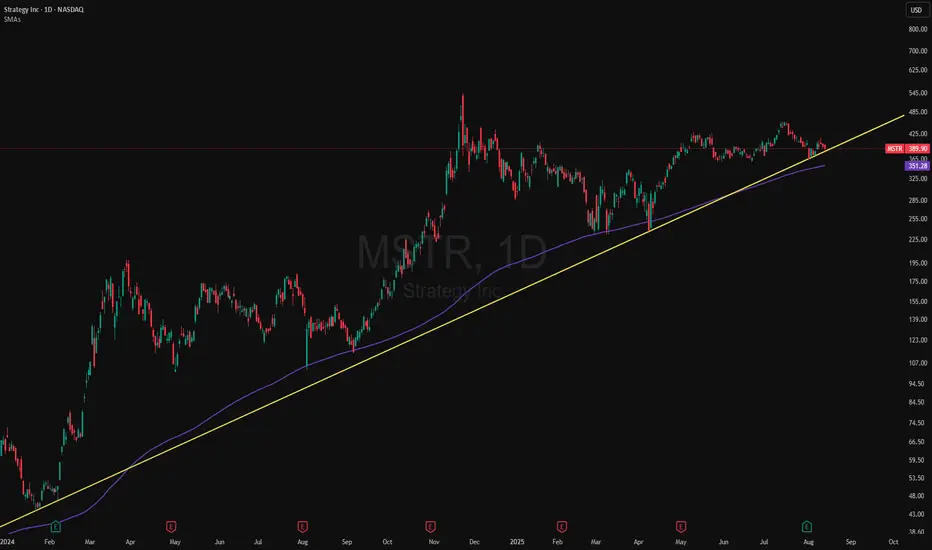
MSTR Holding the Line: Support Tested AgainMSTR (MicroStrategy) continues to respect its ascending trendline, a bullish sign showing buyers remain in control.
Technical Points:
Price tapped the trendline support for the fourth time and bounced, confirming its strength.
Volume remains stable during pullbacks, suggesting these dips are being absorbed by buyers rather than panic selling.
As long as MSTR holds above $1,400 (trendline + previous support zone), the bullish structure remains intact.
Next targets: $1,600, then $1,750, with potential for new highs if Bitcoin strength continues.
Bottom line:
Repeated successful tests of the trendline show strong market confidence. Unless this trendline breaks with conviction, the path of least resistance is still up.
Buy MSTR - many indicators lead me to buy.Many, many indicators lead to a buy on mstr. Avwap, divergences, stochastic... strong buy for me. Stop loss at about 350$. Take profit could be set to 455$ (or adjust it while it's running). Of course it depends on the performance of btc, but I'm also bullish for btc (at least n short term).

$MSTR shallow wave 2 underway before explosive move ?MicroStrategy has been caught in a range since Nov 2024 possibly building momentum for a large breakout into price discovery, continuing its huge rally from 2024.
Price appears to ave completed an Elliot wave 1 with wave 2 now underway with a target of the ascending daily 200EMA $340, the 0.382 Fibonacci retracement.
Weekly RSI is currently showing bullish divergence but daily suggests we have one push lower to get to oversold!
Bitcoin stocks have all had a decent retracement causing me to upgrade my Elliot Wave count to a completed macro wave 1 with wave 2 now underway, suggesting the best returns are still to come over the next months for this category asset class in wave 3!
Analysis is invalidated if we go to new highs above $457 or lose $229
New long signals are certainly building in the DEMA PBR and Price Action strategies so keep an eye out on the Trade Signals Substack as we have made very food profits lately in these markets!
Safe trading
$372 - $360 is imminent$372 - $360 is imminent.
Following a break below the highlighted key support TL, MSTR fall to as low as $370 to $360
Strategy Hit SupportMSTR should easily hold $246 and make its way back up to $418 and form it's next support there.
Good luck!
