USD/AUD Outlook: RBA Hawkishness Meets Dollar DebasementThe USD/AUD currency pair is undergoing a significant structural repricing. A convergence of persistent Australian inflation and a politically engineered devaluation of the U.S. Dollar has created a powerful bearish trend for the pair (favoring a stronger Australian Dollar).
Macroeconomics: The Inflation Divergence
The primary economic driver is the divergence in monetary policy lifecycles. Australia’s consumer inflation accelerated to 3.6% in the fourth quarter of 2025, exceeding the RBA’s 2–3% target. Monthly data for December printed at 3.8%, forcing the Reserve Bank of Australia (RBA) to maintain a restrictive "higher for longer" stance.
Conversely, the U.S. macro outlook is dominated by fiscal concerns. With U.S. debt approaching $39 trillion, markets are pricing in a higher risk premium for holding U.S. assets. This fundamental mismatch, an RBA forced to fight sticky inflation versus a U.S. regime tolerating currency weakness, creates a distinct downward pressure on USD/AUD.
Industry Trends: Housing as an Inflation Engine
A sector-specific analysis reveals that housing costs are the engine room of Australian inflation, rising 5.5% in December. This reflects deep supply chain constraints and elevated construction costs.
Unlike transitory price shocks, housing inflation is sticky. It spreads across consumption sectors, including "Recreation and Culture," indicating broad-based demand. This industry trend virtually eliminates the possibility of near-term RBA rate cuts, solidifying the Australian Dollar's yield advantage.
Management and Leadership: Policy Culture Clash
The fluctuation is also a result of conflicting leadership styles.
The RBA (Prudence): Deputy Governor Andrew Hauser and Governor Michele Bullock represent a culture of orthodox central banking. They have explicitly ruled out near-term easing, prioritizing mandate compliance over popular sentiment.
The White House (Disruption): President Trump’s management style involves "verbal intervention." His recent comments that the dollar is "doing great" while it plummeted removed the executive safety net. This signaled to traders that the administration implicitly supports a weaker currency to boost exports.
Geopolitics and Geostrategy: The Debasement Trade
Geostrategically, the U.S. Dollar is facing a crisis of confidence dubbed the "debasement trade." Investors are rotating capital out of the USD and into emerging markets and gold to hedge against fiscal unpredictability.
Trump’s tariff threats and unpredictability have alienated allied capital. The market views this not just as a tactical dip, but as a strategic withdrawal of foreign liquidity from U.S. Treasury markets. This geopolitical friction weakens the USD’s status as the ultimate safe haven, benefiting high-beta currencies like the AUD.
Technology and High-Tech: The Algorithmic Shift
In the domain of financial technology, derivatives markets are flashing warning signals. Data from the Depository Trust and Clearing Corporation shows turnover hitting near-record levels.
Algorithmic trading systems are aggressively pricing "risk reversals," with premiums on short-dated options favoring a weaker dollar. This high-tech market sentiment indicates that institutional machines are programmed to sell USD rallies, exacerbating the downward volatility.
Conclusion: A Structural Downtrend
The USD/AUD pair is caught between a rock and a hard place. Australia’s resilient economy (growing at 2.1%) and sticky inflation demand a strong currency to dampen prices. Simultaneously, the U.S. political apparatus is dismantling the "strong dollar" doctrine.
Unless the RBA pivots unexpectedly or the U.S. fiscal outlook stabilizes, the path of least resistance for USD/AUD remains lower.
Monetarypolicy

USD/BRL: The Real’s New Defense ManualThe Brazilian Real (BRL) is no longer a passive victim of the Dollar. Following the International Monetary Fund’s (IMF) endorsement of the “Integrated Policy Framework” (IPF), Brazil has transformed its monetary strategy. Investors trading the USD/BRL pair must recognize that the Central Bank of Brazil (BCB) is no longer just targeting inflation; it is deploying a scientifically engineered shield against global volatility.
Macroeconomics and Economics
The textbook economic theory of the “Impossible Trinity” is being rewritten in Brasilia. The BCB is successfully executing the IMF’s IPF model by combining high interest rates with targeted Foreign Exchange (FX) intervention. Unlike the blunt instruments of the past, the BCB now uses FX swaps to provide liquidity without burning through hard currency reserves. This “surgical” approach dampens the inflationary impact of a strong USD while keeping the domestic economy functional. The result is a Real that bends but does not break, offering a high-yield “carry” that is structurally protected by the central bank’s friction-management tools.
Geopolitics and Geostrategy
In a world of weaponized currencies, Brazil has positioned itself as a “Geopolitical Bunker.” By utilizing the IPF, Brazil insulates its domestic economy from the “spillovers” of US Federal Reserve policy. When the Fed raises rates, exporting inflation to the world, Brazil’s proactive use of FX intervention absorbs the shock. This strategic autonomy allows Brazil to maintain trade relationships with both Western and Asian blocs without its currency becoming a proxy for trade war volatility.
Management and Leadership
The credibility of the BCB’s leadership is the Real’s strongest asset. Having hiked interest rates well before the Federal Reserve during the post-COVID cycle, Brazilian policymakers earned the market’s trust. This “credibility capital” allows them to intervene in currency markets without triggering panic. Investors view these interventions not as desperation, but as calculated maintenance of the transmission mechanism. The leadership has graduated from reactive crisis management to proactive market engineering.
Science and High-Tech
Monetary policy in Brazil has evolved into a data-driven science. The BCB utilizes advanced models to quantify market “frictions,” specifically, the difference between fundamental currency value and liquidity-driven panic. By mathematically identifying when the FX market is seizing up, they deploy swaps with precision. This is not art; it is the high-tech application of the IMF’s latest economic science, turning the BRL into a managed asset rather than a volatile gamble.
Conclusion
The USD/BRL trade is no longer just about commodity prices or political noise. It is a test case for the future of emerging market economies. Brazil’s adoption of the Integrated Policy Framework offers a blueprint for resilience. For traders, this means the “BRL Crash” trade is riskier than ever, as the central bank now possesses the tools, the science, and the credibility to punish speculators who bet against the new playbook.

USD/JPY would be consolidating until BoJ meeting this Friday・USD/JPY market fundamental
The Japanese Yen has weakened following reports of Prime Minister Takaichi's snap election. Market is anticipating that her administration will implement expansionary fiscal policies.
Japanese Financial Minister Katayama has been warning against the rapid movement of the Yen several times last week.
Market is now focusing on BoJ meeting scheduled for Friday. If the BoJ signals a faster pace of rate hikes, the current support level could be broken and potentially reversing the trend.
・Technical Analysis
USD/JPY market is expected to consolidate within the range of 157.000 to 160.000 ahead of the Friday's BoJ meeting.

Can Gold's Transformation Justify a $7,000 Price Target?The global gold market is experiencing a fundamental paradigm shift as the metal transitions from a passive portfolio hedge to a strategic necessity across multiple domains. With U.S. national debt exceeding $38 trillion and a debt-to-GDP ratio above 124%, the report argues that sovereign debt debasement has become mathematically inevitable, forcing central banks into implicit yield curve control and perpetual currency dilution. Simultaneously, geopolitical fractures exemplified by the January 2026 capture of Venezuelan President Maduro and escalating Arctic tensions over Greenland are driving nations to diversify away from their reliance on weaponized dollar reserves. The BRICS alliance's launch of a 40% gold-backed "Unit" currency in October 2025, combined with record central bank purchases of 220 tonnes in Q3 2025 alone, signals a coordinated global effort to remonetize gold as the ultimate neutral reserve asset.
Beyond monetary dynamics, gold is becoming indispensable to the technological infrastructure of the future. The AI revolution creates inelastic industrial demand, with gold-tin solder and gold wire bonding proving essential for thermal management in high-performance chips, such as NVIDIA's B200 GPU and High-Bandwidth Memory (HBM3E) systems. This "AI tax" on gold supply permanently removes metal from circulation as it becomes embedded in data centers and semiconductor packages. Basel III regulatory reforms have further catalyzed demand by elevating allocated physical gold to Tier 1 asset status, incentivizing banks to swap paper assets for physical metal, and exposing the leverage in the paper gold market. Additionally, emerging applications in quantum computing, nanomedicine, and space infrastructure, including China's planned deployment of 200,000+ satellites for 6G networks, create entirely new sources of consumption.
The convergence of these structural forces creates what the report calls a "supply squeeze" amid declining ore grades, rising production costs, and potential export restrictions by major producers. With global debt approaching $346 trillion and cyber warfare risks underscoring gold's unique status as an "analog hedge" immune to digital manipulation, the report projects $7,000 per ounce not as speculation but as a rational repricing of a strategic asset facing unprecedented convergent demand. The thesis holds that gold has evolved from a "nice-to-have" portfolio diversifier into a "must-have" strategic material for central banks seeking neutrality, technology companies requiring conductivity, and investors needing protection against systemic collapse. The authors conclude that supply constraints can be resolved only through price adjustment, making the path to $7,000 "paved with necessity."

Silver and the 1980 Blow-Off Fractal – An Analytical NoteFrom a structural perspective, the long-term silver chart exhibits similarities to the 1970s–1980 cycle when evaluated through fractal behavior and Fibonacci extensions. Rather than serving as a price analogue, the historical comparison functions as a framework for understanding market phases: accumulation, acceleration, and terminal expansion.
The 1980 silver peak occurred within a macroeconomic environment defined by persistent inflation, negative real interest rates, fiscal expansion, and a delayed but ultimately aggressive monetary policy response. In contrast, the current cycle operates in a structurally different yet directionally comparable regime. Elevated sovereign debt levels, long-term fiscal deficits, and a policy bias toward financial stability have constrained the ability of central banks to maintain restrictive real rates for extended periods.
This monetary backdrop supports a regime of higher volatility in real assets, even as policy transmission remains uneven. Following a prolonged consolidation, silver has transitioned into an impulsive advance with rising momentum and shallower pullbacks—features consistent with late-cycle behavior observed in the historical fractal.
Fibonacci extensions derived from the secular low and the 2011 high define zones of structural relevance rather than directional targets. The former peak near the 1.0 extension represents a key equilibrium area, while higher extensions—particularly the 4.236 level—align with regions of increased instability and volatility in the 1980 analogue. In that cycle, price acceptance above such levels was brief and followed by rapid mean reversion.
Overall, the projection should be interpreted as a conditional analytical framework. It integrates price structure with macro and monetary context to highlight zones of rising instability, not deterministic outcomes, as silver potentially transitions from trend continuation toward terminal dynamics.

Gold and the 1980 Blow-Off Fractal – An Analytical NoteThe current gold projection is derived from the 1970–1980 blow-off top, a period defined by monetary stress rather than a conventional bull cycle. That environment produced exponential price behavior driven by negative real rates, geopolitical instability, and declining confidence in fiat currencies.
From a fractal perspective, the key characteristic of the 1980 move was time compression. After a long accumulation phase, gold entered a parabolic expansion in which price advanced faster with each impulse. In the final stage, technical structures were increasingly ignored and Fibonacci extensions were exceeded rather than respected.
Applied to today’s market, Fibonacci levels should be read as regime thresholds, not price targets. The 4.236 extension marks the transition from structured trend to reflexive expansion, while higher extensions (6.236–7.0 and beyond) historically align with late-stage acceleration and sharply rising volatility. Extreme extensions represent stress boundaries, not stable equilibrium levels.
The analytical takeaway is not a specific price outcome, but a shift in market behavior. If the 1980 fractal is valid, the terminal phase is likely to be rapid, unstable, and sentiment-driven—signaling systemic stress rather than a normal trend continuation.

SR3 (SOFR 3 Month) Finds Balance After a Multi-Year DowntrendBackground: What is SR3 and what drives it?
SR3 refers to the three month SOFR futures contract. SOFR, or the Secured Overnight Financing Rate, represents the cost of overnight borrowing collateralized by US Treasuries. The three month SOFR future prices in the market’s expectation of average SOFR over a future three month period, making it one of the cleanest instruments for expressing interest rate expectations tied to Federal Reserve policy.
This instrument is primarily used by institutions to hedge short term interest rate exposure and to speculate on the future path of monetary policy. Because of this, SR3 is highly sensitive to macro data, Federal Reserve communication, inflation prints, labor market data, and shifts in risk sentiment. When markets expect easing, SR3 prices tend to rise. When expectations move toward higher for longer policy, prices tend to fall.
Since 2022, the dominant narrative has been centered around aggressive tightening followed by a prolonged restrictive stance. That narrative has kept SR3 in a broader downtrend. More recently, sentiment has shifted toward patience and data dependence rather than urgency in either direction. This has resulted in compression, balance, and range trade as participants wait for clarity on the next policy inflection.
What the Market Has Done
• The market has been in a downtrend since 2022 but has found a base with strong responsive selling at 96.575 and responsive buying at 96.325. This has formed a defined daily range that has contained price since June.
• From August to October, the market traded in a two way rotation with higher highs and higher lows. Buyers stepped up bids and were able to push price marginally higher, but each test of the 96.58 area was met with responsive selling that capped continuation.
• Toward the end of October, buyers failed to defend the higher lows. Price rotated back down into bid block one in the 96.42 to 96.37 area, where buyers successfully held price through mid November, establishing what is now bid block two.
• Sellers gained slight control as they were able to offer prices back down toward the lower end of the range near 96.325.
• The market performed a liquidity check below this level, but responsive buyers quickly stepped in and bid price back up through the daily range.
• Price is currently repairing the October 29 single print and is now trading between the established offer block and bid block two.
What to Expect in the Coming Week
The key level to watch remains 96.52, which sits near the upper portion of the current balance area and acts as a decision point.
Bullish scenario
• If the market is able to accept above the 96.52 area, continuation toward 96.575 becomes likely.
• A further extension toward 96.6125, which marks the October 17 high, is possible.
• Responsive selling is expected in this region.
• Failure to sustain trade above these levels would likely result in rotation back down into the range.
Neutral scenario
• In the absence of a meaningful news catalyst, a two way auction remains the highest probability outcome.
• Price could continue rotating between the offer block and bid block one.
• This rotation would serve to further repair the October 29 single print and the associated low volume area.
Bearish scenario
• If 96.435, which marks the high of bid block two, fails to hold, expect a sweep through bid block two.
• This would open the door for a revisit of the lower range boundary near 96.32.
• Responsive buyers are expected to defend this area based on prior behavior.
Conclusion
SR3 appears to have found a base and shifted from a structural downtrend into a period of sideways accumulation. Price has settled into a well defined range as market participants balance expectations around monetary policy and incoming data. Recent Federal Reserve commentary supports this shift in sentiment. The Fed has delivered multiple rate cuts this year and appears cautious about future moves, signaling a more data dependent approach and a potential pause after the most recent easing cycle, which aligns with range trade rather than directional conviction. Markets are pricing in additional easing but Fed officials have shown clear disagreement on the timing and pace of future cuts, which has dampened strong trend conviction and encouraged balancing action in rate sensitive instruments like SR3. Some officials have publicly indicated that further rate cuts could be warranted if economic conditions soften, while others have urged caution, emphasizing the need for clearer labor market and inflation signals before making additional adjustments. This split messaging has contributed to a neutral market structure where price oscillates within value rather than trending strongly higher or lower.
Interested in how others are mapping Fed communication and data dependency onto this range, and what catalysts you see as capable of breaking this structure. Please drop a comment and give a boost so that more from the community can join in the conversation. Thank you.
Disclaimer: This is not financial advice. Analysis is for educational purposes only; trade your own plan and manage risk.

GBP/JPY: An Unusual Ascent Amid Global RiskThe GBP/JPY pair currently sits near 204.00, retracing from a six-week high. This movement reflects a complex tug-of-war between the Pound Sterling (GBP) , which faces uncertainty from upcoming UK inflation data, and an uncharacteristically weak Japanese Yen (JPY) . We analyze the diverse forces driving this pair's recent unusual ascent, where the JPY fails to act as its traditional safe-haven counterweight.
Macroeconomics & Monetary Policy Divergence
The immediate market focus centers on divergent monetary policy expectations. The Bank of Japan (BoJ) faces pressure to align its policies with fiscal objectives, potentially limiting future rate hikes. This uncertainty, coupled with the new government's plan for large economic stimulus and lower taxes, dampens JPY demand. Conversely, the Bank of England (BoE) awaits crucial UK Consumer Price Index (CPI) data, which is expected to show headline inflation moderating to *b]3.6% annually. This data will significantly influence the BoE's rate hike outlook, injecting caution into GBP trading ahead of the 07:00 GMT release.
Geopolitics & Geostrategy: The Taiwan Factor
A key reason for the JPY's recent underperformance is a shift in geopolitical sentiment toward Japan. New Prime Minister Sanae Takaichi adopted a firmer pro-Taiwan stance than her predecessors, triggering unease in Beijing. This heightened political tension weighs heavily on sentiment surrounding Japan, effectively diluting the Yen's traditional safe-haven magnetism against global risk. This specific anxiety overshadows the Yen's long-term status as the principal global currency counterweight.
Fiscal Policy & Economic Outlook
Concerns about Japan's fiscal health are also eroding the JPY's strength. The government is preparing a large economic stimulus package to boost growth. This spending raises concerns among investors worried about Japan's already stretched finances . These fiscal anxieties add direct pressure to the currency, making the JPY less attractive despite the current risk-off environment observed in global equity markets. This fiscal trajectory contrasts with the Bank of Japan's potential monetary hesitancy.
Industry Trends & Corporate Vulnerabilities
Corporate Japan's deep integration with the US technology sector presents another vulnerability. Many major Japanese companies maintain significant earnings exposure to the health and performance of the US tech boom. Corporate vulnerabilities tied to the US technology cycle are eroding the JPY’s traditional safe-haven appeal. Consequently, negative headlines or wobbles on Wall Street disproportionately mute the Yen's response, preventing it from rallying when global equities come under pressure.
Management, Innovation, and Patent Analysis -
While not an immediate driver, Japan's long-term currency strength relies on its competitive edge in high-tech and science . The current vulnerability suggests that the market is discounting the perceived innovation premium of corporate Japan. Traders see a connection between the dependency on US tech and a potentially lagging pace in domestic, cutting-edge patent analysis and independent industry leadership. Weak corporate sentiment reflects doubts about resilience and adaptive business models under new management.
Conclusion for Strategic Hedging
The Yen's uncharacteristic weakness creates a unique setup. The currency is behaving out of character relative to the worsening risk backdrop. This anomaly presents tactical opportunities for hedgers with exposure to the Yen. However, this phase is likely temporary. Japan’s enormous net international investment position and its central role in funding global carry trades mean the Yen's safe-haven DNA remains intact. If global markets experience a sharper, sustained downturn, expect the traditional gravitational pull into the JPY to reassert itself.

Why the US Dollar Dominates the Loonie?The USD/CAD pair trades near 1.4100, reflecting the US Dollar's (USD) persistent strength against the Canadian Dollar (CAD). This rally to seven-month highs stems from powerful structural and cyclical forces. We observe a widening monetary policy divergence and geopolitical uncertainty that favors the USD. Analyzing macroeconomics, fiscal policy, and trade reveals why the CAD struggles to sustain gains, despite positive Canadian data.
Geopolitics and Geostrategy: North American Trade Friction
Trade uncertainty directly pressures the CAD. Recent trade tensions with the US create significant CAD headwinds. Prime Minister Mark Carney apologized for an anti-tariff advertisement, but President Trump reportedly rejected resuming trade talks. This situation keeps bilateral trade risk elevated, undermining business confidence in Canada. US court proceedings over broad tariffs further inject political risk into the U.S.-Canada relationship, threatening key sectors like the auto industry.
The USD functions as the global reserve safe-haven anchor. Global investors gravitate toward USD assets during times of geopolitical friction. This geostrategic function offers the USD a structural advantage over the commodity-linked CAD, reinforcing the pair's upward momentum.
Macroeconomics: Diverging Rate Paths
The primary driver remains the widening interest rate differential. Strong US data bolsters the Federal Reserve's (Fed) hawkish stance. US ADP Employment climbed by 42,000 in October, reversing the prior decline. ISM Services PMI also rose to 52.4, exceeding forecasts. This resilience strengthens the USD.
The Fed maintains a cautious approach toward future rate cuts. CME FedWatch Tool data shows traders reduced the probability of a December Fed cut to 62% from 68%. Conversely, the Bank of Canada (BoC) has already cut its policy rate to 2.25%. Although the BoC signaled an easing cycle pause, markets focus on expected future divergence. This policy gap favors dollar-denominated assets, pushing the USD/CAD higher.
Economics and Fiscal Policy Headwinds
Canada's fiscal policy adds downward pressure on the CAD. The new Canadian budget projects the fiscal deficit will more than double this year. Deficit projections reach -2.5% of GDP for 2025/26 and -2.0% for 2026/27, representing material fiscal loosening. Markets interpret this spending as potentially inflationary without sufficient growth, weakening the CAD.
Furthermore, the CAD remains highly sensitive to crude oil prices. West Texas Intermediate (WTI) crude trades near $\$60.00$ per barrel, declining slightly. As a major oil exporter, softer energy prices negatively impact Canada's terms of trade and export revenue, directly pressuring the Loonie.
Technology and Patent Analysis: The Competitiveness Gap
Structural economic factors underpin the CAD weakness. Canada faces an ongoing competitiveness gap with the US, particularly in high-tech and innovation sectors. Persistent lower productivity growth in Canada compared to the US makes the Canadian economy less appealing for long-term capital investment.
The US economy demonstrates superior labor productivity growth and strong performance in advanced industries. This technology and innovation lag limits the CAD's potential for sustained appreciation. The US also benefits from acting as a "black hole" attraction for Canadian talent and intellectual property. This fundamental economic divergence provides structural support for the Greenback's long-term dominance.

Is the Pound's Decline Irreversible Before BoE?The recent surge in the EUR/GBP cross above the $\mathbf{0.8750}$ threshold is fundamentally rooted in a significant monetary policy divergence between the UK and the Eurozone. The key driver is the heightened uncertainty surrounding the Bank of England's ( BoE ) Thursday rate decision. Following softer UK inflation and wage data, analysts have begun pricing in a material probability of an impending rate cut, generating substantial dovish speculation. This expectation inherently depreciates the British Pound ( GBP ), creating a powerful interest rate differential against the Euro. Conversely, the European Central Bank ( ECB ) maintains a firm policy pause, with President Christine Lagarde expressing confidence in the Eurozone's outlook, reinforcing the Euro's stability and momentum.
While macroeconomic policy dictates the current upward trajectory of EUR/GBP, subtle but material geopolitical headwinds threaten the Euro's stability. Political turmoil in France, specifically the government's struggle following the rejection of a key finance measure, raises the specter of snap elections and governmental paralysis. Such internal political risk within the Eurozone's second-largest economy undermines investor confidence and poses a downside risk to the Euro's valuation, counteracting the macroeconomic tailwinds. Furthermore, long-term structural health of both currencies is tied to competitive advantages in high-tech sectors, FinTech, and life sciences, where patent analysis * and robust cyber infrastructure are crucial for attracting foreign direct investment.
The immediate market outlook hinges almost entirely on the forthcoming BoE announcement and the subsequent commentary from Governor Andrew Bailey. An unexpectedly dovish stance would confirm market expectations, severely weaken the GBP, and likely cement a sustained move by EUR/GBP toward the $0.8800$ mark. This movement predominantly reflects a GBP weakness narrative rather than overwhelming EUR strength. Traders must recognize that while the current momentum favors the Euro, any escalation of the French political crisis into a threat to wider EU fiscal cohesion could rapidly reverse the pair's upward trend. Close monitoring of this dual risk profile is paramount.

Can the Euro Break Free From the Dollar's Grip?The EUR/USD currency pair is extending a modest winning streak, nearing 1.1670 as the US Dollar (USD) underperforms ahead of the Federal Reserve's monetary policy announcement. This marks the fifth consecutive day of gains for the pair, largely fueled by a cooling USD sentiment due to the prolonged US government shutdown and a cautiously dovish outlook from the Fed. Despite this short-term momentum, a sustained rally remains elusive. The pair is currently searching for a stronger catalyst, with the upcoming monetary policy meetings from both the Federal Reserve (Fed) and the European Central Bank (ECB) expected to provide the necessary spark for clearer directional movement. Immediate resistance levels are flagged around 1.1728 and 1.1778, while initial support rests at the October low of 1.1542.
The underlying technical picture suggests that while the broader positive trend holds above the crucial 200-day Simple Moving Average (SMA), momentum is weak. Key indicators, such as the Relative Strength Index (RSI) sitting just over 47 and the Average Directional Index (ADX) around 15, imply that the current upward move lacks conviction and leaves the door open for potential renewed losses. Investors are keenly focused on a potential shift in the narrative. A dovish surprise from the Fed, a reduction in the appetite for US assets, or a more encouraging stance from the ECB could provide the requisite lift for the Euro. Furthermore, any genuine progress in easing US-China trade tensions would also likely weigh on the USD and benefit the currency pair.
The fundamental backdrop is characterized by the Washington stalemate and a cautious approach from both major central banks. The nearly month-long US government shutdown continues to erode business confidence and negatively impact growth expectations, contributing to the USD's drift lower. Meanwhile, the Fed is largely anticipated to deliver a 25-basis-point rate cut at its upcoming meeting, maintaining a flexible, "meeting by meeting" policy approach as it balances softer job data against lingering inflation. Across the Atlantic, the ECB is opting to stay patient, with President Christine Lagarde expressing confidence that policy is "in a good place" and future adjustments will be entirely data-dependent, a signal that the European easing cycle may be largely concluded, at least for now.

Powell Signals the End of QT — Relief Rally or the Calm Before?First, let’s look at the key points from Powell’s remarks at the 67th Annual Meeting of the National Association for Business Economics (NABE):
* The future path of monetary policy will depend on the assessment of data and risks.
* The balance sheet remains a vital tool of monetary policy.
* Fed officials will discuss the composition of the balance sheet.
* Balance sheet reduction (QT) could come to an end in the coming months.
* Inflation remains on an upward trajectory.
* The labor market shows signs of notable downside risks.
From this set of statements, my conclusion is that if the Fed and Powell start speaking more decisively about ending QT and halting balance sheet reduction, it would be highly significant.
It would indicate that the Fed is becoming increasingly concerned about the future of the labor market — and likely signals more aggressive and deeper rate cuts ahead.
Halting the balance sheet reduction while simultaneously cutting rates could provide some support to the U.S. economy and ease pressure on equities and financial markets.
However, if QT is paused but unemployment continues to rise, we should expect a sharp downturn in financial and equity markets.
Overall, given Powell’s dovish tone, my trading bias remains bearish, unless a strong technical reversal emerges.
That said, the U.S.–China trade tensions currently carry even greater importance in shaping market direction.

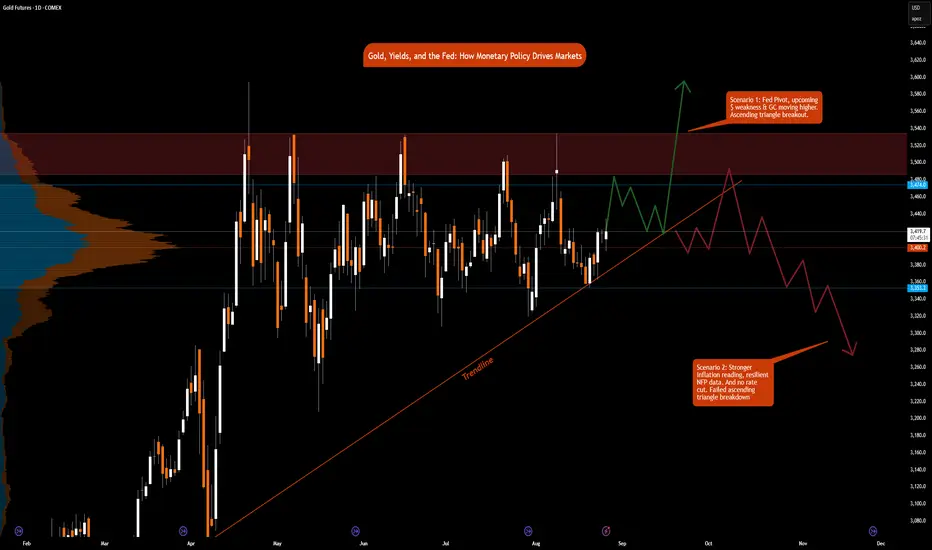
Gold, Yields, and the Fed: How Monetary Policy Drives Markets
Few forces shape global markets more than U.S. monetary policy. The Federal Reserve’s dual mandate, maximum employment and 2% inflation is the anchor for its decisions. For traders, understanding how these objectives translate into interest rate changes is critical for positioning in gold futures and across the yield curve.
The Fed’s Dual Mandate
1. Maximum Employment: Support jobs and minimize unemployment.
2. Stable Prices (2% inflation target): Prevent runaway inflation or deflation.
The Fed balances these goals using interest rates:
• Raising rates: Cools demand, strengthens the dollar, lifts yield, weighs on gold.
• Cutting rates: Stimulates demand, weakens the dollar, lowers real yields, supports gold.
The tension lies in the trade-off: controlling inflation often hurts employment, while boosting employment risks higher inflation.
Gold and Monetary Policy
Gold is highly sensitive to real interest rates (nominal yields minus inflation):
• Hawkish Fed: Higher real yields, dollar strength, gold struggles.
• Dovish Fed: Lower real yields, weaker dollar, gold rallies.
However, given the recent surge in gold prices despite higher rates, traders must ask:
• Will gold continue rising as odds of rate cuts increase, and when they are eventually delivered?
• Is the traditional correlation between the dollar and gold futures prices breaking down?
Gold’s rally has also been driven by geopolitical tensions and rising long term yields, reflecting rising debt burdens across the globe.
Yield Curve and Monetary Policy
The yield curve reflects expectations about growth, inflation, and Fed policy.
• Short end (1M–5Y): Anchored by Fed policy rates. If markets expect hikes/cuts, the front end moves first.
• Long end (10Y–30Y): Driven by expectations for long-term inflation, growth, and Treasury supply/demand dynamics.
Typically, investors and market participants watch for the following patterns:
• Inverted curve: Short yields > long yields, often a recession signal. See last year’s yield curve.
• Steepening curve: Usually follows Fed cuts, as front-end yields drop faster than the back end.
Two Classic Scenarios
Scenario 1: Inflation Stays High, Jobs Weaken
• Fed resists cutting, prioritizing price stability.
• Gold: Consolidates or weakens (real yields elevated).
• Yield curve: While the short end stays pinned, long end could rise on higher inflation risk and increasing debt worries, signaling stagflation risk.
Scenario 2: Inflation Stabilizes, Jobs Weaken
• Fed pivots dovish, prioritizing employment.
• Gold: Breaks higher on falling real yields.
• Yield curve: Steepens as short yields fall faster than long yields.
The Policy Backdrop
Powell’s last symposium before his term ends, at the Jackson Hole appearance, Fed Chair Powell delivered a dovish pivot, highlighting rising risks to the labor market while downplaying the inflationary effects of tariffs. The reasoning behind this shift deserves its own deep dive, but for now, our focus remains squarely on how monetary policy, specifically interest rate decisions, impacts inflation, growth, supply, and demand in the U.S. economy.
What’s on the Docket Until the Next Fed Meeting (September 17, 2025)
Markets will be glued to data in the coming weeks:
• Aug PCE / Core PCE (Aug 28–29) → Fed’s preferred inflation gauge.
• Aug NFP (Sep 5) → Labor market health; weak print strengthens the case for cuts.
• Aug PPI (Sep 10) → Upstream price pressures; hot numbers signal inflation risks.
• Aug CPI & Core CPI (Sep 11) → Key headline data; softer print supports dovish case.
• Fed Decision (Sep 17) → Will Powell stress inflation vigilance, or shift toward labor concerns?
How the Charts Tie It Together
• Gold Futures:
o Ascending Triangle breakout above resistance towards $3,600, if Fed pivots dovish and deliver a rate cut or a bigger rate cut.
o Ascending Triangle breakdown toward $3,350 if inflation remains sticky and the Fed holds. In this scenario, gold remains in balance overall.
• Yield Curve:
o Short end reacts directly to Fed rate expectations.
o Long end reflects investor conviction on inflation, growth and increasing debt concerns.
Takeaway for Traders
The Fed’s dual mandate creates a constant push and pull between inflation control and employment support. Gold and the yield curve are two of the clearest real-time mirrors of that balancing act:
• Watch short-term yields and gold to gauge how markets are pricing the Fed’s next move.
• Watch the long end of the curve to see whether investors believe inflation is truly anchored.
By linking economic data → Fed mandate → asset price response, traders gain a roadmap that works not just for this Fed meeting, but for every one that follows.
In our next educational blog we will briefly explore other policy tools used by the Fed i.e., QE and QT. Quantitative Easing and Quantitative Tightening.
FRED:FEDFUNDS ECONOMICS:USINTR
CME_MINI:ES1! CME_MINI:MNQ1! CME_MINI:NQ1! COMEX:GC1! MCX:GOLD1!
CBOT:ZB1! CBOT:ZN1!
GBP/USD: Following the Bearish Trend to a Key LevelSharing my perspective on a potential short setup in GBP/USD.
This view is based on a combination of weakening UK fundamentals and a clear bearish technical structure.
📰 The Fundamental View
The main driver here is the growing difference in monetary policy. The Bank of England is signaling a more dovish stance due to recent soft economic data out of the UK. In contrast, the US economy is showing more resilience, which may keep the Federal Reserve on a less aggressive easing path. This fundamental divergence puts downward pressure on the Pound versus the Dollar.
📊 The Technical Picture
The chart supports this bearish bias. We can see a clear downtrend in place, defined by a series of lower highs and lower lows. Price is currently trading below its key moving averages, which often act as dynamic resistance. The critical level to watch is the 1.34377 price zone, which was a previous area of support and could now be tested as resistance.
🎯 The Strategy
The plan is to watch for bearish price action as we approach the 1.34377 key level. A rejection from this zone would provide a good opportunity to enter a short position, aiming to ride the next leg of the established downtrend.
As always, this is my own perspective. Manage your risk carefully and trade safe.

USD/JPY: A Bullish Thesis for Trend ContinuationThis analysis outlines a data-driven, bullish thesis for USD/JPY, identifying a strategic long entry within an established market trend. The setup is supported by a combination of fundamental catalysts and a clear technical structure.
📰 The Fundamental Picture
The primary driver for this trade will be the high-impact US economic data scheduled for release. This release is expected to inject significant volatility into the market. Fundamentally, this trade is a play on the deep policy differences between the US Federal Reserve and the Bank of Japan. While the Fed's future steps are a topic of debate, the Bank of Japan's policy remains one of the most accommodative in the world, creating a long-term headwind for the Japanese Yen. This dynamic provides a strong fundamental basis for relative US Dollar strength against the Yen.
📊 The Technical Structure
Chart analysis reveals that USD/JPY is in a confirmed and healthy uptrend. The current price action indicates a constructive pullback, presenting a strategic opportunity to join the dominant trend at a favorable price. The proposed entry point is positioned at a key technical level that offers a low-risk entry. Technical indicators support the continuation of the trend, suggesting that momentum remains with the bulls.
✅ The Trade Plan
This trade is structured with a clear and favorable risk-to-reward profile, aiming to capitalize on the established trend.
👉 Entry: 146.343
⛔️ Stop Loss: 145.233
🎯 Take Profit: 148.560
⚖️ Risk/Reward Ratio: 1:2

EUR/JPY: Bullish Thesis on Policy DivergenceOur primary thesis is built on a powerful confluence of compelling fundamental drivers and a clear technical structure. We are taking a long position in EUR/JPY with high conviction, anticipating significant upside fueled by a stark monetary policy divergence confirmed by a constructive chart formation.
📰 Fundamental Analysis: The core of this trade is the widening policy gap between the European Central Bank (ECB) and the Bank of Japan (BoJ). While the BoJ is only just beginning to exit its ultra-loose monetary policy, the global environment points toward continued JPY weakness. The upcoming high-impact US news will act as a major catalyst. A "risk-on" reaction to the data would significantly weaken the JPY, providing a strong tailwind for this trade.
📊 Technical Analysis: The chart structure for EUR/JPY is decidedly bullish. The pair has established a clear uptrend, and recent price action indicates a period of healthy consolidation above key support levels. This presents a strategic entry point, as the market appears to be gathering momentum for the next leg higher. The current setup suggests a low-risk entry into a well-defined upward trend.
🧠 The Trade Plan: Based on this synthesis, we are executing a precise trade with a favorable risk profile.
👉 Entry: 172.422
⛔️ Stop Loss: 171.292
🎯 Take Profit: 174.684
⚖️ Risk/Reward: 1:2

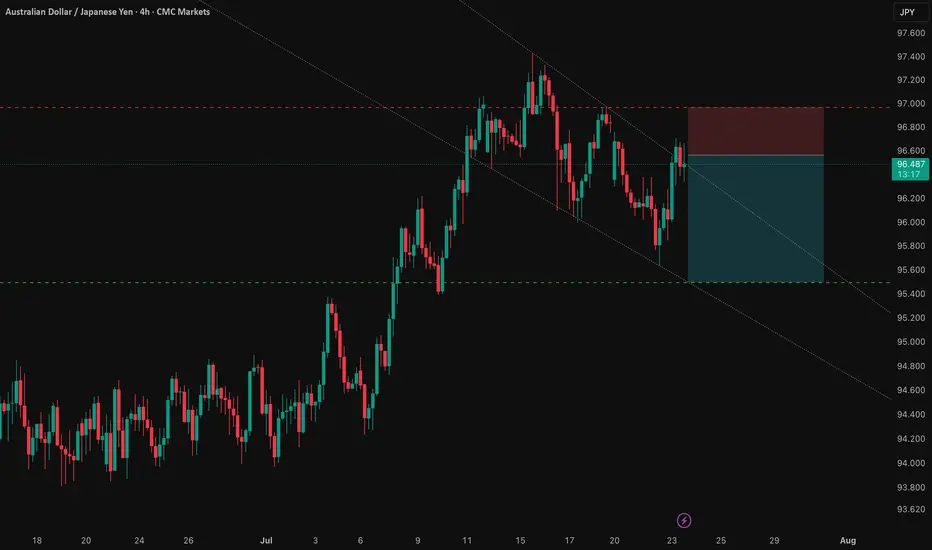
AUD/JPY: Capitalizing on the RBA-BoJ Monetary Policy GapThis analysis outlines a compelling short opportunity in AUD/JPY, driven by a powerful confluence of fundamental and technical factors. The trade is strategically positioned ahead of a key catalyst that could unlock significant downside potential.
1️⃣ The Core Thesis: A Clear Policy Divergence
The primary driver behind this trade is the stark and widening gap in monetary policy between the Reserve Bank of Australia (RBA) and the Bank of Japan (BoJ). The RBA is signaling a clear dovish pivot amid a weakening labor market, making an interest rate cut imminent. Conversely, the BoJ is in a tightening phase, creating a fundamental headwind for the AUD relative to the JPY. This divergence underpins the strategic bearish bias.
2️⃣ The Confirmation: Technical Alignment
This fundamental view is supported by a clear technical picture. The pair is in a well-defined downtrend and is currently testing a critical support level. This alignment of fundamental and technical factors presents a clear short opportunity, with the entry positioned for a breakdown below this key juncture.
3️⃣ The Catalyst: The RBA Bulletin
The immediate catalyst for this trade is the upcoming RBA Bulletin on July 24, 2025. Any dovish language from the RBA concerning Australia's economic outlook will likely reinforce expectations for a rate cut and accelerate the downward move in AUD/JPY.
The Trade Setup ✅
Here is the recommended trade setup:
📉 Trade: SHORT AUD/JPY
👉 Entry: 96.56200
⛔️ Stop Loss: 96.96386
🎯 Take Profit: 95.49900
🧠 Risk/Reward Ratio: 2.65
This setup offers a compelling risk-reward profile, capitalizing on a clear and powerful macroeconomic theme. The trade is designed to perform should the expected catalyst confirm the underlying bearish fundamentals.
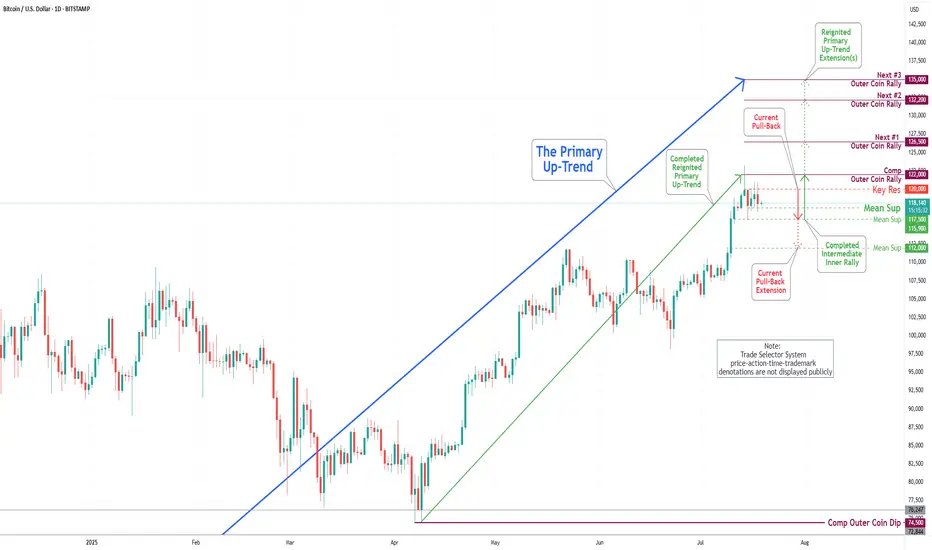
Bitcoin(BTC/USD) Daily Chart Analysis For Week of July 18, 2025Technical Analysis and Outlook:
In last week's trading session, we achieved a new historical high by completing our Outer Coin Rally at 122000. Following this milestone, the coin retraced, as expected, to the newly established Mean Support at 115900 and is currently trading at the Intermediate Mean Support at 117500. Presently, the coin is set to retest the Mean Support at 115900, with the potential for a further pullback to the Mean Support at 112000. This anticipated decline will necessitate a retest for the completed Outer Coin Rally at 122000. The designated targets for the renewed Primary Up-Trend are 126500, 132200, and 135000.
NZDCAD: High-Conviction Long - Fundamental Strength & TechnicalThis analysis identifies an extremely high-conviction long opportunity in the NZDCAD currency pair 📈🇨🇦🇳🇿. Our conviction is primarily driven by a significant divergence in monetary policy outlooks and economic fundamentals between New Zealand and Canada. New Zealand's economic resilience, underpinned by robust dairy prices and a less dovish central bank stance, contrasts sharply with Canada's decelerating growth, rising unemployment, and a central bank poised for further rate cuts amidst trade policy uncertainties. Technically, NZDCAD appears poised for an upward move from key support levels, supported by bullish momentum indicators on the 4-hour chart. This is a medium-term trade expected to play out over days to weeks. 🗓️
I. Fundamental Rationale: Diverging Economic Trajectories 📊🌍
The core of this trade lies in the starkly different economic paths New Zealand and Canada are currently on, creating a compelling fundamental case for NZD appreciation against CAD:
Monetary Policy Divergence:
New Zealand (NZD): The Reserve Bank of New Zealand (RBNZ) maintained its Official Cash Rate (OCR) at 3.25% in June 2025. Analysts anticipate a hold at the upcoming July 9 meeting, balancing growth concerns with an "uncomfortably high near-term inflation outlook". This signals a less aggressive easing path. 🏦🇳🇿
Canada (CAD): In contrast, the Bank of Canada (BoC) held its policy rate steady at 2.75% in June 2025, after nine consecutive 0.25% cuts since June 2024. Market expectations for the upcoming July 30, 2025 meeting indicate a 33% chance of a further 25 basis point cut, with economists anticipating gradual cuts to 2.25% by mid-2025. This clear easing bias is driven by consistently below-target inflation (1.73% in May 2025). 📉🇨🇦
Impact: This creates a clear and widening interest rate differential fundamentally favoring the NZD. 💰
Inflation Outlook:
New Zealand: Annual inflation accelerated to 2.5% in Q1 2025, exceeding market expectations and marking the highest rate since June 2024. This reinforces the RBNZ's cautious stance. ⬆️
Canada: Canada's CPI registered 1.73% in May 2025, notably below the BoC's 2.0% target, providing ample justification for further monetary easing. ⬇️
Economic Performance & Labor Market:
New Zealand: GDP is projected to grow by 1.9% in 2025. The unemployment rate remained unchanged at 5.1% in March 2025, with average hourly earnings increasing by 4.5% annually. 💼✨
Canada: Real GDP contracted by 0.1% in April 2025, with a flash estimate pointing to another 0.1% decline in May, implying an annualized loss of 0.3% in Q2 2025. The unemployment rate rose to 7.0% in May 2025, its highest since September 2016 (excluding pandemic years). 📉🏭
Impact: New Zealand demonstrates greater economic resilience and a more stable labor market. 💪
Commodity & Trade Dynamics:
New Zealand: Benefits significantly from surging dairy prices, its top export commodity, which saw a substantial 10% increase in Q1 2025, with Fonterra forecasting record milk prices and production volumes. This contributed to a robust monthly trade surplus of $1.2 billion in May 2025. 🥛🧀💰
Canada: While the CAD maintains a strong positive correlation with oil prices, energy exports decreased by 5.6% in May, with crude oil exports falling 4.0%. Furthermore, Canadian exports to the US have declined for four consecutive months due to ongoing US tariffs. 🛢️📉
Impact: Strong commodity tailwinds and a healthy trade surplus for NZD, versus tariff-induced headwinds and declining energy exports for CAD. 🌬️
Yield Differential: The New Zealand 10-year government bond yield (4.57% as of June 30, 2025) is notably higher than Canada's (3.38% as of July 3, 2025). This provides a positive carry for holding NZD over CAD. 📊
II. Technical Rationale: Chart Insights (4-Hour Timeframe) 📈🔍
The technical picture on the 4-hour chart supports a bullish reversal from current levels, complementing the fundamental outlook:
Current Price Action & Long-Term Trend: NZDCAD is currently approximately 0.8277 (as of July 1, 2025). While short-term analyses may show a "sharp bearish trend," the pair is described as "trading in an uptrend and currently is in a correction phase" as it approaches a key support area. The 1-month change for NZDCAD is +0.13%, and year-to-date is +2.45%, indicating a longer-term bullish bias despite recent fluctuations. This corrective dip presents a favorable entry point. 📉➡️📈
Key Support & Resistance Levels:
Entry Point (0.8270) is strategically chosen near the immediate support cluster, specifically around the Pivot Point 1st Support of 0.8276 and an identified buying opportunity zone around 0.82700. ✅
Take Profit (TP) of 0.8350 is positioned just below the Pivot Point 3rd Level Resistance of 0.8356. 🎯
Stop Loss (SL) of 0.8220) is carefully placed below the key support levels of 0.8240 (Pivot Point 3rd Support) and 0.8236 (Pivot Point 3rd Support). A sustained break below this level would invalidate the bullish thesis. 🛑
Momentum Indicators:
RSI (14): The 14-day RSI for NZDCAD is around 41.78 to 54.33, suggesting a neutral to slightly bullish sentiment, with room for upward movement. 📊
MACD (12, 26, 9): A "bullish divergence" has been identified on the hourly timeframe, often signaling a return of buying interest. The MACD line is also observed to be slightly above its signal line, hinting at a potential bullish crossover. ⬆️
Moving Averages: The 50-day Simple Moving Average (SMA) is positioned slightly above the 200-day Exponential Moving Average (EMA). This configuration suggests a potential bullish crossover of longer-term moving averages, generally considered a positive long-term signal. 📈
III. Trade Setup: 📋✨
Currency Pair: NZDCAD 🇳🇿🇨🇦
Direction: Long (Buy) ⬆️
Entry Point: 0.8270
Take Profit (TP): 0.8350
Stop Loss (SL): 0.8220
Calculated Risk (in pips): 50 pips
Calculated Reward (in pips): 80 pips
Risk-Reward Ratio: Approximately 1.6:1 (A favorable ratio for a high-probability setup!) ✅
Key Considerations: Always adhere to strict risk management principles, risking no more than 1-2% of your total trading capital on this single trade. Be mindful of potential volatility around upcoming high-impact economic events in July, particularly the RBNZ and Bank of Canada interest rate decisions, and inflation data. 🗓️🔔

$JPINTR -Japan Interest Rates (June/2025)ECONOMICS:JPINTR
(June/2025)
source: Bank of Japan
- The Bank of Japan kept its key short-term interest rate unchanged at 0.5% during its June meeting, maintaining the highest level since 2008 and aligning with market expectations.
The unanimous decision underscored the central bank’s cautious stance amid escalating geopolitical risks and lingering uncertainty over U.S. tariff policies, both of which continue to pose threats to global economic growth.
Tokyo and Washington agreed to extend trade talks after failing to achieve a breakthrough during discussions on the sidelines of the G7 Summit in Canada. Meanwhile, as part of its gradual policy normalization, the BoJ reaffirmed its plan to cut Japanese government bond purchases by JPY 400 billion each quarter through March 2026.
Starting April 2026, it will then slow the reduction to JPY 200 billion per quarter through March 2027, targeting a monthly purchase level of around JPY 2 trillion—signaling a measured but steady path away from ultra-loose monetary policy.

Gold Poised to Shine - 18% Upside Projected by Completing Wave 5Gold is currently trading around 494.92 RMB per gram in China as of July 25, 2023. Based on the technical analysis on XAUCNY showing we are currently in wave 5, subwave 4 of an upward trend, the prediction is that by January 2025, the price for 1 ounce of gold will reach 16575 RMB.
Given that 1 ounce equals 28.3495 grams, a price of 16575 RMB per ounce implies that the price per gram of gold is expected to reach around 584 RMB by January 2025.
This represents an increase of approximately 18% from the current price of 494.92 RMB per gram. Going from subwave 4 to subwave 5 typically signals the final leg of an advancing trend before it completes the larger degree wave 5. If the analysis is correct, we can expect the 18% price increase to occur over the next 1.5 years as gold enters the terminal subwave 5.
The ongoing expansionary monetary policies by central banks globally serves as a key driver supporting higher gold prices. High inflation levels in many economies incentivizes investors to allocate more funds to gold as an inflation hedge. Geopolitical tensions, such as the Russia-Ukraine conflict also increase safe-haven demand for gold.
While risks remain, such as potential interest rate hikes that strengthen the dollar, the overall backdrop still seems conducive for higher gold prices. From a technical perspective, the upside projection toward 584 RMB per gram over the next 1.5 years aligns with the view that subwave 5 will see accelerating upside momentum toward completing wave 5.
In summary, based on current technical analysis, the prediction is that gold will reach 584 RMB per gram by January 2025, an 18% increase from today's levels, as it completes the final wave 5 uptrend over the coming months. The macroeconomic and geopolitical environment also seem supportive of this view.

Can Turkey's Lira Dance with the Dollar?Turkey stands at a pivotal moment in its economic journey, navigating through the complexities of fiscal management and monetary policy to stabilize the Turkish Lira against the US Dollar. The nation has embarked on a strategic pivot towards domestic funding, significantly increasing the issuance of Turkish Government Bonds to manage soaring inflation and debt service costs. This approach, while stabilizing in relative terms, challenges Turkey to balance between stimulating growth and controlling inflation, a dance that requires both precision and foresight.
The Central Bank of Turkey's decision to cut rates amidst rising inflation paints a picture of calculated risk and strategic optimism. The bank is threading a needle between fostering economic activity and maintaining price stability by targeting a reduction in inflation over the medium term while allowing short-term increases. This policy shift, coupled with a focus on local funding, not only aims to reduce external vulnerabilities but also tests the resilience of Turkey's economy against global economic currents, including the impact of international political changes like the US election.
Globally, the economic landscape is fraught with uncertainties, and Turkey's strategy of maintaining a stable credit rating while forecasting a decrease in inflation sets an intriguing stage. The country's ability to attract investment while managing its debt profile, especially in light of global monetary policy shifts by major players like the Federal Reserve and the ECB, will be a testament to its economic stewardship. This narrative invites readers to delve deeper into how Turkey might leverage its economic policies to not only survive but thrive in a fluctuating global market.
The enigma of the USD/TRY exchange rate thus becomes a compelling study of economic strategy, where every policy decision is a move in a larger game of financial chess. Turkey's attempt to balance its books while dancing with the dollar challenges conventional economic wisdom and invites observers to ponder: Can a nation truly master its currency's fate in the global marketplace?

Can the Dollar Index Predict Global Chaos?In the intricate dance of global finance, the U.S. Dollar Index has emerged as a pivotal player, reaching heights unseen in over two years. This surge, coinciding with Donald Trump's anticipated return to the White House, underscores a market bracing for significant policy shifts. The index's climb is not just a number; it's a beacon reflecting the resilience of the U.S. economy amidst high interest rates and a low unemployment rate, painting a picture of optimism where investors envision a 'goldilocks' scenario under new economic policies.
However, this rise is shadowed by tariff threats, hinting at potential global trade disruptions. The depreciation of European currencies against the dollar signals a market in flux, with investors recalibrating their strategies in light of possible protectionist measures. This scenario challenges us to ponder the broader implications: How will these tariffs reshape international trade dynamics, and what does this mean for the global economic order that has favored open trade for decades?
The Dollar Index's ascent also prompts a deeper reflection on currency as a barometer of geopolitical stability. With the U.S. potentially stepping into a new era of economic policy, the world watches closely. This moment invites investors and policymakers alike to consider global economic relations' immediate impacts and long-term trajectory. Will this lead to a reevaluation of the dollar's role as the world's reserve currency, or will it strengthen its position amidst global uncertainties? This question is not just about economics; it's about understanding the undercurrents of power and influence in a world at a crossroads.
