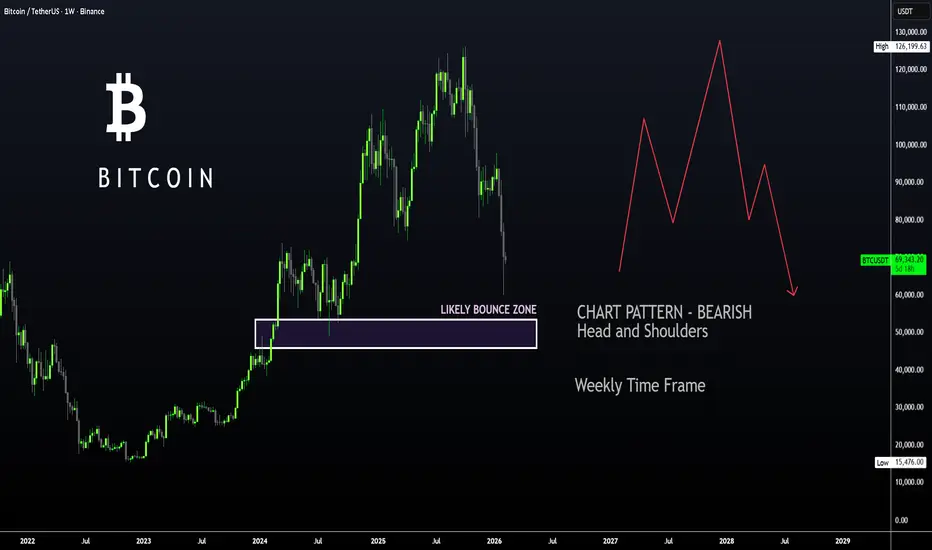
BTC Update - Only a FEW WILL SEE THIS !!Hello Bitcoin Watchers 📈
BT has made a bold and bearish pattern in the weekly, and it's a massive head and shoulders pattern:
And for the first time since May 2022 , the weekly moving averages has dropped to the lower band, the 200d moving averages:
This is when the heart of the bearish cycle starts, and we can easily see another -30% drop over the next few months.
BINANCE:BTCUSDT
Moving Averages
Booz Allen Hamilton Holding Corp | BAH | Long at $76.60Technical Analysis
Booz Allen Hamilton Holding Corp NYSE:BAH has officially dipped into my selected "crash" simple moving average zone. While the base of this zone is currently at $71, I am not super confident it will hold here. The "major crash" simple moving average area is currently between $51 and $60 and there is a good chance it will get there in the near-term. If so, it will be a much stronger entry point.
Insiders
$2.4 million purchased by insiders in the last 3 months at an average around $87.
Health & Fundamentals
P/E: 11.8x
Dividend: 2.98%
Debt-to-Equity: 4x (high)
Price-to-Free-Cash-Flow Ratio: 12x (undervalued)
Quick ratio / short-term debt: 1.8 (healthy)
Altman's Z Score / bankruptcy risk: 4.1 (healthy)
Action
While near-term weakness may drop the price of NYSE:BAH into the $50s, I would personally view it as even more of a deal. Thus, I am diving into a starter position at $76.60 ("crash" simple moving average zone) and plan to add significantly more in the $50s ("major crash" simple moving average zone).
Targets into 2029
$87.00 (+13.6%)
$105.00 (+37.1%)

$ZEC Top Called PERFECTLYI called the top of Zcash perfectly huh 🤓
GETTEX:HYPE following the CRYPTOCAP:ZEC playbook next.
ZEC gets interesting again to me after a full retrace.
$25-30 I'd start deploying funds in.

SENTINEL LITE — Beginner Walkthrough (15M Example)🛡️ SENTINEL LITE — Beginner Walkthrough (15M Example)
This chart shows how a beginner should read structure step by step.
We do not predict.
We read.
🧭 How To Read This Chart (In Order)
1️⃣ EMA 200 — The Environment Filter (Red Line)
Price is below EMA 200.
That tells us:
• Macro bias = Bearish
• We prefer sells
• We avoid aggressive longs
Never fight the EMA 200.
2️⃣ EMA 50 — The Structure Filter (Blue Line)
EMA 50 is sloping down.
That means:
• The market is trending down
• Structure is directional
• This is not sideways rotation
If EMA 50 is flat → expect chop.
3️⃣ EMA 21 — The Momentum Line (Yellow)
EMA 21 is below EMA 50.
That confirms:
• Short-term momentum = bearish
• Sellers are in control
When 200 + 50 + 21 align,
probability increases.
🔁 What Is A Pullback?
A pullback is a temporary move against the main trend.
In this bearish chart:
Price drops → retraces upward toward EMA 21 or EMA 50 → then continues down.
Pullbacks:
• Do NOT change structure
• Are where disciplined traders look for continuation
Reversals change structure.
Pullbacks do not.
🚫 Compression Warning
If EMA 21 and EMA 50 are tight and overlapping:
• That is compression
• That is low probability
• Do not force trades
Wait for separation.
📌 Summary Of This Chart
EMA 200 → Bearish environment
EMA 50 → Bearish structure
EMA 21 → Bearish momentum
Pullbacks → Short opportunities
Compression → Avoid
Sentinel Lite teaches structure reading before entries.
Discipline before execution.
⚠ Beginner Rules
• Do not trade against EMA 200
• Do not trade during compression
• Do not chase large candles
• Wait for pullbacks
• Let structure confirm first
#SentinelLite
#BeginnerTrading
#TradingEducation
#PullbackTrading
#EMA
#TrendTrading
#Gold
#XAUUSD
#Forex
#TechnicalAnalysis
#PriceAction

ETHUSDTI am not biased towards BBG:ETHEREUM but this chart tells me that the last support point is at $1200 and to climb above the important $1800 area we need to see a strong break above $2250... BINANCE:ETHUSDT
⚠️The crypto market is dangerous, be careful with your capital.

Sentinel Lite — Pullback vs Reversal vs Range (Live Example)SENTINEL LITE — Pullback vs Reversal vs Range (15M Live Example)
In my previous post, we reviewed a bearish structure and questioned whether the move was a reversal.
After observing the full sequence, structure confirmed continuation.
This is exactly how Sentinel Lite teaches traders to read markets:
Not by predicting.
By confirming.
🧠 After Every Pullback, Price Has Only 3 Outcomes
When price pulls back inside a trend, it can only do one of three things:
1️⃣ Continuation — The trend resumes.
Signs:
• EMA 21 remains aligned with EMA 50
• EMA 50 continues sloping in trend direction
• No break of prior swing high/low
• Pullback forms a lower high (downtrend) or higher low (uptrend)
• EMAs begin separating again
Structure remains intact.
2️⃣ Reversal — The trend changes direction.
Signs:
• Prior swing high/low is broken
• EMA 21 crosses and holds beyond EMA 50
• EMA 50 flattens or begins turning
• Buyers/sellers maintain control above/below EMA 50
• New HH/HL or LH/LL sequence forms
Structure shifts.
3️⃣ Range (Compression) — Momentum pauses.
Signs:
• EMA 21 and EMA 50 overlap
• EMA 50 flattens
• Price repeatedly crosses EMAs
• No sustained higher highs or lower lows
• Candle bodies shrink
Structure pauses.
Sentinel Lite does not predict which outcome will occur.
It waits for structure confirmation.
📉 What Happened on This 15M Chart
Environment
EMA 200 → Bearish
Price below EMA 200
Macro bias = short preference
Structure
EMA 50 sloping down
Directional environment
Momentum
EMA 21 below EMA 50
Sellers in control
Alignment = Bearish.
🔁 First Pullback
Price retraced toward EMA 21.
Checks:
• No break of prior swing high
• EMA 21 stayed below EMA 50
• EMA 50 remained bearish
Result → Continuation.
🔁 Second Pullback
This is where confusion usually happens.
Many beginners think:
“Maybe this is a reversal.”
But structure never shifted.
Checks:
• Did price break prior swing high? → No
• Did EMA 21 cross and hold above EMA 50? → No
• Did EMA 50 flatten or turn? → No
Then momentum expanded down again.
EMAs separated.
Result → Continuation confirmed.
Not reversal.
⚠️ Why It Could Have Ranged
Between pullbacks, EMAs began tightening slightly.
If:
• EMA 21 overlaps EMA 50
• EMA 50 flattens
• No break of structure
Then the market enters compression.
Trend → Pullback → Compression → Either continuation or reversal.
Never assume continuation automatically.
📌 The Real Lesson
The difference is not the candle.
It is:
• EMA alignment
• Structure integrity
• Swing break confirmation
A pullback is not automatically continuation.
It becomes continuation only if structure holds.
It becomes reversal only if structure shifts.
It becomes range if alignment disappears.
Sentinel Lite reads structure.
It does not guess.
Discipline before execution.
#SentinelLite
#MarketStructure
#Pullback
#TrendContinuation
#Reversal
#Range
#XAUUSD
#Gold
#TradingEducation
#EMA
#PriceAction

SENTINEL LITE — What Does The “S” Label Really Mean? (15M)🛡️ SENTINEL LITE — What Does The “S” Label Really Mean? (15M Live Example)
On this 15-minute chart, you can see multiple “S” labels printed by Sentinel Lite.
Many beginners see this and think:
“Sell immediately.”
But that is not how Sentinel Lite is designed to be used.
It does not predict.
It confirms structure alignment.
🧠 What Must Align For An “S” To Print?
For a valid sell condition, Sentinel Lite checks:
1️⃣ EMA 200 — Environment (Red)
• Price below EMA 200
• Macro bias = bearish
• We prefer shorts
2️⃣ EMA 50 — Structure (Blue)
• EMA 50 sloping down
• Market is directional, not ranging
3️⃣ EMA 21 — Momentum (Yellow)
• EMA 21 below EMA 50
• Short-term control = sellers
4️⃣ Pullback Into Structure
• Price retraces toward EMA 21 (sometimes EMA 50)
5️⃣ Momentum Expansion
• Strong bearish candle
• No compression between EMA 21 & 50
When these align →
The “S” label prints.
The label is the result of structure.
Not a signal in isolation.
🔍 What Happened In This Chart?
Notice the sequence:
• Downtrend established (200 / 50 / 21 aligned bearish)
• Price pulls back toward EMA 21
• Structure holds
• Momentum resumes down
The “S” appears at the moment structure confirms continuation.
This is not guessing.
This is alignment.
⚠️ Important: Not Every “S” Is Equal
If EMAs start compressing
If EMA 50 flattens
If price breaks prior swing high
Then probability weakens.
Sentinel Lite prints based on rules —
but YOU must grade context.
📌 The Real Teaching Point
Do not trade because you see an “S”.
Trade because:
• Environment agrees
• Structure agrees
• Momentum agrees
• Pullback confirms
• No compression
Structure first.
Label second.
Sentinel Lite is a structure confirmation tool.
Not a prediction machine.
#SentinelLite
#MarketStructure
#EMA
#PullbackTrading
#TrendContinuation
#XAUUSD
#Gold
#TradingEducation
#TechnicalAnalysis
#PriceAction

SENTINEL LITE - Beginner Introduction🛡 SENTINEL LITE — Beginner Introduction
Start Here Before Trading
If you are new to trading, this is where you begin.
Sentinel Lite is not a prediction tool.
It is a structure-reading framework.
Before placing a trade, you must first understand:
• Direction
• Structure
• Momentum
Sentinel Lite simplifies this into 3 EMAs.
🔴 EMA 200 — The Environment Filter
The red line defines the big picture.
Ask yourself:
Is price above or below the red line?
• Above → Constructive / bullish environment
• Below → Defensive / bearish environment
Beginner Rule:
Do not fight the EMA 200.
This defines macro bias.
🔵 EMA 50 — The Structural Filter
The blue line shows whether the market is trending or rotating.
If EMA 50 is clearly sloping:
→ Structure is directional.
If EMA 50 is flat:
→ Structure is mixed or choppy.
Repeated rejection from EMA 50 often signals continuation probability.
🟡 EMA 21 — The Momentum Line
The yellow line shows short-term control.
• EMA 21 above EMA 50 → Buyers in control
• EMA 21 below EMA 50 → Sellers in control
In strong trends:
Price respects EMA 21 during pullbacks.
In weak markets:
Price crosses it frequently.
How To Read Them (Always In This Order)
1️⃣ EMA 200 (Environment)
2️⃣ EMA 50 (Structure)
3️⃣ EMA 21 (Momentum)
4️⃣ Then price behavior
When all three align → probability increases.
When EMAs compress → probability decreases.
🚫 Beginner Rule
If EMAs are tight and overlapping:
This is compression.
This is chop.
This is low probability.
Do not force trades in compression.
What Sentinel Lite Teaches
• Trade with structure
• Avoid emotional entries
• Respect macro bias
• Wait for alignment
Trading is not about prediction.
It is about probability and discipline.
🛡 Sentinel Lite — Learning Mode
By Pips0mnian
#SentinelLite
#XAUUSD
#Gold
#EMA
#MovingAverages
#BeginnerTrading
#PriceAction
#IntradayTrading
#TrendTrading
#ForexEducation
#TradingView
#TechnicalAnalysis

Beginner Guide - How to Read EMAs on the Sentinel Core (15m)Sentinel Core uses three layers of structure:
🟡 EMA 21 → Short-term control
🔵 EMA 50 → Structural filter
🔴 EMA 200 → Macro bias
You always read them in that order:
200 → 50 → 21 → then price behavior
1️⃣ EMA 200 (Red) — Macro Bias
This is your environment filter.
On your chart:
EMA 200 is sloping down
Price is trading below it
That immediately tells you:
👉 Macro bias = bearish
👉 We prefer shorts
👉 Longs are lower probability unless structural shift occurs
Rule:
Above EMA 200 = constructive environment
Below EMA 200 = defensive / bearish environment
You do NOT fight the 200.
2️⃣ EMA 50 (Blue) — Structural Filter
This tells you if structure is trending or rotating.
On your left side:
EMA 50 is clearly sloping down
Price respects it as resistance
That confirms:
👉 Bearish structure alignment
When price retraces into EMA 50 and rejects → continuation probability increases.
If EMA 50 goes flat → environment weakens.
3️⃣ EMA 21 (Yellow) — Short-Term Control
This is momentum.
On your chart:
EMA 21 stays below EMA 50
Pullbacks remain shallow
Candles respect 21 during impulses
That tells you:
👉 Sellers are in short-term control
👉 Momentum is aligned with structure
If EMA 21 crosses above 50 and holds → structural shift warning.
🔎 What Happens in Compression?
See marked this well on your chart.
When:
EMA 21 & 50 compress tightly
Candles overlap
No clear higher high / lower low
Sentinel Core reduces probability.
That is a no-trade zone.
EMAs separating = expansion
EMAs compressing = chop
🧠 How To Read Your Chart Specifically
Early section:
Price below EMA 200
21 < 50
Clean downward slope
→ Bearish continuation phase
Mid section:
21 and 50 compress
Price rotates sideways
→ Reduced probability environment
Right section:
Still below 200
50 acting as resistance
→ Bearish bias remains intact
No structural shift occurred because:
Price never reclaimed 200
21 never sustainably held above 50
No bullish expansion sequence
So Sentinel Core would grade this as:
Defensive / Bearish Structure with rotational pauses.
🔐 The Golden Rule
You do not trade crosses.
You trade alignment + separation + structure.
Alignment = 21 & 50 positioned correctly
Separation = volatility expansion
Structure = higher high / lower low confirmation
All three must agree.
Sentinel Core does not predict.
It grades alignment.
Structure first.
Momentum second.
Execution last.
#XAUUSD #Gold #EMA #Scalping #Intraday #TrendStructure #SentinelCore #PriceAction

Mastercard: Heading for the Target ZoneFollowing a strong recovery, Mastercard faced notable selling pressure again. In the short term, we anticipate further declines within the framework of the turquoise wave C. We expect its low within our green Long Target Zone between $475.58 and $448.65. Simultaneously, this range should also capture the low of the broader magenta wave (4). We then expect a transition into the follow-up wave (5), which should initiate the next upward impulse. In parallel, we consider an alternative scenario with a 36% probability. In this scenario, a turquoise five-wave pattern might be unfolding, with wave alt.3 breaching the resistance at $589.67. In this case, the magenta wave alt.(4) would have concluded almost a year ago and our green Target Zone wouldn’t come into play.

AER - Ascending Channel & MACD Signal Point to Further UpsideAER - CURRENT PRICE : 150.43
AerCap Holdings N.V. (AER) is currently trading at all-time high levels, which reflects strong bullish momentum and continued demand from buyers. When a stock reaches new highs, it enters a price discovery phase with no historical resistance above, often signaling sustained upward strength.
Technically, price is moving within a well-defined ascending channel , forming higher highs and higher lows — a classic sign of a healthy uptrend. In addition, the stock is trading comfortably above the EMA 50, which is sloping upward, confirming that medium-term momentum remains firmly bullish and that pullbacks are being supported.
Momentum indicators are also turning positive. The MACD is showing a fresh bullish crossover, similar to previous instances highlighted on the chart (look at white circle) where a crossover was followed by a strong price rally. The histogram is turning positive again, suggesting that upside momentum is building at an early stage. If this setup follows the previous pattern, it could lead to another leg higher.
Overall, with price at all-time highs, a strong uptrend channel structure, trading above EMA 50, and an early bullish MACD signal, the technical outlook remains biased toward continued upside.
ENTRY PRICE : 148.00 - 150.43
FIRST TARGET : 163.00
SECOND TARGET : 173.00
SUPPORT : 137.55

Beginner Guide – How To Read This 15M Chart Using Sentinel Core🛡 How To Read This 15M Chart Using Sentinel Core
Step 1️⃣ — Start With EMA 200 (Macro Bias)
Look at the red line (EMA 200).
On this chart:
EMA 200 is sloping upward
Price is trading above it (right half of chart)
👉 Macro bias = constructive / bullish environment
We do NOT look for aggressive shorts in this condition.
Step 2️⃣ — Read EMA 21 & EMA 50 Alignment
Yellow = EMA 21 (short-term control)
Blue = EMA 50 (structure filter)
Left Side of Chart (Before Expansion)
EMA 21 crossing above EMA 50
Small pullbacks holding
No deep breakdown below EMA 200
This is Phase 3 beginning — structural shift.
Step 3️⃣ — Identify the Expansion Trigger
Mid-chart:
Strong bullish impulse candle
EMA 21 separates clearly from EMA 50
B signals begin aligning upside
Price accelerates
This is:
🔹 Phase 3 — Structural Shift Confirmed
Upgrade occurred because:
Higher low formed
EMA 21 > EMA 50
Momentum expansion
Clear EMA separation
This is where A+ prints.
Step 4️⃣ — Read the Continuation Phase
Right side of chart:
EMA 21 stays above EMA 50
Pullbacks are shallow
EMA 50 acts as dynamic support
Signals print mostly in trend direction
This is:
🔹 Phase 4 — Continuation / Constructive Pressure
Environment:
Constructive
Buy-side pressure
Higher probability pullback entries
What The Labels Mean On This Chart
🟢 A+
Full alignment
Momentum + structure
High probability
🔵 B
Strong but slightly less confirmation
Still aligned with structure
If signals appear against EMA alignment → probability drops.
How a Beginner Should Read This Chart
When opening a 15M chart:
Look at EMA 200 first
Check if EMA 21 is above or below EMA 50
Wait for separation (avoid compression)
Only take signals aligned with structure
Avoid signals inside overlap zones
Where Most Beginners Go Wrong
On this chart, the mistake would have been:
Shorting during bullish expansion
Taking early signals during small pullbacks
Trading before EMAs separated
Sentinel Core prevents that by grading alignment.
Institutional Summary
This session transitioned from structural rotation into constructive expansion.
Sentinel Core upgraded probability when:
• EMA 21 crossed above EMA 50
• Price held above EMA 200
• Momentum expanded
• Volatility increased
Continuation followed with controlled pullbacks and aligned signal flow.
Structure first.
Alignment second.
Execution third.
Sentinel Core does not predict.
It grades alignment.
🛡 Sentinel Core – 15M Framework
#XAUUSD #Gold #EMA #Scalping #Intraday #TrendStructure #SentinelCore #PriceAction

XAUUSD 15M - Compression to Structural ExpansionToday’s XAUUSD 15-minute session was graded using the Sentinel Core EMA Structure Script.
This chart demonstrates how Sentinel does not predict — it grades environment shifts.
🔻 Phase 1 – Defensive Alignment (Script: Bearish Grade)
Sentinel Core conditions:
• EMA 21 below EMA 50
• Price trading below EMA 200
• Consecutive lower lows
• B signals aligned with downside pressure
Environment: Defensive / Sell-side control
The script correctly graded continuation signals (B) inside bearish alignment.
Pullbacks showed no A+ confirmation because structure had not shifted.
Momentum existed — but alignment remained defensive.
⚠ Mid-Session – Compression Detected
Sentinel Core downgraded probability as:
• EMA 21 & 50 flattened
• Candles overlapped
• No clean higher high sequence
• Core score weakened
This is where discipline matters.
The script avoided high-grade signals.
No A+ prints inside chop.
Environment = Low probability.
No forcing trades.
🟢 Phase 2 – Structural Shift Confirmed
Sentinel Core upgraded the environment when:
• Higher low formed
• EMA 21 crossed above EMA 50
• Price reclaimed EMA 200
• Bullish impulse expanded volatility
Now:
• B signals aligned with upside structure
• A+ printed during strong alignment + momentum
Environment shifted:
Defensive → Constructive
This is the purpose of the framework.
🧠 What Sentinel Core Actually Does
• Grades structure via EMA alignment
• Filters continuation vs pullback
• Suppresses signals inside compression
• Highlights high-probability alignment (A+)
• Separates structure from emotion
It does not call tops or bottoms.
It measures alignment.
🎯 Current 15M Bias (Script-Based)
As long as:
• EMA 21 > EMA 50
• Price holds above EMA 200
• Higher low structure remains intact
Environment remains constructive.
Break below EMA 50 → Neutral.
Loss of EMA 200 → Defensive reset.
🛡 Sentinel Core Components
EMA 21 (Yellow) → Short-term control
EMA 50 (Blue) → Structure filter
EMA 200 (Red) → Macro bias reference
B = Base continuation signal
A+ = High-probability alignment signal
Structured Gold Trading (XAUUSD)
EMA-Based Framework
Session Discipline
Probability Alignment
🛡 Building the Sentinel execution model
Structure first.
Alignment second.
Execution third.
#XAUUSD #Gold #SentinelCore #EMA #Scalping #Intraday #PriceAction #TradingSystem #MultiTimeframe #TrendStructure

Why Market Research Is The #1 Tool-Part 2I wish i could tell you
this strongly with shouts and shouts!!
Technical analysis is very important
don't get me wrong
it is! you need to understand
the technical tools
but you also need market research
The price shows you the footprints
but you need to see who is making them
them footprints
Remember you need to be patient
make sure your market research
aligns with
the technical analysis tools
This is where the confidence comes
from..
Am going to tell you how
i use market research..
One time i wanted to buy
a pair of jeans
but the price was too high
I looked at the market research
and i realised that every time
The manufacturers decided to buy
more cotton
the prices of clothes including
jeans would be on sale!
Now this didn't mean i could
afford them at the sale price
but that was the indicator
i needed
or at-least it gave me a clue
that something is happening
Robert Kiyosaki
calls this Macro economics.
Market research tells
you macro economics
Weather the institutions
are buying or selling
the asset class that you
are interested in
because you want to buy or sell
when the big guys in the markets
are making moves
to avoid being chopped out
or margin called.
This is why market research is very
important and you have to pay for it
or at-least give it time
to understand it.
As you can see from this chart
the price is in between the Fibonacci
range of green
This tells you that them
insiders are watching
this currency pair like you and me are.
So who are these insiders?
Mostly commercial banks
and governments from
around the world
Rocket boost this content to learn more.
Disclaimer: Trading is risky
please only use a simulation trading account
Before you risk you hard earned capital.

Pullback to emaI think, ethusdt will have a pullback to ema, also we have buying some whales in this region

Himadri Speciality Chemical Ltd | Daily Chart | Compression Himadri is currently trading inside a large symmetrical triangle after a prolonged corrective phase. Price is now approaching the apex zone, indicating that a decisive move is likely in the coming sessions.
This is a classic volatility contraction structure.Broader Structure Overview
Strong rally previously rejected from the ₹600–620 major supply zone
Since then, price has been forming:
Lower highs
Higher lows
This has resulted in a multi-month symmetrical triangle
Market is shifting from distribution → equilibrium → potential expansion phase
Pattern Breakdown
Pattern: Symmetrical Triangle
Timeframe: Daily
Nature: Neutral → Breakout-dependent
As price approaches the apex:
Volatility compresses
False moves increase
Breakout probability increases
Scenarios Ahead
✅ Bullish Breakout Scenario
Decisive close above descending trendline (~₹490–500)
Volume confirmation
Upside targets:
₹520 (intermediate supply)
₹590–600 (major supply)
⚠️ Range Continuation
More oscillation inside triangle
Time-based correction continues
❌ Bearish Breakdown
Close below ₹420
Structure invalidation
Opens downside toward previous swing lows
Educational purpose only. Not a buy/sell recommendation.

BTC VWAP Strategy long 4hBINANCE:BTCUSDT VWAP Swing (4H):
- Signal: LONG (Touch VWAP Low from swing-low)
- TP/Exit: first Touch VWAP High (take-profit)

HBAR VWAP Strategy longBINANCE:HBARUSDT VWAP Swing (4H):
- Signal: LONG (Touch VWAP Low from swing-low)
- TP/Exit: first Touch VWAP High (take-profit)
Stats (TV backtest): PF 1.127 | Win rate 54.32% (365/672)
Total P&L +22.16% | Max DD 14.71%

10% Correction coming for MUMicron made a magnificent run in recent months
BUT
Trading 100% above the 200 DMA, closing in on fib extension resistances, being detached from long term volume weighted averages and being overbought on weekly RSI call for a correction
Target 360$

XAUUSD 15M – Structural Rotation & Alignment ShiftUsing the Sentinel Core EMA structure framework, this 15-minute session shows a clear transition from bearish alignment into structural recovery.
🔴 Phase 1 – Bearish Alignment
• EMA 21 below EMA 50
• Price below EMA 200
• Consecutive lower lows
• Environment: Defensive / Sell-side pressure
The downside impulse confirmed expansion in bearish momentum.
Pullbacks during this phase remained inside structure — no higher high formed.
Low probability for longs.
Structure was aligned. The environment was defensive.
⚠ Mid-Session Compression
• EMA 21 and EMA 50 compressing
• Overlapping candles
• No clean higher high sequence
• Momentum weakening
This was a chop zone.
When EMAs compress and structure stalls, probability drops.
No forcing trades inside compression.
Discipline > activity.
🟢 Phase 2 – Structural Shift
• Higher low formed
• EMA 21 crossed above EMA 50
• Strong bullish impulse candle
• Liquidity expansion during session
This marked a clear probability rotation.
The environment shifted from defensive to constructive.
Price reclaimed short-term control and began building higher lows.
🧠 What the Sentinel Labels Mean
B = Base continuation signal aligned with current structure
A+ = Higher probability signal (structure + momentum alignment)
EMA 21 (yellow) = Short-term control
EMA 50 (blue) = Structural filter
EMA 200 (red) = Macro bias reference
Sentinel Core does not predict reversals.
It grades the environment.
🎯 Current 15M Bias
As long as:
• EMA 21 holds above EMA 50
• Higher low sequence remains intact
Short-term structure remains constructive.
Failure below EMA 50 would shift the environment back toward neutral/defensive.
Structured Gold Trading (XAUUSD)
EMA-Based Framework
Session Discipline
Probability Alignment
🛡 Building the Sentinel execution model
Structure first. Alignment second. Execution third.
#XAUUSD #Gold #EMA #Intraday #Scalping #PriceAction #TrendFollowing #MultiTimeframe #TradingFramework

EUR/GBP - ShortI am anticipating the EUR to weaken significantly against the Pound on a technical analysis basis. I am waiting for a rejection around the psychological level at 0.8700 before entry to the downside

Short term bearish 150€ targetTrading 60% above the 200 DMA can't be sustained for long, also big detachment from every long term volume weighted average price
1.618 fib extension at 175€ looks to be a great short term bearish entry
profit-target 150€
long term bullish

15M Structural Overview – Gold (XAUUSD)Using the Sentinel Core EMA Structure Framework, this session demonstrates a transition from bearish alignment into structural recovery.
Phase 1 – Bearish Alignment
EMA 21 below EMA 50
Price below EMA 200
Consecutive lower lows
Core environment: Defensive / Sell-side pressure
The downside impulse confirmed momentum expansion.
Pullbacks within this phase offered no strong bullish confirmation.
⚠ Mid-Session Compression
EMA 21 and 50 compressing
No confirmed higher high sequence
Overlapping candles (chop zone)
Reduced probability environment
This is where discipline matters — no forcing trades during compression.
🟢 Phase 2 – Structural Shift
Higher low formed
EMA 21 crossed above EMA 50
Strong bullish impulse
Liquidity expansion during session
This marked a probability shift from defensive to constructive structure.
Price reclaimed short-term control and began forming higher lows.
🧠 What The Labels Mean
B = Base continuation signal aligned with structure
A+ = Higher probability alignment (momentum + structure stacked)
EMA 21 (yellow) = Short-term momentum
EMA 50 (blue) = Structure filter
EMA 200 (red) = Macro bias reference
Sentinel Core does not predict — it grades structural alignment.
🎯 Current 15M Bias
As long as:
EMA 21 holds above EMA 50
Higher low sequence remains intact
Short-term bias remains constructive.
A sustained move below EMA 50 would shift conditions back toward neutral/defensive.
Structured Gold Trading (XAUUSD)
EMA Structure Framework
Session Discipline
Probability Alignment
🛡 Sentinel Execution Model
Structure first. Alignment second. Execution third.
#XAUUSD #Gold #EMA #Scalping #Intraday #TrendFollowing #MultiTimeframe
