$BTC BOTTOM IN - Dragonfly Doji Reversal CandleBOTTOM IS IN
⚠️ Need to reclaim ~$95k within the next couple days to confirm, but I’m confident.
🐉 Printed a Dragonfly Doji Reversal candlestick with a Volume breakout to accompany.
🐉 RSI also sitting at lowest since Liberation Day.
🐉 Death Cross historically marks bottoms.
🐉 This 29% correction lines up perfectly with prior ones before next impulsive move up.
Moving Averages

EURCAD testing weekly SMA on 1H oversold RSIAs per subject, standard simple setup, EURCAD testing the weekly 20SMA on an oversold RSI on hourly. Also hitting the top of FVG created on Sept 5th. Nothing is certain. Tight SL.

USD/JPY Facing Intervention Risk?The USD/JPY pair is trading around 155.40 today as the dollar gains ground against the yen amid a shift in risk sentiment and fading expectations of a near‑term rate cut by the Federal Reserve. The yen recovered slightly but remains under pressure after the pair hit multi‑month highs near 155.90; Japanese officials are signaling concern over the weakness and rising volatility in the currency market. So while the Yen has room to weaken on the back of rate differentials and fiscal consternation in Japan, further the risk of Japanese FX intervention is increasing, which could act as a ceiling on upside for the pair.
In the above chart, USD/JPY rates have finally breached the February 2025 swing high near 155, the culmination of a two-week effort to scale resistance. Momentum continues to point higher, with USD/JPY well-supported by its 20-day exponential moving average (EMA) on pullbacks. The 2025 high at 158.88 is now in focus; a drop below the 20-day EMA would suggest that the rally has run out of steam.

APT 4H – Stablecoin-heavy L1, swing long from local baseAptos is trading around $2.9 with a market cap near $2.1B, still down ~85% from the $19.9 ATH. At the same time the chain carries ~$512M TVL and ~$1.27B in stablecoins (almost half of that in the RWA token BUIDL). That’s a lot of liquidity for a token this depressed.
Over the last month APT is up ~+10%, and on several recent days Aptos briefly beat both Ethereum and Solana by net stablecoin inflows. The main fundamental driver is the Aave V3 launch on Aptos (first non-EVM deployment) plus an institutional staking narrative (Everstake + Paribu Custody). The big overhang is still tokenomics: ~11–12M APT unlocks each month in 2025 and generally high inflation vs current on-chain demand, plus the controversial “freeze” function at protocol level.
Technical view (#4h)
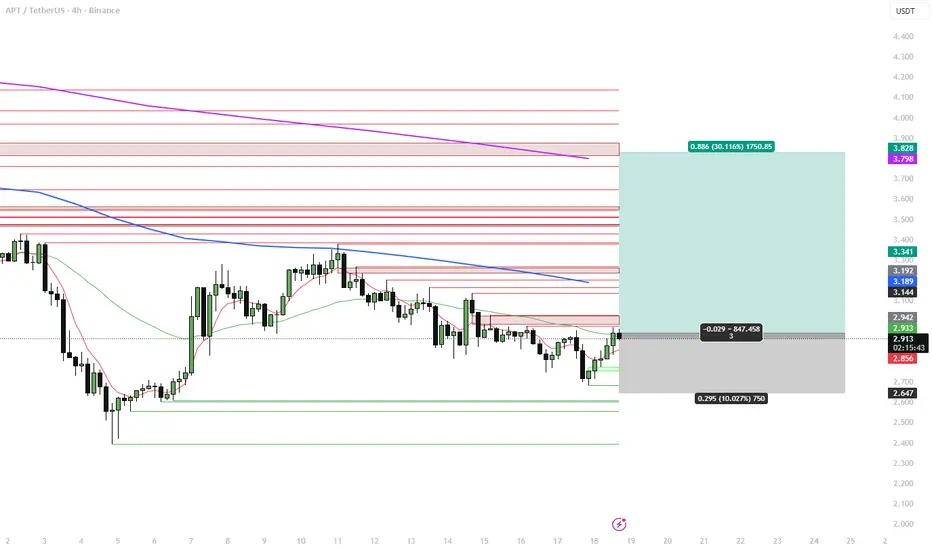
On the 4H chart APT has been in a controlled downtrend from the 3.7–3.8 area and recently put in a local low near 2.63–2.65, right on my lower ATR / demand zone.
Now:
Price is reclaiming the short EMA and pressing into the 4H EMA band from below around 2.9–3.0.
Below sits a well-defined support shelf at 2.60–2.65; above are stacked supply/FVG levels around 3.16–3.20 and a larger cluster near 3.8–3.9, which coincides with higher-TF EMA and previous breakdown zone.
My 4H system has flipped from pure deviation mode to an early trend-reversal long: oversold extension + first reclaim of the EMA band.
I treat this as a swing-long attempt from a local base inside a bigger bearish cycle, targeting a move back into the prior distribution zone.
Trade plan (swing 3–10 days)
Entry: around 2.90–2.95 (current price area).
Main target: 3.30–3.35 – first 4H supply band and old support.
Extended target: 3.80–3.85 – upper supply zone and confluence with higher-TF resistance.
Stop / invalidation: below 2.63–2.65. A confirmed 4H close under this level would mean the current base failed and I step aside instead of averaging down.
This gives roughly 3:1 R:R toward the extended target.
Fundamental context
Aptos is a Move L1 with strong stablecoin presence: ~$1.27B in stables and ~$512M TVL, plus meaningful RWA share (BUIDL ≈44% of stablecoin cap).
Aave V3 on Aptos is the first non-EVM deployment for Aave, anchoring a more “institutional” DeFi narrative on this chain.
Institutional staking partnerships (Everstake + Paribu Custody) support the idea of APT as a staking asset, but not yet as a clear “number go up” token.
Main risks: continuous monthly unlocks (~11M+ APT), inflationary supply vs demand, and competition from larger L1s (Sui, Solana) with bigger TVL and higher chain revenue.
Alternative scenario
If APT loses 2.63–2.65 and starts closing 4H candles below this zone on rising volume, I’ll consider the current long thesis invalid and look for a deeper capitulation / deviation toward 2.4–2.2 before reassessing. No averaging into unlock-driven selling.
Not financial advice – just how I’m structuring a 4H swing long on APT around strong on-chain liquidity and Aave V3, while respecting the heavy tokenomics overhead.
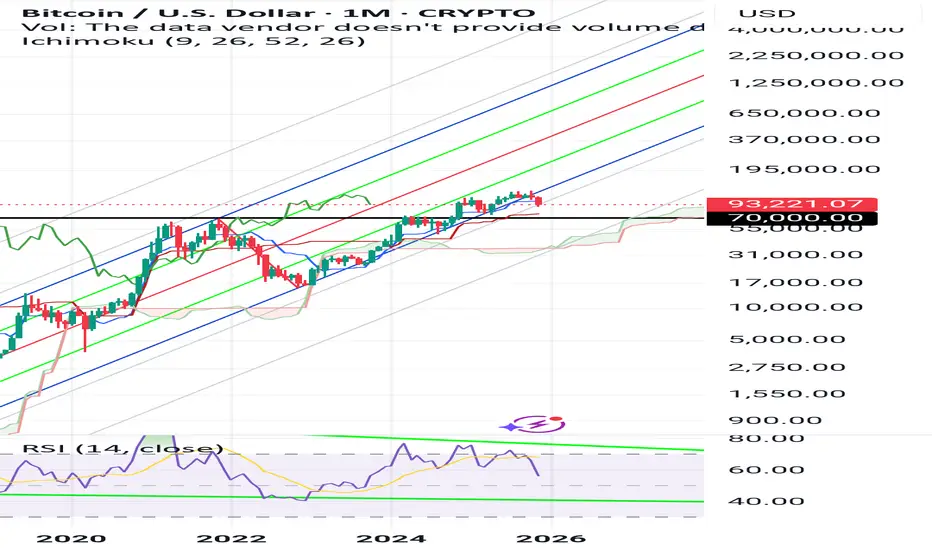
The Future of the Crypto Ecosystem: Will Bitcoin Rise Again?Following Trump’s directive to support digital currencies, Bitcoin surged from around $69,000 to a peak price around $126,000.
But after a period of major turbulence, Bitcoin began to lose value. Based on monthly Ichimoku timeframe analysis and Andrews’ Pitchfork , our models suggest Bitcoin could fall back to around $70,000 in the coming period.
We expect this downward trend to continue until early 2027.
The big question is: what happens after that? Will Bitcoin re-value and recover, or will it get stuck around these low levels, potentially threatening thousands of smaller altcoins?
UNI 4H – Post-UNIfication consolidation longUniswap remains one of the key DEX protocols: TVL is around $4.5B and 30-day DEX volume is roughly $94.6B, which keeps Uniswap at the top of the sector by liquidity and fee generation.
Over the last 30 days UNI is up ~+22%, with a sharp acceleration in November (70%+ week) after the UNIfication proposal: enabling protocol fees and burning up to 100M UNI (~16% of supply). That fundamentally changes expectations for UNI as a value-accrual token rather than “governance only”.
On derivatives, UNI trades with deep liquidity: OI ≈ $560M, ~ $1.16B futures volume and ~$220M spot per 24h, so larger positions can enter/exit without severe slippage. Regulatory tail risk also eased earlier this year when the SEC closed its investigation into Uniswap Labs without charges.
Technical setup (#4h)
After the vertical post-UNIfication spike into the 10–11 area, UNI has been digesting the move in a sideways 4H range roughly between 7.3 and 8.1:
Price is hovering around the 4H EMA band; on higher TFs (1D–3D) UNI still trades above the main EMAs, keeping the broader uptrend intact.
Multiple tests of the lower part of the range (7.3–7.5) have been bought back, with my PRICE_EMA long signals firing near the lower deviation/ATR zone.
Overhead, a major supply/OB cluster sits around 10–10.5, which also matches the prior spike highs and HTF resistance.
I view this as a post-news consolidation above support within an emerging bullish trend.
Strategy context
This trade comes from my 4H EMA-based swing system (trend-following mode):
The system focuses on buying pullbacks to the EMA band during strong momentum phases and targeting prior liquidity zones.
Sample of 30+ trades on alts shows roughly ~70% win rate with average winners larger than losers, at the cost of relatively wide stops and multi-day holding times.
UNI currently fits the “momentum + consolidation on EMAs” template for this system.
Trade plan (swing 3–10 days)
Entry zone: ~7.5–7.7 (current spot around 7.6–7.7).
Main target: 10.2–10.3 – retest of the post-UNIfication spike high and upper supply block.
Stop / invalidation: below 6.8–6.9 (under the lower ATR band and recent local lows). A 4H close below this zone would mean the consolidation broke down and the “second leg” scenario is off.
This gives a rough R:R of ~3.5:1 from entry to the 10.2–10.3 target.
I’ll look to trail partial size if price breaks and holds above 8.5 (orange level) with strong volume, but the core idea is to catch one clean extension from the current range into the upper resistance cluster.
Fundamental snapshot
Key bullish points:
UNIfication: proposal to turn on protocol fees and burn up to 100M UNI (~16% supply), aligning Labs, Foundation and DAO economics and finally connecting UNI to protocol cash flows.
Strong fee engine: Uniswap generates ~$1.25B annualized fees, ~$100M in the last 30 days, currently all going to LPs – a large “pool of value” that fee switch can redirect partially to UNI.
Sector leadership: ~$94.6B 30-day DEX volume and deep liquidity in UNI markets (tens of millions in depth), making it one of the core DeFi blue chips.
SEC case closed: investigation into Uniswap Labs ended without charges, cutting a major tail risk.
Key risks:
UNIfication is not fully implemented yet – parameters of fee switch and burn (LP share vs DAO vs burn) can still change and may trigger LP outflows.
DeFi / DEX tokens as a group still trade at a discount vs L1s, and Fear & Greed is in Extreme Fear territory.
UNI is still ~−80% below its $44 ATH, so structurally it’s early in any potential new DeFi cycle.
Alternative scenario
If UNI breaks down and starts closing 4H candles below 6.8–6.9 with no new positive catalysts on UNIfication or DeFi sentiment, I’ll treat this setup as invalid and stand aside, watching the 6.0–5.5 area for a deeper retrace and fresh structure before considering new longs.
Not financial advice — just my structured 4H EMA swing long on UNI, combining the current consolidation pattern with system stats and the UNIfication fundamental narrative.

NOK/JPY Short Term PullbackLooking for a breakdown of the current range to initiate short term pullback.
MACD showing divergence on the bull side, moving averages consolidating.

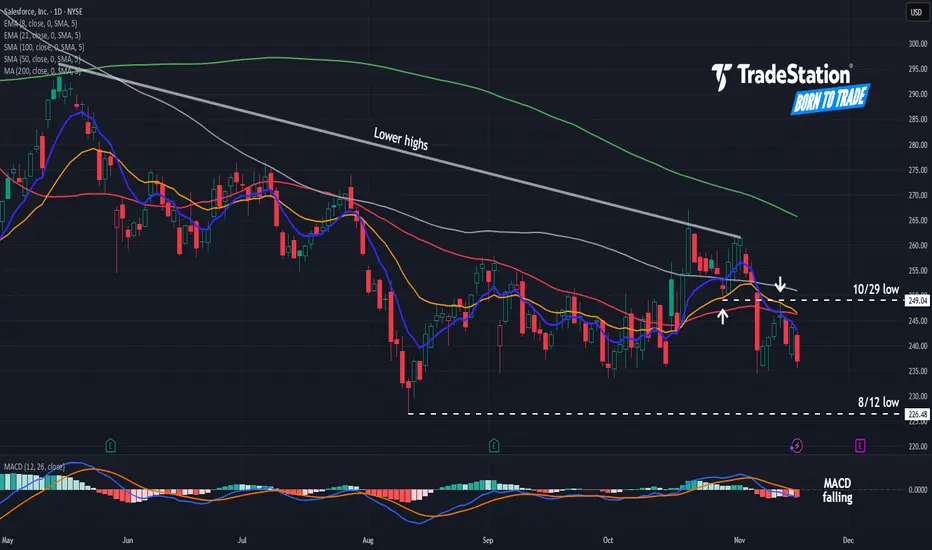
Salesforce May Be SlidingSalesforce has limped despite the broader market climbing. Now some traders may see risk of a bigger slide in the software company.
The first pattern on today’s chart is the series of lower highs since mid-May. That could suggest sellers outnumber buyers.
Second, the 50-day simple moving average (SMA) is below the 100-day SMA. Both are below the 200-day SMA. Such a configuration, with faster SMAs under slower ones, could reflect a long-term downtrend.
Third, the 8-day exponential moving average (EMA) recently crossed below the 21-day EMA. MACD is also falling. Those signals may be consistent with a short-term downtrend.
Fourth, CRM bottomed at $249.04 on October 29 and peaked near that level on November 12. Has old support become new resistance?
Finally, traders may see risk of a move toward the 52-week low below $230 if weakness continues.
TradeStation has, for decades, advanced the trading industry, providing access to stocks, options and futures. If you're born to trade, we could be for you. See our Overview for more.
Past performance, whether actual or indicated by historical tests of strategies, is no guarantee of future performance or success. There is a possibility that you may sustain a loss equal to or greater than your entire investment regardless of which asset class you trade (equities, options or futures); therefore, you should not invest or risk money that you cannot afford to lose. Online trading is not suitable for all investors. View the document titled Characteristics and Risks of Standardized Options at www.TradeStation.com . Before trading any asset class, customers must read the relevant risk disclosure statements on www.TradeStation.com . System access and trade placement and execution may be delayed or fail due to market volatility and volume, quote delays, system and software errors, Internet traffic, outages and other factors.
Securities and futures trading is offered to self-directed customers by TradeStation Securities, Inc., a broker-dealer registered with the Securities and Exchange Commission and a futures commission merchant licensed with the Commodity Futures Trading Commission). TradeStation Securities is a member of the Financial Industry Regulatory Authority, the National Futures Association, and a number of exchanges.
TradeStation Securities, Inc. and TradeStation Technologies, Inc. are each wholly owned subsidiaries of TradeStation Group, Inc., both operating, and providing products and services, under the TradeStation brand and trademark. When applying for, or purchasing, accounts, subscriptions, products and services, it is important that you know which company you will be dealing with. Visit www.TradeStation.com for further important information explaining what this means.
Megaphone Broadening Top Likely on SPXOver the last few months, the market has been increasingly difficult to trade as it searches for direction. Stop losses were triggered for longs on Oct 10, and shorts were equally liquidated on the run up beginning Oct 27th. What has formed is a broadening top, confirmed by two points of touch on each side of the pattern.
Broadening patterns can go in both directions, but supporting information suggests this is the end of the bull market:
On the weekly chart, there is a MACD cross.
There is a clearly defined 5 wave structure from the October 2022 bottom. It is a textbook example of Elliot Wave Theory.
Multiple analysts have shown that stock valuations are near historical extremes. It is highly likely that the market is in an AI bubble.
How am I trading this? I have sold all long positions. I am swinging puts that I will close out at the bottom of the megaphone. Once a breakout occurs, a pullback is highly likely to follow, even going so far as to return inside the pattern (60% of the time). If a pullback does occur, I'll load up on long dated puts to profit off a potential bear market.

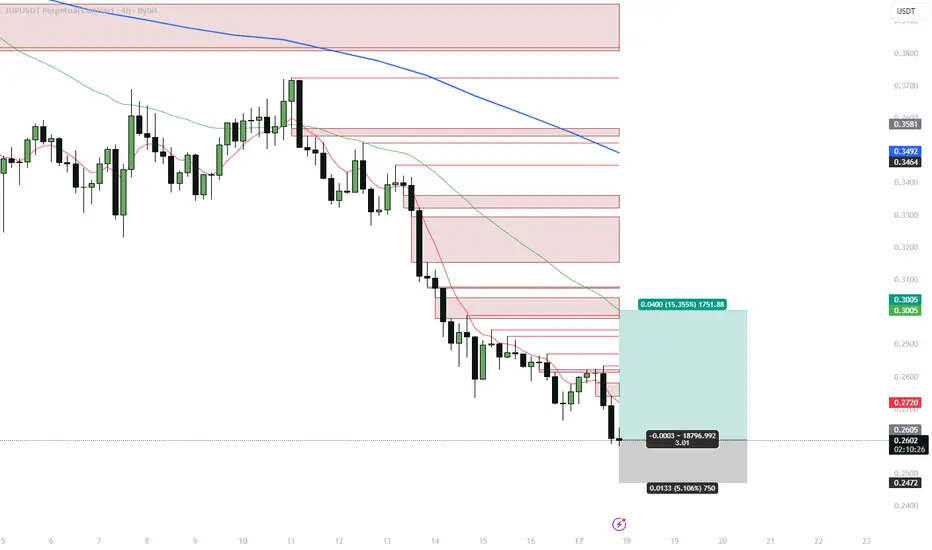
JUP 4H – Deviation long from lower rangeJUPUSDT (Bybit) is trading near the lower end of its autumn range after a clean 4H downtrend from the 0.33–0.34 area. My 4H EMA deviation system has just printed a long signal as price extends away from the higher-timeframe averages.
Technical setup (#4h)
Price is below the 4H, 1D and 3D EMAs, with Dev% on multiple TFs showing strong downside extension (high single-digit / low double-digit % below the mean).
We’ve just tagged a new local low around 0.25–0.26 with several multi-TF exhaustion markers firing near the lower ATR band.
Overhead, the first liquidity pocket and resistance cluster sits around 0.26–0.28, with a larger supply/FVG zone and EMA confluence around 0.30–0.31.
I treat this move as a late leg of the existing selloff and a potential mean-reversion opportunity back into the 4H EMA ribbon and prior supply.
Strategy stats (this 4H deviation system)
Backtest/forward sample: 33 trades, all longs
Win rate: ~69.7% (23 wins / 10 losses)
Avg PnL per trade: ~+4.1%
Avg winning trade: ~+10.0%
Avg losing trade: ~−9.6%
Avg bars in trade: ~34 bars on #4h (≈ 5–6 days), with losers typically lasting longer than winners
The system is built to catch oversold 4H swings with a relatively high hit rate and symmetric win/loss size, so sticking to invalidation levels is crucial.
Trade plan (swing 3–7 days)
Entry: around 0.26 (current long triggered in this area).
Main target: 0.300–0.305 — previous 4H supply zone and confluence with the EMA band.
Stop / invalidation: below 0.247. A 4H close under this level would mean the current demand failed and opens the door toward deeper supports around 0.23–0.22.
This setup offers roughly 3:1 R:R from entry to the 0.30–0.305 target.
Fundamental snapshot (Jupiter)
Jupiter is the main DEX aggregator and perps venue on Solana. Over the last 30 days:
Protocol fees / revenue are roughly $78.8M / $19.0M, showing a robust on-chain business across spot + perps.
Governance approved a burn of ~130M JUP (~4% of circulating supply) from the Litterbox Trust (vote passed on 4 Nov 2025).
Token unlocks continue on a scheduled basis (e.g. ~53.47M JUP on 28 Oct 2025), keeping some overhang in the short term.
November 2025: launch of the Jupiter ICO / launchpad platform, adding another product line on top of swaps and perps.
Saros DLMM integration is aimed at deeper liquidity for JUP and ecosystem pairs.
Net read: cash-flow-positive DeFi infra with upcoming product catalysts, but short-term price still sensitive to unlocks and derivatives positioning — a good environment for volatile swings and mean-reversion trades.
Alternative scenario
If unlock / derivative selling pressure accelerates and JUP starts closing 4H candles below 0.247, I’ll consider this idea invalid and look for a new deviation long lower in the 0.23–0.22 zone rather than averaging down.
Not financial advice — this is my structured 4H EMA deviation long on JUP, combining system stats with current Jupiter fundamentals.
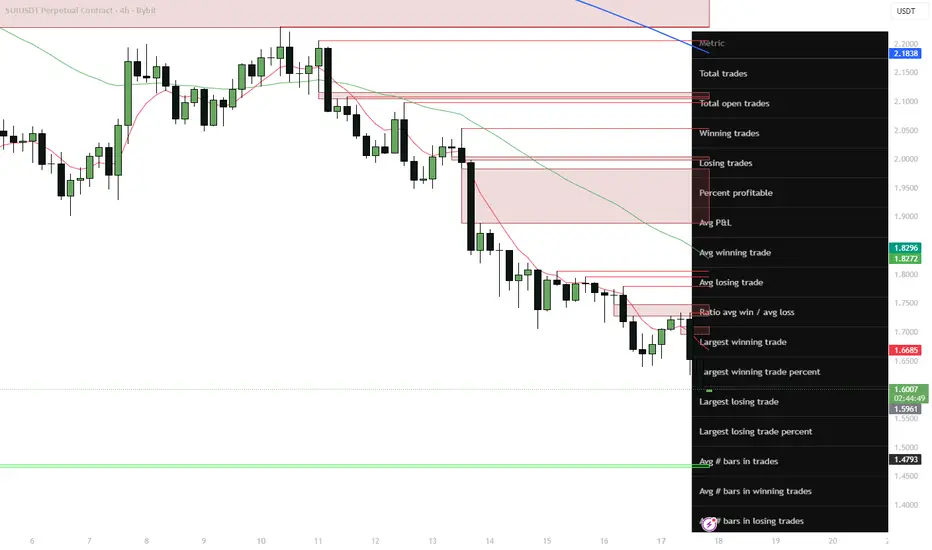
SUI 4H — Deviation long into unlock risk (mean-reversion setup)Got a fresh long signal from my 4H EMA deviation strategy on SUIUSDT (Bybit).
After a persistent downtrend from the 2.3–2.0 area, price has flushed into my lower deviation / demand zone and is now extended from the main EMAs on several timeframes.
On the chart (#4h):
– Price is trading well below the 4H and 1D EMAs, Dev% on multiple TFs shows strong extension away from the mean.
– We just printed another local low with a cluster of my multi-TF “exhaustion” signals, right on the lower ATR band.
– Above price sit the first liquidity pockets around 1.66–1.69 and then a larger supply/FVG zone near 1.75–1.83, aligned with the 4H EMA ribbon.
– I treat this move as a liquidation / unlock front-run leg inside a still-resilient higher-TF range for SUI.
Strategy stats (for this 4H deviation system)
31 trades, all longs:
– Winrate ≈ 83.9% (26W / 5L)
– Avg win ≈ +12.5%, avg loss ≈ −6.6% → avg R:R ≈ 2.37
– Avg holding time ≈ 24 bars on #4h (about 4 days)
So the system is designed to take oversold 4H swings and ride the mean-reversion back into the EMA band / supply zones over 2–5 days.
Trade plan (swing 2–5 days)
– Entry: around 1.60–1.62 (current long triggered near 1.61).
– Main target: 1.75–1.77 — first 4H supply zone and mid of the previous distribution block.
– Extended target: 1.82–1.83 — upper boundary of the 4H supply cluster and confluence with higher EMA/ATR levels.
– Invalidation: 4H close below 1.48. That break would mean the current demand zone failed and I step aside.
This gives an R:R of roughly 1:2 from entry to the extended target.
Fundamental snapshot
SUI is still holding in the upper part of its yearly range despite the recent correction. Over the last 30 days:
– TVL around ~$3.03B (≈$1.64B bridged, ~$1.39B native), with strong DEX volume (~$383.5M/day) and perps volume (~$144.3M/day).
– Narrative tailwinds: upcoming USDsui native stablecoin from Bridge (Stripe-backed), institutional rails via Crypto.com custody/liquidity, and the Mysticeti v2 core upgrade from Mysten Labs.
– Headwinds: notable November unlocks (~$146.6M pool), TVL pullback of ~15% from the October peak and sector-wide risk-off in L1/alt space.
Net read: structurally positive fundamentals and growing ecosystem, but short-term risk is higher due to unlocks and derivatives positioning — ideal conditions for sharp but tradeable mean-reversion moves.
Alternative scenario
If unlock selling and risk-off pressure continue and SUI starts closing 4H candles below 1.48, I’ll treat this as a deeper leg toward the next demand around 1.40–1.35 and will wait for a new deviation signal rather than averaging down.
Not financial advice — just a structured 4H deviation long based on my system stats and current SUI fundamentals.
SYRUP 4H — Deviation long (Maple Finance)SYRUP (Maple Finance) printed a strong flush on the 4H chart and is now trading in my first demand / deviation zone after breaking down from the 0.42–0.45 range.
Fundamentals remain constructive:
– AUM > $5B in Q3, up ~66% QoQ.
– Q3 revenue around $4M with an October ATH of ~$2.16M.
– 25% of protocol revenue is allocated to SYRUP buybacks and staker rewards (MIP-018/019), directly linking the token to cash flows.
So we have a fundamentally supported DeFi credit token going through a short-term deleveraging move.
On the 4H chart:
– Price is trading below both 4H and 1D EMAs, with Dev% showing clear oversold conditions vs the mean.
– The last leg down came with a vertical selling cluster into the lower ATR band.
– Above price, the key liquidity zones are 0.422–0.423 (broken support + EMA area) and 0.44–0.445 (supply cluster / range high).
I treat this as a potential mean-reversion setup rather than a fresh downtrend start.
Trade plan (swing 1–5 days)
– Long area: 0.395–0.405, with optional partial add on a spike toward 0.38.
– Main target: 0.422–0.423 — retest of broken support and the 4H EMA region.
– Extended target: 0.44–0.445 — upper supply zone and range high.
– Invalidaton: 4H closes below 0.355. Stop goes under this level; if it breaks and holds, the setup is done and I wait for a new base lower (0.334–0.31).
This gives an approximate R:R of ~1:2 toward the main target and higher if the extended target is hit.
Alternative scenario
If DeFi risk keeps unwinding and 0.355 fails to hold, I expect price to explore the 0.334–0.31 area, where a new accumulation zone may form. In that case this long idea is invalid and I’ll re-map the structure before looking for the next entry.
Not financial advice — just my 4H EMA deviation swing framework combined with current fundamentals on Maple Finance.

Patterns and colors - Moving averages, fib channel, parallels BTC at recent ATHs was unable to break through key upper resistance in Sept-Oct from a parallel channel originating from the 2018 bull top and the 2023 lows. It is about to test the mid point of that parallel channel which happens to coincide with the 100day moving average (100M/red line).
Traditionally price trends upward finding support at the 50M during a bull market. Once price confirms below the 50M, history shows price will descend towards or even test the 100M (red, start of bull trap) followed by significant bounce up to the upside (yellow circle- 20M drops below 50M, completing the bull trap), quickly followed by a flush to the down side (capitulation).
If this plays out again, price is likely to retest lower fib parallels and hover around the 200M. Note* - each time the 200M bottom is reached, a new lower fib channel is introduced and price is extended further along the x-axis, whether that plays out this time remains to be seen.
A caveat in this setup is that typically the percentage change from red circle to yellow circle, the bull trap, is ~45-60% which would put price back at ATHs? In this model the bull trap, from red to yellow circle would roughly be a 20-30% correction to the upside before ultimately flusing to the downside. To negate this previous pattern setup I'm assuming this longer bull run is likely exhausted after 3 notable pumps/bull flags since the 2022-2023 200M accumulation and is likely due for a larger pull back.
However if more free money is introduced to the system (stimulus checks, lower interest rates, etc) then all bets are off, or rather, reevaluated.
Yellow - 20M tends to cross below 50M (green) at height of bull trap, bull market if above 50M
Green - 50M provides support in bull market, if price goes below, start of bull trap the retest
Red - 100M last warning to sell if price crosses below, or buy if price crosses above
Blue - 200M always accumulate here

Death Cross - Contrarian BuyRarely does the death cross actually provide a meaningful sell signal given its lagging components and, in some cases, can end up being a better buy signal. I think this is one of those times where META death cross is providing another meaningful buy signal as the price is well below the 200-day moving average. A similar setup was provided in April of this year after the tariff tantrum; this time it's on concerns post Q3 earnings on AI spending return model.
I see price safely returning above the 200-day moving average, then slow grind higher back above the 50- and 100-day moving average would have to be assessed but possible as it was climbing back from April lows. I give this setup a $700 price target which would be respectful under this framework to exit the trade.

Visa May Be CrumblingVisa has been rangebound for months, but some traders may think it’s starting to head lower.
The first pattern on today’s chart is the consolidation period between late July and mid-November. At the beginning of the period, V’s 50-day simple moving average (SMA) was above its 100-day SMA. Both were above the 200-day SMA.
Things were just the opposite at the end, with the faster SMAs below the slower ones. That included a “death cross” of the 50-day SMA under the 200-day SMA, which may suggest the longer-term trend is getting bearish.
Second, the Wall Street Journal reported on June 13 that large retailers were exploring the use of stablecoins. V gapped lower on that news and has remained below it since.
Third, MACD is falling and the 8-day exponential moving average (EMA) is below the 21-day EMA. Those patterns may be consistent with a bearish short-term trend.
Next, V is trying to hold the August 7 low of $328.70. Traders may watch a potential break of that support line as a signal for steeper downside.
TradeStation has, for decades, advanced the trading industry, providing access to stocks, options and futures. If you're born to trade, we could be for you. See our Overview for more.
Past performance, whether actual or indicated by historical tests of strategies, is no guarantee of future performance or success. There is a possibility that you may sustain a loss equal to or greater than your entire investment regardless of which asset class you trade (equities, options or futures); therefore, you should not invest or risk money that you cannot afford to lose. Online trading is not suitable for all investors. View the document titled Characteristics and Risks of Standardized Options at www.TradeStation.com . Before trading any asset class, customers must read the relevant risk disclosure statements on www.TradeStation.com . System access and trade placement and execution may be delayed or fail due to market volatility and volume, quote delays, system and software errors, Internet traffic, outages and other factors.
Securities and futures trading is offered to self-directed customers by TradeStation Securities, Inc., a broker-dealer registered with the Securities and Exchange Commission and a futures commission merchant licensed with the Commodity Futures Trading Commission). TradeStation Securities is a member of the Financial Industry Regulatory Authority, the National Futures Association, and a number of exchanges.
TradeStation Securities, Inc. and TradeStation Technologies, Inc. are each wholly owned subsidiaries of TradeStation Group, Inc., both operating, and providing products and services, under the TradeStation brand and trademark. When applying for, or purchasing, accounts, subscriptions, products and services, it is important that you know which company you will be dealing with. Visit www.TradeStation.com for further important information explaining what this means.

EUR/USD’s November Rally Starts to FadeEUR/USD is moving lower to start the week with the pair trading below 1.1600. The market continues to shift back into a more defensive posture after last week’s retracement in risk appetite.
On the Euro side, comments from ECB Vice President Luis de Guindos that inflation risks remain and that external pressures including tariffs and sovereign stress could complicate the outlook did little to help sentiment. The remarks underscored that the ECB sees limited room to ease policy but offered no new support for the currency.
Across the pond, the U.S. Dollar is seeing gains accumulate against its major counterparts as traders prepare for the release of delayed inflation and labor market data following the government shutdown. With the backlog about to clear the market (September U.S. nonfarm payrolls are due out on Thursday, November 20) is reassessing December Fed cut odds and leaning towards no cut.
In the above chart, EUR/USD rates have found resistance near 1.1670, where the pair failed at the end of October. From a technician’s perspective, the inability to breach the area around the late-September swing lows/late-October swing highs keeps intact the trend of lower highs and lower lows. EUR/USD is seeing momentum fade now that the uptrend from the November low has started to break, with the pair below its 20-day exponential moving average (EMA) and 50-day EMA, both of which have negative slopes.

Disney May Face DownsideWalt Disney spent months in a narrow range, and now some traders may see downside risk.
The first pattern on today’s chart is the $108.66 level. It was the low on May 12 after positive trade news drove the broader market higher. The media giant stayed above that price until last Thursday, when it crossed below it on heavy volume. Has support broken?
Second, DIS spent months in a narrow range before the move. Escaping that pattern may increase the potential for a move.
Third, prices are now below the 50- and 200-day simple moving averages.
Next, some traders may view the May 7 price gap below $100 as a potential area to revisit.
Finally, DIS hasn’t made a new 52-week high since June 30 or a new all-time high since March 2021. That may reflect relative weakness when contrasted with the broader market’s strength over the same period.
TradeStation has, for decades, advanced the trading industry, providing access to stocks, options and futures. If you're born to trade, we could be for you. See our Overview for more.
Past performance, whether actual or indicated by historical tests of strategies, is no guarantee of future performance or success. There is a possibility that you may sustain a loss equal to or greater than your entire investment regardless of which asset class you trade (equities, options or futures); therefore, you should not invest or risk money that you cannot afford to lose. Online trading is not suitable for all investors. View the document titled Characteristics and Risks of Standardized Options at www.TradeStation.com . Before trading any asset class, customers must read the relevant risk disclosure statements on www.TradeStation.com . System access and trade placement and execution may be delayed or fail due to market volatility and volume, quote delays, system and software errors, Internet traffic, outages and other factors.
Securities and futures trading is offered to self-directed customers by TradeStation Securities, Inc., a broker-dealer registered with the Securities and Exchange Commission and a futures commission merchant licensed with the Commodity Futures Trading Commission). TradeStation Securities is a member of the Financial Industry Regulatory Authority, the National Futures Association, and a number of exchanges.
TradeStation Securities, Inc. and TradeStation Technologies, Inc. are each wholly owned subsidiaries of TradeStation Group, Inc., both operating, and providing products and services, under the TradeStation brand and trademark. When applying for, or purchasing, accounts, subscriptions, products and services, it is important that you know which company you will be dealing with. Visit www.TradeStation.com for further important information explaining what this means.

CHFJPY // The red candle formed on November 14th gives a selling opportunity. Our first take profit point is the 8 exponential moving average and our second take profit point is the Kaufman indicator.

$BTC Halfway to Confirming Bear Market - BUT There's HOPE!BAD NEWS ⚠️
₿ITCOIN IS HALFWAY THERE TO CONFIRMING A NEW BEAR MARKET.
🚨 This is the first-time that CRYPTOCAP:BTC has closed below the 50WMA since Dec ’21. We all know what happened after that.
🚨 If we get another consecutive Weekly close below the 50WMA, I am confident this is the beginning of the end for the bull market.
If that happens, I will discuss my new exit strategy and POI in another post.
GOOD NEWS 🙌
⚡️ The long-awaited DEATH CROSS on the Daily Chart has occurred, which historically marks the bottom.
⚡️ PA is sitting at VERY strong support on the .618 Fib
⚡️ RSI is LOWER than the Liberation Day madness Feb - April ’25, and the lowest it’s been since July ’22.
NOTE: This is the smallest correction we’ve had all bull market.
TL;DR 📖
✅ This is the absolute best time to buy CRYPTOCAP:BTC
✅ Just make sure to follow the 50WMA invalidation if you do take a position.
Remember, we have the most insanely bullish macro / regulatory backdrop in crypto’s entire existence.
MY THOUGHTS 🤓
🐂 I truly believe this is the biggest fake-out we’ve ever seen. There’s way too many tailwinds on the horizon to let this go to waste.
🐂 Bulls need a $10k Mega-Candle THIS WEEK to reclaim momentum.
🐂 I’m still a MEGA-BULL until my thesis is invalidated.
⛔️ We could get one last flush ~$92k to grab CME Gap liquidity.
🛑 DO NOT USE LEVERAGE EVER AGAIN!!!

Break or Fade? 8627 Is the BattlegroundOur Australia 200 contract is testing a key level on the charts, providing a decent area to build trade setups around.
8627 is the focal point, coinciding with the Valentine’s Day swing high from February this year. Since then, it has acted as resistance and support on multiple occasions, so it’s no surprise the price now finds itself interacting with the level.
Right now, it’s sitting beneath 8627 after failing to sustain a probe above earlier today. That mirrors what we saw late last week, suggesting bears are selling into strength and have the ascendency. RSI (14) and MACD back this up, both sitting in bearish territory and favouring short setups over long.
If the price remains capped beneath 8627, shorts could be set at or below the level with a tight stop above for protection, targeting either 8565, 8500, or the 200DMA depending on desired risk-reward.
Alternatively, if we see a break and close above 8627, the setup could be flipped with longs placed above with a stop below, targeting 8726 initially given it previously acted as support. As mentioned above, given recent price and momentum signals, this setup goes against the prevailing grain, emphasising the need to see any bullish reversal stick before considering long trades.
Good luck!
DS

Bitcoin Faces the Death Cross — More Pain Ahead?Considering Bitcoin ( BINANCE:BTCUSDT )’s recent movements over the past few days and the Death Cross will happen to BTC, I’ve decided to focus on a daily time frame for today’s analysis. Given the recent events in the U.S. market, especially the sharp decline in the S&P 500 ( SP:SPX ), it’s likely that this downward trend will continue .
What is a Death Cross?
A Death Cross occurs when the 50-day moving average crosses below the 200-day moving average, often signaling a potential bearish trend.
At present, Bitcoin broke the important weekly Support lines and is now breaking a critical Support zone($101,500-$98,200) .
Moreover, considering the correlation with the S&P 500 index, and the fact that the U.S. indices are beginning to recover, it’s unlikely that Bitcoin will decouple from this trend. Therefore, we can anticipate further decline in Bitcoin as well .
Additionally, the rising USDT.D% ( CRYPTOCAP:USDT.D ) is breaking through resistance levels, which can lead to further selling pressure in the crypto market .
In summary, I expect Bitcoin to lose its current Support zone($101,500-$98,200) soon and move towards the Cumulative Long Liquidation Leverage($93,300-$91,300) .
Note: In these times, it’s crucial to maintain strict risk management, as Bitcoin’s volatility has increased. It might also be wise to consider higher time frames for trading to better navigate this complexity.
First Target: $95,720
Second Target: $93,040
Stop Loss(SL): $106,000
Cumulative Short Liquidation Leverage: $112,590-$111,459
Please respect each other's ideas and express them politely if you agree or disagree.
Bitcoin Analysis (BTCUSDT), Daily time frame.
Be sure to follow the updated ideas.
Do not forget to put a Stop loss for your positions (For every position you want to open).
Please follow your strategy and updates; this is just my Idea, and I will gladly see your ideas in this post.
Please do not forget the ✅' like'✅ button 🙏😊 & Share it with your friends; thanks, and Trade safe.

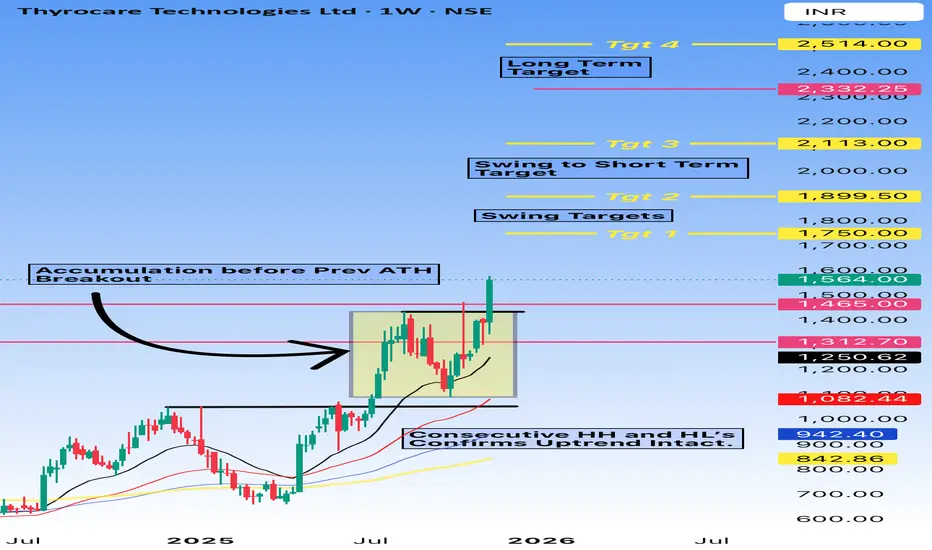
Thyrocare Long - ATH BreakoutThe Chart says it all.
Thyrocare is displaying strong #bullish #momentum, breaking out confidently after a solid period of #accumulation.
The structure is clean—consecutive higher highs and higher lows keep the #uptrend firmly intact.
Price has surged above key resistance levels, turning them into support, and is now marching toward multiple #swing and long-term #targets.
Overall, the chart reflects renewed strength, buyer dominance, and clear upside potential as the trend continues to build. 🚀📈
Levels and Targets in chart.
Disclaimer:
I am not a SEBI-registered advisor. The analysis shared is purely for educational and informational purposes and should not be considered investment or trading advice. Please consult a SEBI-registered financial advisor before making any investment decisions.
Trading and investing in the markets involve risk; you should perform your own research and due diligence.
XAUUSD Bearish📉 XAUUSD Short Setup
EMA rejection
Trendline break
Structure shift to the downside
4H bearish rejection confirmation
