iHeartMedia | IHRT | Long for the US Election CycleiHeartMedia NASDAQ:IHRT has been beat down, but I anticipate it may be on a path toward profitability during this US election cycle. This ad revenue may lead to the beginning of a nice move upward from the $1 range (a personal buy zone), but nothing is certain.
Target #1 - $2.25
Target #2 - $4.00
Moving Averages

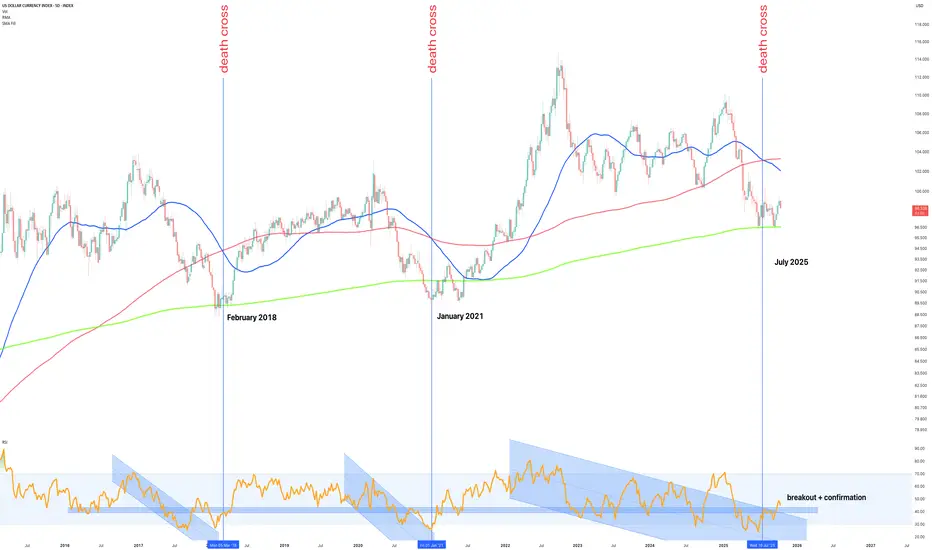
The Dollar Death Cross that marks the beginning – October 2025The term death cross often sends shivers through markets, but in the case of the US Dollar Index (DXY), it’s proven to be quite the opposite.
History tells us that every major death cross on the 5-day chart where the short-term 50 day simple moving average (SMA) crosses below the 200 day long term simple moving average (SMA), has in fact marked the end of a dollar downtrend, not the start of one. This is especially true after a test of the annual Rolling Moving Average (green line), as has just confirmed.
Look left:
February 2018, Death cross printed at the macro low. The dollar rallied for nearly two years.
January 2021, Death cross printed again, just before the dollar began its next sustained advance.
July 2025, Another death cross appears, once again coinciding with price touching the RMA, the same long-term structural support that has historically defined the beginning of each dollar bull cycle.
We can keep looking left if those last three dates do not satisfy, the story does not change, there is no “this time is different” while the DXY is in a macro uptrend.
Now, in October 2025, the RSI confirms a breakout from its multi-year descending channel, adding technical weight to what the moving averages are already signalling: the bear phase is likely over, and the next dollar bull market is quietly beginning. The 50 line is marked out, once it climbs above the rest is history.
What’s Next
Each of the prior bullish reversals began the same way:
1. Death cross, triggering capitulation sentiment.
2. Support test of the annual rolling moving average
3. RSI breakout and confirmation of trend reversal
That structure is now repeating almost perfectly.
If momentum follows prior cycles, the next 6–18 months could see the DXY recover toward the 105–110 zone, with potential for extension beyond 115 over the full bull phase.
A break and hold above 104 would confirm trend strength, while a close below the annual average around 96 would invalidate the structure and delay the signal.
This setup isn’t about calling tops or bottoms, it’s about recognising that death crosses on this timeframe have repeatedly marked strong uptrends for the dollar, not endings as the gold folks would have us believe.
Conclusions
The data is clear: every major death cross in recent DXY history has aligned with the start of a new bullish cycle. The 5-day structure, RSI breakout, and confirmation from the rolling annual average all point toward a macro reversal is underway.
The irony of the name death cross is not lost here, for the dollar, it often signals the exact opposite. If history rhymes once again, October 2025 will be remembered as the quiet beginning of the next US Dollar bull market.
Ww
==============================
Disclaimer
This post is for educational and informational purposes only and represents personal market analysis, not financial advice.
Currency markets are inherently volatile and influenced by complex macroeconomic factors. Always perform your own research, manage risk responsibly, and rely on confirmation, not emotion, when making trading or investment decisions.
Patience, data, and confirmation, the real currency of trading.
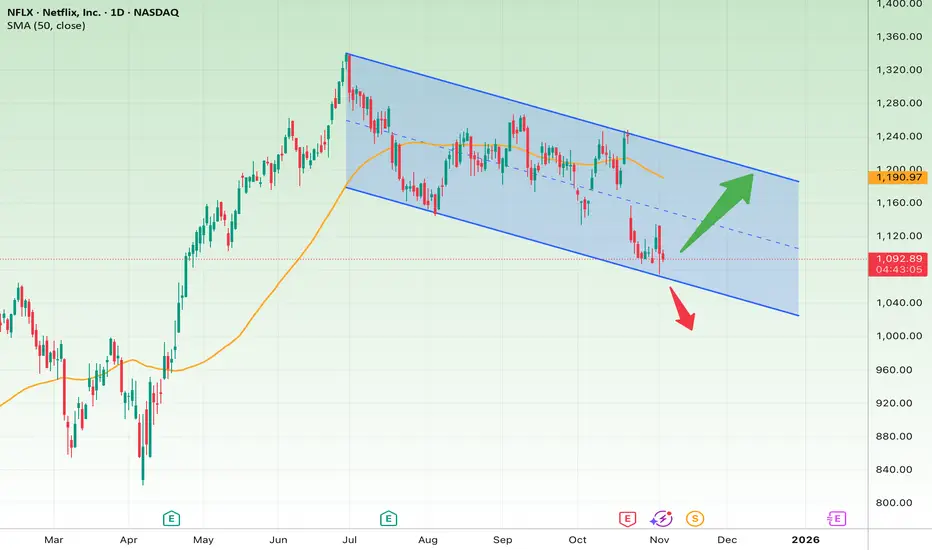
Netflix in a Downtrend ChannelThe Netflix (NFLX) daily chart shows a well-defined descending channel that started from around $1,350 and remains intact. The price is currently trading near the lower boundary of the channel ($1,080–$1,100) — a critical zone where buyers may attempt to step in or where a potential bullish divergence could form.
Short-Term Outlook (next few days to weeks):
In the short term, the $1,080 area acts as strong support. If the price manages to hold above this level and bounce back over $1,130, a corrective move toward $1,180–$1,200 is likely — an area that aligns with both the 50-day SMA and the midline of the channel.
However, a confirmed breakdown below $1,080 could trigger further downside toward $1,020 or even the lower channel line near $980.
• Bullish short-term target: $1,180–$1,200
• Bullish stop loss: Below $1,075
• Bearish short-term target: $1,020–$980
• Bearish stop loss: Above $1,130
Long-Term Outlook (1–3 months):
As long as the price remains within the descending channel, the broader trend stays bearish. Yet, the channel is starting to narrow, which often signals a potential end to the correction phase.
A breakout above the upper boundary ($1,220–$1,250) with confirmed closes would signal a trend reversal, opening the way toward $1,350–$1,400.
Conversely, if the lower channel support around $980 breaks down, the next downside target would be $915.
• Bullish long-term target: $1,350–$1,400
• Long-term stop loss: Below $980
In summary, Netflix is sitting at a decisive point within its downtrend channel — holding above $1,080 could spark a short-term rebound, while a breakdown could send the stock below $1,000 toward deeper support levels.
NVDA at the $200 BattlefieldThe daily chart of NVIDIA (NVDA) shows that after a sharp rally from around $180, the price is now consolidating near a key resistance zone between $200–$205. This level has previously acted as a major resistance area, and it’s now a critical decision point for the next move.
Short-Term Outlook (next few days to weeks):
In the short term, how the price reacts to the $200 zone will be crucial. The latest candle shows a long upper wick and a close below the day’s high, signaling selling pressure. If the price fails to hold $200, a pullback toward the 50-day SMA near $183 is likely.
However, if NVDA can regain and close firmly above $205, bullish momentum could accelerate, targeting the $215–$220 area next.
• Bullish short-term target: $215–$220
• Bullish stop loss: Below $198
• Bearish short-term target: $185 (near the 50-day SMA)
• Bearish stop loss: Above $206
Long-Term Outlook (1–3 months):
The broader trend remains bullish as the 50-day SMA is sloping upward and price remains above it. Sustained closes above $205–$210 would likely confirm a continuation of the uptrend, potentially leading to new highs around $230–$245.
If the $180 support fails, however, the medium-term structure would weaken, opening the door for a deeper correction toward $160.
• Bullish long-term target: $230–$245
• Long-term stop loss: Below $180
In summary, the $200 level is the market’s decision point — a confirmed breakout above it could spark another leg higher, while a breakdown below may lead to a healthy but notable correction.

Tesla: Potential Breakout Coming?Tesla has consolidated for more than two months, and some traders may think a breakout is coming.
The first pattern on today’s chart is the $436.23 level, a previous record weekly close from December. The EV maker has fluctuated on either side of that price since late September without backing down. Is long-term resistance fading?
Second, TSLA has made higher highs and mostly higher lows since October 10. (The only exception came on October 23 following quarterly results. Even then, prices quickly recovered from the opening drop.)
Third, the 8-day exponential moving average (EMA) has stayed above the 21-day EMA. That may reflect a bullish short-term trend.
Next, Wilder’s Relative Strength Index (RSI) has moderated from above 80 while staying over 50. That may suggest an overbought condition has faded without direction turning south.
Finally, TSLA is an active underlier in the options market. (Its average volume of 2.3 million contracts per session ranks second in the S&P 500, according to TradeStation data.) That could help traders take positions with calls and puts.
TradeStation has, for decades, advanced the trading industry, providing access to stocks, options and futures. If you're born to trade, we could be for you. See our Overview for more.
Past performance, whether actual or indicated by historical tests of strategies, is no guarantee of future performance or success. There is a possibility that you may sustain a loss equal to or greater than your entire investment regardless of which asset class you trade (equities, options or futures); therefore, you should not invest or risk money that you cannot afford to lose. Online trading is not suitable for all investors. View the document titled Characteristics and Risks of Standardized Options at www.TradeStation.com . Before trading any asset class, customers must read the relevant risk disclosure statements on www.TradeStation.com . System access and trade placement and execution may be delayed or fail due to market volatility and volume, quote delays, system and software errors, Internet traffic, outages and other factors.
Securities and futures trading is offered to self-directed customers by TradeStation Securities, Inc., a broker-dealer registered with the Securities and Exchange Commission and a futures commission merchant licensed with the Commodity Futures Trading Commission). TradeStation Securities is a member of the Financial Industry Regulatory Authority, the National Futures Association, and a number of exchanges.
Options trading is not suitable for all investors. Your TradeStation Securities’ account application to trade options will be considered and approved or disapproved based on all relevant factors, including your trading experience. See www.TradeStation.com . Visit www.TradeStation.com for full details on the costs and fees associated with options.
Margin trading involves risks, and it is important that you fully understand those risks before trading on margin. The Margin Disclosure Statement outlines many of those risks, including that you can lose more funds than you deposit in your margin account; your brokerage firm can force the sale of securities in your account; your brokerage firm can sell your securities without contacting you; and you are not entitled to an extension of time on a margin call. Review the Margin Disclosure Statement at www.TradeStation.com .
TradeStation Securities, Inc. and TradeStation Technologies, Inc. are each wholly owned subsidiaries of TradeStation Group, Inc., both operating, and providing products and services, under the TradeStation brand and trademark. When applying for, or purchasing, accounts, subscriptions, products and services, it is important that you know which company you will be dealing with. Visit www.TradeStation.com for further important information explaining what this means.

Fibonacci on GoldTrying to figure out how to make the lines match up, so using the starting point of the future retracement as the 50% mark of the previous one, if that makes sense.

Bear Market or Healthy Flush? What MOST People Are MissingEvery time Bitcoin dips, the same old debate comes up: is this the start of a bear market or just a healthy correction?
Here's a scenario that MAY play out, and is one that MOST retail traders aren’t watching.
This isn’t a prediction, but a rather a keen observation. Right now, the charts are giving mixed signals, and that’s exactly why it deserves a closer look.
🔹 What’s Really Happening
After three pushes into the highs, Bitcoin’s daily chart is showing a clear bearish RSI divergence. That usually hints at fading momentum.
At the same time, price fell below the 50 EMA band (1 standard deviation) and got rejected right at the EMA line.
This setup looks almost identical to what happened in May, and back then it led to a solid mid-teens pullback before the trend recovered.
So far, this move from $115K down to the $96K–$98K zone is roughly a 15–17% correction. That’s painful, but still normal inside a bullish cycle.
To call it a bear market, BTC would need to break below that 2024 trendline and print lower lows. That has not happened.
🧭 Why It Matters
This is where traders often get it wrong.
Corrections like this are meant to reset sentiment, clear leverage, and test conviction.
They are not always trend reversals. Sometimes, they are the fuel for the next move up.
If BTC reaches that 2024 trendline with RSI oversold and a bullish divergence forming, that could mark the next major long setup to watch.
📊 Key Zones
Resistance: 50 EMA band (~$115K)
Support: $96K–$98K
Trigger to watch: RSI divergence + trendline retest
Until Bitcoin reclaims the 50 EMA zone, the near-term bias stays cautious.
But this still looks like a healthy flush, not a bear turn.
🪽 Stay sharp, trade smart, and let the charts guide you, not your emotions.

$BTC BEARISH CROSS on the 20 / 200 DMA We had a similar setup at the end of September of 2021 where CRYPTOCAP:BTC then rallied a week later ~75% over the next few weeks.
However, every other time this bearish cross occurred in the past, ₿itcoin has spent at least a couple months trying to reclaim the 200DMA.
Currently PA has closed the Day below the 200DMA.
Bulls CANNOT afford a Weekly close below $106k, which is well outside the DANGER ZONE and .382 Fib
GOOD NEWS: An Inverse Head & Shoulders pattern has formed.
Bulls need some big volume days to come reverse the localized downtrend ASAP.
If not, the 50WMA will be tested ~$103k.
If that happens, Bulls must not show any weakness nor allow Weekly Closes below it.

$USDT.D Cycle Top Indicator HIT !A THIRD CYCLE TOP INDICATOR HAS FLASHED ⚠️
YES this chart is complete chicken scratch, and my mad scientist approach to viewing different trends in USDT Dominance.
I’ve had this November 3rd intersection mapped out for years now.
NO, I do not believe we are anywhere close to the top (see pinned tweet).
Bulls REALLY need to step up big this week with a rally.
We cannot afford two consecutive weeks above 5.5%

$IREN – First 20 SMA Retest + Flag Breakout SetupIris Energy ( NASDAQ:IREN ) is setting up a powerful flag breakout after its first real pullback of this entire move — and it’s happening right as crypto momentum heats up again.
🔹 The Setup:
After a strong rally from $50 → $75, NASDAQ:IREN pulled back in a controlled, low-volume correction.
Price undercut the 20 SMA, quickly reclaimed it, and now sits back above the 9 EMA — a perfect base reset.
Tight flag pattern forming, primed for expansion once momentum kicks in.
🔹 Crypto Sector Strength:
CRYPTOCAP:BTC and CRYPTOCAP:ETH both popped this weekend — that’s classic risk-on behavior.
The entire crypto stock basket is running hot, with leaders like NASDAQ:CIFR and NASDAQ:IREN showing clean technical setups.
This is the first 20 SMA test of the move — historically the most powerful retest in trending names, as late buyers finally get their chance to enter.
🔹 My Trade Plan:
1️⃣ Entry Zone: Watching dips Monday or Tuesday to build a position near the 9 EMA / 20 SMA zone.
2️⃣ If It Gaps Up: I’ll skip swing entries and just day trade the strength — no chasing.
3️⃣ Stop: Below the 20 SMA — tight, logical risk level.
Why I Like This Setup:
First 20 SMA test after a big run = high probability continuation.
Crypto momentum is back — strong sector correlation.
Technical structure is perfect: shallow pullback, rising EMAs, and a clear trigger.

Nike Isn’t Flying AnymoreNike was once an unstoppable consumer giant. However, with its last all-time high four years in the rearview mirror, some traders may see downside risk.
The first pattern on today’s chart is the June 11 high of $64.85. NKE bounced above that level on October 10 but ended the month slightly below it. That may indicate support isn’t holding.
Second, the falling 200-day simple moving average (SMA) is falling. Prices are also slipping back below it, which may suggest its long-term trend is bearish.
Third, the 8-day exponential moving average (EMA) is below the 21-day EMA. That could mean its short-term trend is also bearish.
Fourth, the stock tried to rally after its last earnings report but buyers soon evaporated. Does that reflect a lack of enthusiasm about its fundamentals?
Finally, chart watchers may see risk of NKE revisiting its 52-week low at $52.28.
TradeStation has, for decades, advanced the trading industry, providing access to stocks, options and futures. If you're born to trade, we could be for you. See our Overview for more.
Past performance, whether actual or indicated by historical tests of strategies, is no guarantee of future performance or success. There is a possibility that you may sustain a loss equal to or greater than your entire investment regardless of which asset class you trade (equities, options or futures); therefore, you should not invest or risk money that you cannot afford to lose. Online trading is not suitable for all investors. View the document titled Characteristics and Risks of Standardized Options at www.TradeStation.com . Before trading any asset class, customers must read the relevant risk disclosure statements on www.TradeStation.com . System access and trade placement and execution may be delayed or fail due to market volatility and volume, quote delays, system and software errors, Internet traffic, outages and other factors.
Securities and futures trading is offered to self-directed customers by TradeStation Securities, Inc., a broker-dealer registered with the Securities and Exchange Commission and a futures commission merchant licensed with the Commodity Futures Trading Commission). TradeStation Securities is a member of the Financial Industry Regulatory Authority, the National Futures Association, and a number of exchanges.
TradeStation Securities, Inc. and TradeStation Technologies, Inc. are each wholly owned subsidiaries of TradeStation Group, Inc., both operating, and providing products and services, under the TradeStation brand and trademark. When applying for, or purchasing, accounts, subscriptions, products and services, it is important that you know which company you will be dealing with. Visit www.TradeStation.com for further important information explaining what this means.

LTC - GREAT Potential : ALT for 2026Hello Traders 📈
LTC / Litecoin may still present great opportunities for 2026.
From a bigger perspective, it may seem like LTC doesn't move much. But if we zoom in, we see massive bounces over the course of 3-4 weeks which presents big opportunities if you can buy in low:
From a technical indicator perspective, in the 4h LTC is still trading UNDER< showing that bears are still in control:
In the daily, we still see the same story however there seems to be a bullish W pattern appearing. As soon as the price reclaims the MA in the DAILY timeframe , that would be the first positive indicator of more upside:
For the short term, we need to see LTC trade ABOVE ALL the 4h moving averages in order to begin anticipating a bigger move up.

$TOTAL Crypto Market Cap DANGER ZONESame same, but different.
Crypto CRYPTOCAP:TOTAL Market Cap is still indecisive...
playing with fire within the DANGER ZONE 🔥
Bulls need back above the 20WMA and .236 fib ASAP
Clock is ticking 🕘

$GOLD 2nd Bearish Weekly CloseTVC:GOLD prints its 2nd consecutive bearish candle on the Weekly Close 🛎️
PA respected my boundaries and closed just above the DANGER ZONE ⚠️
Note the test of the WEMA9 & .382 Fib 🤓
I very much expect this next Weekly Close to be well within the danger zone borders.

EUR/AUD downside pressure intensifiesEUR/AUD finds itself just above a key zone consisting of horizontal support at 1.7600 and the key 200-day moving average, providing decent two-way trade setups depending on how the near-term price action evolves.
Should we see a break and close beneath both levels, it would allow for shorts to be established below the 200DMA with a stop above for protection, targeting 1.7465 or 1.7400 initially depending on desired risk/reward from the trade. The option would also be there to sell the break should we see a close beneath 1.7600, allowing for a stop to be placed above targeting the same levels. However, consider squaring or even flipping the trade should the price be unable to break beneath the 200DMA.
Should the price continue to hold above 1.7600, you could flip the setup and establish longs, allowing for a stop to be placed beneath the 200DMA for protection. 1.7726 or the intersection of the 50DMA with horizontal resistance at 1.7800 screen as logical targets.
Momentum indicators favour downside over upside, increasing the appeal of bearish setups. RSI (14) is trending lower beneath 50, pointing to building downside pressure. MACD has confirmed the bearish message, crossing the signal line from above before pushing into negative territory.
Good luck!
DS

FLNC 1D – The power comeback!On the daily chart, Fluence Energy (FLNC) shows a clean cup and handle formation followed by a golden cross (MA50 crossing above MA200) - a textbook bullish reversal setup.
Price broke out of the structure and is now pulling back into the buy zone ($14.57–$16.80) - a confluence of Fibonacci support and previous resistance.
✅ Golden cross confirms trend reversal
✅ Rising volume supports the move
✅ MAs below price - bulls are in control
The first target sits near $27.43, while the second projection extends to $40.28 if momentum continues.
Fundamentally, Fluence remains a leader in energy storage and grid technology - a hot spot for global investment as the renewable sector accelerates.
Let’s just say - this chart looks fully charged ⚡️

DIS Falling WedgeDis rallied from April '25 until July '25 and then consolidated around $120, forming a bullish falling wedge. The red line is the 200-day moving average which is acting as support at $110. It has been bounced off twice. The seasonals look bullish going into the last 2 months of the year when considering 2023 and 2024 price movement. The P/E ratio is 17.66 which is almost a 3rd of its 2-year moving average which is 47.43, indicating a low valuation with lots of room for upside. The aqua line is the 50-day sma which needs to be closed beyond along with the top side of the rising wedge before this thing can really take off. Fundamentals look bullish as well, with an uptrend in annual revenue growth and downtrend in debt/equity.

LCI LongThe primary long-term trend remains bullish, as the 200-day SMA (black line) is sloping upward and price has taken support from it..
RSI suggests weak momentum, close to the oversold zone, hinting at possible short-term rebound potential.
In my view, stock broke the trendline yesterday and today, it tried to break above it but couldn't succeed. If it breaks it next week, it will be a very positive signal.
The stock seems to be bouncing from support. A decisive daily close above 310–316 would be the first bullish signal of trend reversal.
If the price holds above 300 and closes above 316–320, momentum could turn positive.
Upside targets: 330 → 363 → 392.

Getty Images | GETY | Long at $2.29Bull Thesis
Data is "knowledge" for AI.
Getty Images NYSE:GETY holds immense importance in the generative AI race due to its control over a vast, high-quality library of over 500 million licensed images and metadata.
By licensing content (e.g., via deals with Nvidia), NYSE:GETY monetizes its assets, promotes responsible AI, and challenges open-source models.
Standardized license deals will boost AI's commercial viability and prevent a "wild west" of IP theft, ultimately accelerating safe deployment in industries like advertising and media.
The merger with Shutterstock will only help NYSE:GETY be the ultimate leader in this licensed data space.
Bear Thesis
The "wild west" of IP theft continues for years and the company's debt / poor fundamentals build until and ultimate collapse or acquisition.
Action
The bull thesis makes the most sense given the amount of data NYSE:GETY has and the future of data licensing deals. Now, I would love the price to go lower to accumulate more shares (under $2 is not out of the question in the near-term). But, at $2.29, NYSE:GETY is in a personal buy zone, and a starter position was made. More shares will be gathered in the $1 range if the earnings and revenue growth projections continue to look promising beyond 2025: www.tradingview.com
Targets into 2028:
$3.07 (+34.1%)
$5.00 (+118.3%)

Sequent is about to give breakoutSequent is about to give breakout of reverse head and shoulder pattern, SL should be day's low

#ZECUSDT #1D (ByBit) Rising wedge near breakdownZcash had a great bull run but looks exhausted right now on daily TF.
It's printing a bearish divergence between price and volume + RSI, a retracement seems likely.
⚡️⚡️ #ZEC/USDT ⚡️⚡️
Exchanges: Bitget Futures
Signal Type: Regular (Short)
Leverage: Isolated (3.0X)
Amount: 3.9%
Current Price:
353.99
Entry Zone:
355.71 - 392.39
Take-Profit Targets:
1) 298.48
2) 241.58
3) 184.67
Stop Targets:
1) 437.28
Published By: @Zblaba
CRYPTOCAP:ZEC BYBIT:ZECUSDT.P #1D #Zcash #Privacy z.cash
Risk/Reward= 1:1.2 | 1:2.1 | 1:3.0
Expected Profit= +60.6% | +106.2% | +151.9%
Possible Loss= -50.7%
Estimated Gaintime= 1-2 months

BTCUSD Bearish📉 BTCUSD Short Setup
EMA rejection
Trendline break
Structure shift to the downside
1H bearish engulfing confirmation

EURUSD Bearish📉 EURUSD Short Setup
EMA rejection
Trendline break & retest
Structure shift to the downside
15-min bearish engulfing confirmation
