#BTCEUR #1D (Binance) Bull-flag breakout and retestBitcoin looks very good for bullish continuation after regaining 50MA support on daily, against the Euro.
⚡️⚡️ #BTC/EUR ⚡️⚡️
Exchanges: Binance
Signal Type: Regular (Long)
Amount: 12.0%
Entry Targets:
1) 93017.86
Take-Profit Targets:
1) 108422.28
Stop Targets:
1) 85296.36
Published By: @Zblaba
CRYPTOCAP:BTC BINANCE:BTCEUR #Bitcoin #PoW bitcoin.org
Risk/Reward= 1:2.0
Expected Profit= +16.6%
Possible Loss= -8.3%
Estimated Gaintime= 1-2 months
Moving Averages

VIOLENT BOS on SILVER takes place! HOW FAR it goes this time?!?This is where momentum strategys eventually lead to...

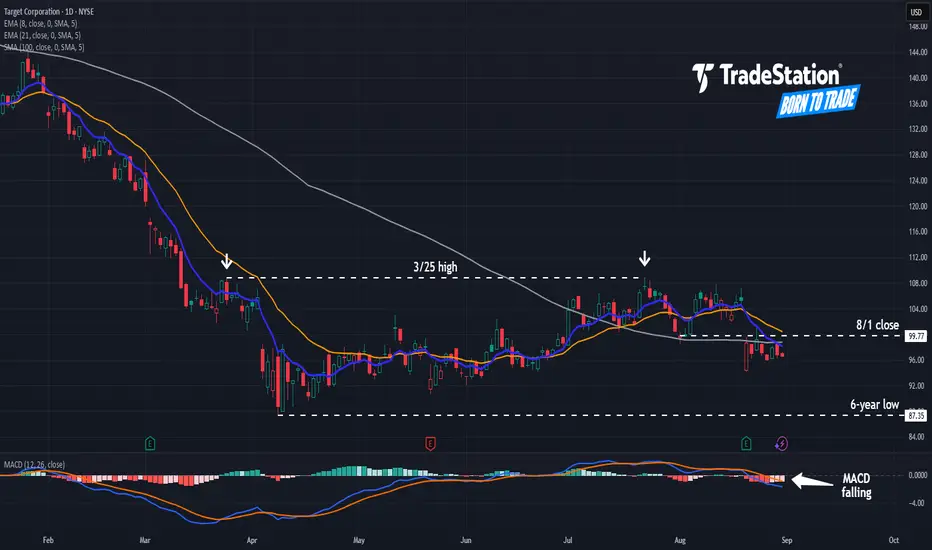
Target: Potential Downtrend ContinuationTarget has struggled all year, and some traders may see further downside in the big-box retailer.
The first pattern on today’s chart is the March 25 weekly high of $108.76. TGT probed that level in mid-July before dipping, which may confirm resistance is in place.
Second is August 1’s weekly close of $99.77. A weak quarterly report drove prices under that level last week and they’ve stayed there since.
Third, MACD is falling and the 8-day exponential moving average (EMA) is below the 21-day EMA. Those signals may be consistent with a bearish short-term trend.
Fourth, the stock is back below its falling 100-day simple moving average. That may be consistent with a bearish long-term trend.
Finally, TGT is an active underlier in the options market. It’s averaged about 90,000 contracts per session in the last month, according to TradeStation data. That may help traders take positions with calls and puts.
TradeStation has, for decades, advanced the trading industry, providing access to stocks, options and futures. If you're born to trade, we could be for you. See our Overview for more.
Past performance, whether actual or indicated by historical tests of strategies, is no guarantee of future performance or success. There is a possibility that you may sustain a loss equal to or greater than your entire investment regardless of which asset class you trade (equities, options or futures); therefore, you should not invest or risk money that you cannot afford to lose. Online trading is not suitable for all investors. View the document titled Characteristics and Risks of Standardized Options at www.TradeStation.com . Before trading any asset class, customers must read the relevant risk disclosure statements on www.TradeStation.com . System access and trade placement and execution may be delayed or fail due to market volatility and volume, quote delays, system and software errors, Internet traffic, outages and other factors.
Securities and futures trading is offered to self-directed customers by TradeStation Securities, Inc., a broker-dealer registered with the Securities and Exchange Commission and a futures commission merchant licensed with the Commodity Futures Trading Commission). TradeStation Securities is a member of the Financial Industry Regulatory Authority, the National Futures Association, and a number of exchanges.
Options trading is not suitable for all investors. Your TradeStation Securities’ account application to trade options will be considered and approved or disapproved based on all relevant factors, including your trading experience. See www.TradeStation.com . Visit www.TradeStation.com for full details on the costs and fees associated with options.
Margin trading involves risks, and it is important that you fully understand those risks before trading on margin. The Margin Disclosure Statement outlines many of those risks, including that you can lose more funds than you deposit in your margin account; your brokerage firm can force the sale of securities in your account; your brokerage firm can sell your securities without contacting you; and you are not entitled to an extension of time on a margin call. Review the Margin Disclosure Statement at www.TradeStation.com .
TradeStation Securities, Inc. and TradeStation Technologies, Inc. are each wholly owned subsidiaries of TradeStation Group, Inc., both operating, and providing products and services, under the TradeStation brand and trademark. When applying for, or purchasing, accounts, subscriptions, products and services, it is important that you know which company you will be dealing with. Visit www.TradeStation.com for further important information explaining what this means.
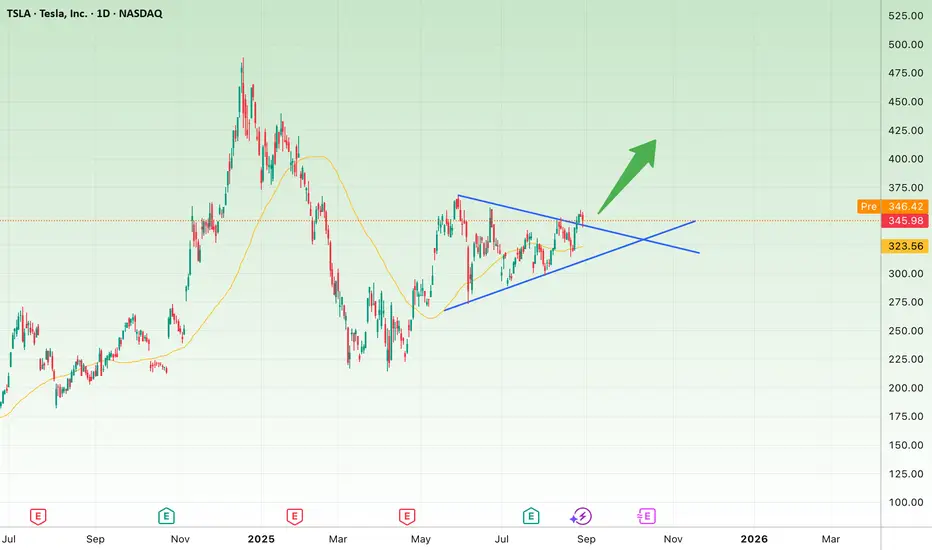
Tesla (TSLA) Breaking Out – Is the Next Bull Run Starting?📊 TSLA Technical Analysis (Daily Timeframe)
After a period of consolidation inside a Symmetrical Triangle, Tesla’s price is now showing a potential breakout to the upside. This could be an early signal for the beginning of a new bullish wave.
🔹 Key Support: $323 – $325
🔹 Next Resistances: $375 and, if broken, higher targets at $400 – $420
The 50-day moving average is currently supporting the uptrend, and a confirmed close above the $346 level would strengthen the bullish outlook.
⚠️ However, if the price fails and breaks below $323, the bullish scenario may lose validity and a corrective move could follow.
$LINK Next Target $31Looks like I was right about my Chainlink call.
Go figure 🤓
CRYPTOCAP:LINK has closed the day above the 9EMA which is the first level you look to close above before the next leg up.
Notice it found support off the .618 Fib before the close.
$31 for the next target seems very likely, which was this cycle’s local high.

EUR/CHF: Eyeing .9400 as bullish setups emergeThursday’s bullish engulfing candle has seen EUR/CHF push back above the key 50DMA, a level that has consistently offered support and resistance over recent months with very few false breakouts. With the pair now testing horizontal resistance at .9363, a potential break of the downtrend it’s been sitting in since August 18 may be on the cards.
There are several bullish setups for traders to consider depending on desired risk-reward. Possible entry levels include around these levels or above the August 18 downtrend, allowing for a stop to be placed beneath the 50DMA for protection against reversal.
.9400 screens as an initial target given it provided support and resistance earlier this month. The 200DMA is located in between but, unlike its 50-day equivalent, the price often trades straight through it like it isn’t there. It’s therefore a level of note rather than anything else. A successful break above .9400 would open the door for a potential retest of the August 18 highs.
Momentum indicators are providing a neutral signal overall, putting greater emphasis on price action for directional cues.
Good luck!
DS

Natural Gas ( 30 Min EMA Cross over)I have taken this trade on a 30-minute chart frame. And used stop loss on the 4-hour chart. Because I don't want my trade to close because stop loss was too close.
The key factors that made me to take this trade.
1. The natural gas is bearish on longer daily and weekly trend.
2. i think the small crossover on 30 minute on the down side will help the cause.
3. Only worry here is that how long it pull backs into bullish direction, before it resumes its bearish bias. For that purpose, I have set up the stop loss on 2 hour time frame and above recent highs.
Should know the outcome of this trade next week.

KSH Holdings Limited | Chart & Forecast SummaryKey Indicators On Trade Set Up In General
1. Push Set Up
2. Range Set Up
3. Break & Retest Set Up
Notes On Session
# KSH Holdings Limited
- Double Formation
* (Diagonal Shift)) - *(A+)) - Long Entry - *50EMA | Subdivision 1
* (Short Cut Attitude)) | No Size Up - *Uptrend Area | Completed Survey
* 95 bars, 2891d | Date Range Method - *(Uptrend Argument))
- Triple Formation
* (P1)) / (P2)) & (P3)) | Subdivision 2
* Monthly Time Frame | Trend Settings Condition | Subdivision 3
- (Hypothesis On Entry Bias)) | Regular Settings
* Stop Loss Feature Varies Regarding To Main Entry And Can Occur Unevenly
- Position On A 1.5RR
* Stop Loss At 0.115 SGD
* Entry At 0.290 SGD
* Take Profit At 0.565 SGD
* (Uptrend Argument)) & No Pattern Confirmation
- Continuation Pattern | Not Valid
- Reversal Pattern | Not Valid
* Ongoing Entry & (Neutral Area))
Active Sessions On Relevant Range & Elemented Probabilities;
European-Session(Upwards) - East Coast-Session(Downwards) - Asian-Session(Ranging)
Conclusion | Trade Plan Execution & Risk Management On Demand;
Overall Consensus | Buy

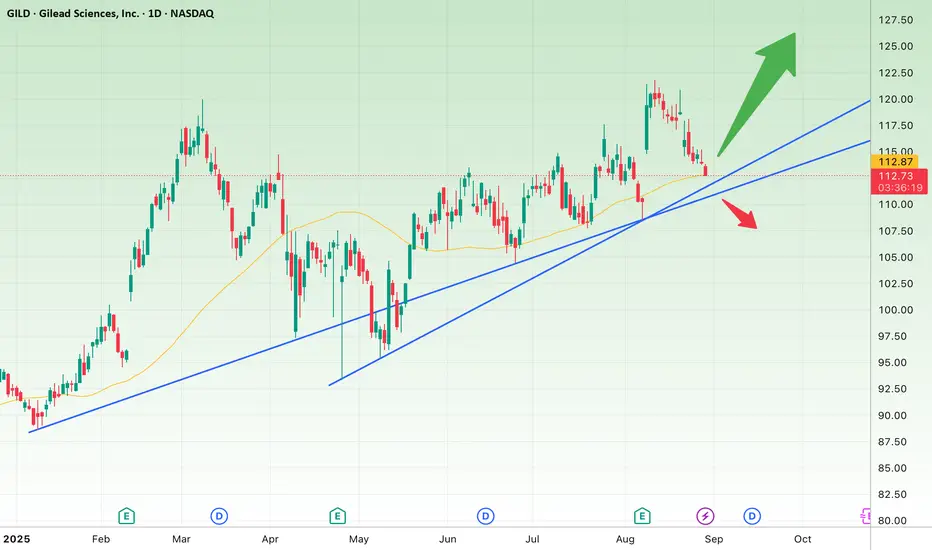
GILD at a Key Decision Zone!📊 Technical Analysis of GILD (NASDAQ)
After a strong rally since the beginning of the year, the price is now testing a major ascending trendline support around $112 – $110.
✅ If the support holds and the price rebounds, we could see continuation towards the next resistance levels at $118 and $125.
❌ However, a breakdown below $110 with confirmation may trigger a deeper correction, opening the way towards $105 and potentially $98.
🔹 The reaction to this critical support zone will determine the next major move for GILD.
Crypto Investing in 2025: Advanzia Group’s Safe Profit TacticsThe cryptocurrency market in 2025 continues to impress with its momentum, innovation, and—most importantly—its earning potential. Despite high volatility, crypto remains one of the most profitable investment instruments. However, more and more investors are seeking balanced strategies that allow them to earn with minimal risk.
In this article, Advanzia Group experts share practical strategies that have proven effective throughout 2025.
Why Is Crypto Still Attractive?
In 2025, the total crypto market capitalization surpassed $4 trillion, and the number of active users reached 500 million. This is no longer a niche market—it's a full-fledged financial sector with massive potential.
Key growth drivers:
A successful Bitcoin halving in 2024 triggered a new bull cycle
Mass adoption of blockchain in traditional finance
Expansion of decentralized platforms (DeFi), stablecoins, and Web3 infrastructure
Entry of institutional investors deploying billions
Bottom line: the crypto market is maturing, but still offers high returns when paired with smart risk-management strategies.
Strategy #1: Staking — Passive Income Without Trading
What it is: Locking up crypto on a Proof-of-Stake blockchain to support the network and earn rewards.
Example coins: Ethereum (ETH), Solana (SOL), Polkadot (DOT), Cardano (ADA)
Average returns in 2025:
Ethereum — ~4.5% APY
Solana — ~7%
DOT & ADA — up to 10%
Why it’s low-risk: You’re not selling your asset or trading based on market fluctuations — your crypto works for you.
Tip from Advanzia Group: Use reputable platforms and diversify across several assets.
Strategy #2: Long-Term Holding (HODL)
What it is: Buying promising cryptocurrencies and holding them for 1–3 years.
Top assets to consider in 2025:
Bitcoin (BTC) — the institutional-grade foundation asset
Ethereum (ETH) — core of the DeFi and NFT ecosystems
Avalanche (AVAX), Arbitrum (ARB), Chainlink (LINK) — strong tech-driven projects
Performance example:
An Advanzia Group investor who bought Ethereum at $1,600 in January 2025 saw a 120% return by August—without making a single trade.
Strategy #3: Smart Asset Allocation
How it works:
60% — large-cap coins (BTC, ETH, SOL)
20% — high-potential altcoins
20% — stablecoins (USDT, USDC) for liquidity and downside protection
This type of portfolio reduces drawdown risk while capturing market upside.
Tip: Rebalance your portfolio monthly. In 2025, market leaders can lose 50% in weeks—constant adjustment is key.
Strategy #4: Investing in DeFi Platforms
How DeFi earns you money:
Liquidity farming
Lending protocols
Algorithmic asset strategies
Example:
Platforms like Aave, Compound, Lido, and GMX offer 8–15% APY in stablecoins with relatively low volatility.
Important: Always review smart contract security. Advanzia Group monitors DeFi projects to select only trusted protocols.
What Should Beginners Avoid?
Going all-in on a single coin — even the most promising asset carries risk
Margin trading & futures — high reward comes with high risk
Unverified tokens & pump schemes — hype can lead to major losses
Lack of strategy — investing is not gambling; it requires planning and analysis
How Investors Are Really Making Money in 2025
On the Advanzia Group platform in the first 8 months of 2025:
74% of clients achieved positive returns
38% grew their capital by over 60%
The most successful approach: a combination of HODL + Staking + DeFi, with regular rebalancing
Case example:
An investor allocated $10,000 in January using Advanzia’s recommended strategy. By August, the portfolio reached $21,800—a +118% return with low risk and no active trading.
Why Investing with Advanzia Group Is a Smart Choice
Personalized investment plans based on market analytics
Support in selecting secure DeFi protocols
Reliable analytics and full transparency
Automation tools (stop-losses, alerts, portfolio rebalancing)
Conclusion
In 2025, crypto investing is no longer just for speculators. With the right technology and strategies—available through Advanzia Group—earning in the crypto market is possible even with minimal risk. Investors succeed when they think strategically, apply balanced approaches, and partner with professionals

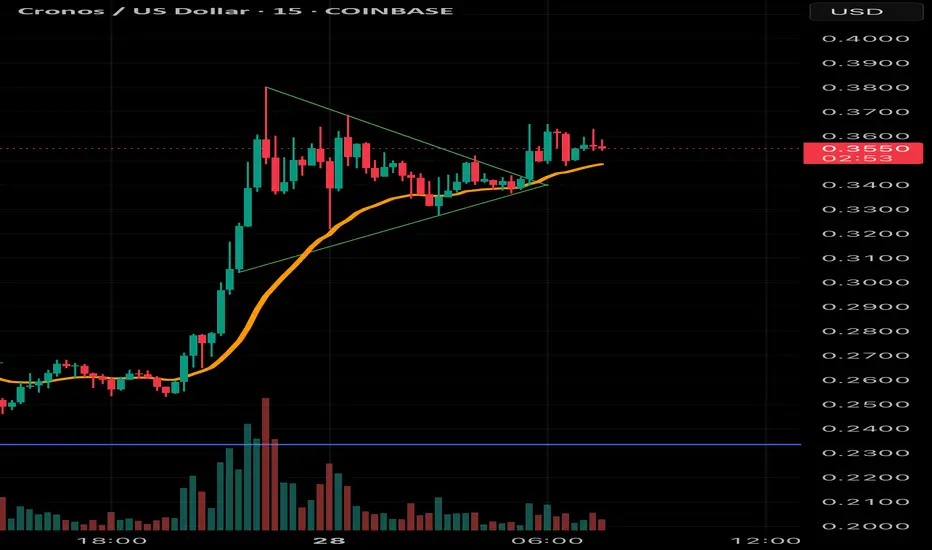
Hitting new recent highs breaking out of a pennant consolidationCRO seems prime for another leg up. After a few days of strong upside it’s running into resistance on the weekly chart, but even though it is at a current high, not all-time I’ll add, CRO still has significant upside potential .
CRO is consolidating strongly after breaking out of a pennant consolidation - on all charts 4-hour and under it can be seen, you will not see it on the daily. The resistance it encounters now traces back to November 2021 through April 2022 — on the weekly its more easily seen.
I am not an investment adviser, and this is NOT investment advice. Crypto is very volatile and you could lose your shirt if you listen to what I’m saying or think I’m advising you to buy. However, since transparency is key, after taking a nice profit yesterday doing an 1-hour trade, and then deeper analysis I’ve personally invested $$$ tens of thousands at this level based on my analysis of the trend continuation.
DO NOT BUY CRO unless you are prepared to lose money. I have a much higher risk tolerance than most and this could be a dangerous, losing trade, but I do feel it will be a real nice win today . If you follow me and my advice and you lose, it’s your fault not mine. Oh also, if you buy and it starts going up, the minute you get that feeling “I’m going to be rich”… SELL right away and take your damn profit!
DDP 👊🏼👊🏼☝🏼🙏🏼
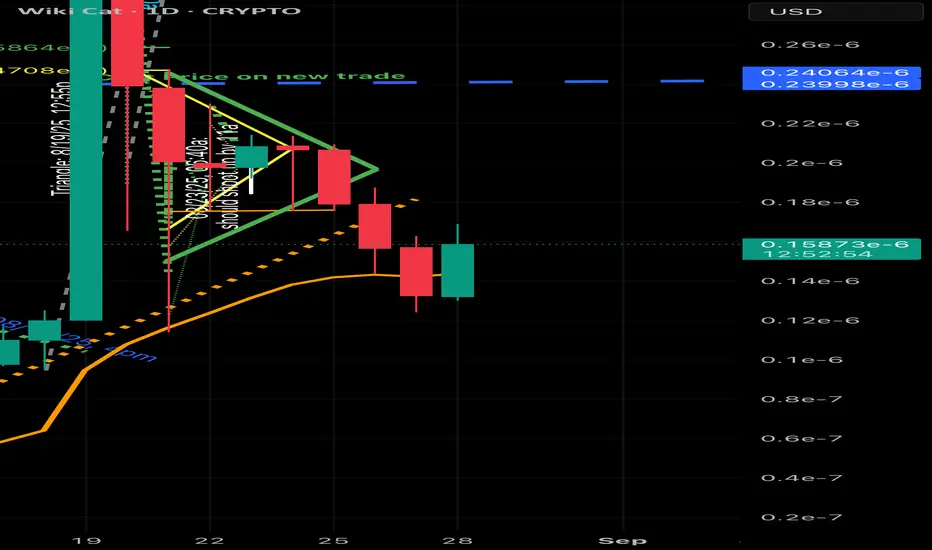
Time to start looking for an entry?Watch closely. Daily candle closed under the 21 day moving average. Then popped back up today with a green engulfing candle in the daily chart.
Wiki needs to close over the MA to confirm but does look like Wiki is doing so now. Seems like a good point to enter this trade, however, without a green candle close above the 21-day MA and preferably a 2nd daily green confirmation candle above, I would be cautious to commit to this one. Wiki moves fast so keep an eye on it. Last time it did a similar formation it shot up.
This is NOT investment advice and you could lose your shirt if you listen to what I say!
GOLD BUY OPPORTUNITYGold broke the 4H Trendline and is now retracing
It is not financial advice, but it is worth trying.
The picture is clear
Good luck

DAX: 50DMA break puts downside levels in playThe Germany 40 contract is trading through the 50-day simple moving average, a level that’s been tested frequently over the past month but never closed below until Wednesday. Should the price be unable to reclaim the level, a short setup may be in order.
While some may be prepared to establish shorts beneath the 50DMA with a tight stop above for protection, the preference would be to see the price push meaningfully below 24000 given how many times it bounced from beneath the level when trading above the 50DMA over the past month.
Bids may be found at 23800 and again at 23620, the latter coinciding with the uptrend running from the June swing low. Ultimately, however, 23400 screens as a more appealing target given it’s where the price bounced strongly from earlier this month.
Of course, if the price were to reverse back above the 50DMA and close there, the setup could be flipped with longs established above and a stop beneath for protection. The downtrend from the record highs set on July 10 sits just beneath 24400 today, making that a potential target. 24530 is another, coinciding with where the price stalled on four separate occasions since July 23.
RSI (14) is trending lower and now sits beneath 50, providing a slightly bearish signal. However, it’s yet to be confirmed by MACD, which remains in positive territory despite crossing over from above earlier this week. The overall momentum signal is therefore neutral, placing more emphasis on price action to guide trading decisions.
Good luck!
DS

Gold (XAU/USD) Technical Analysis – Daily Timeframe🔹 The chart shows the formation of a symmetrical triangle. Price is consolidating within a tight range, indicating a potential breakout soon.
✅ Bullish Scenario:
• Break and close above the 3400–3420 zone
• Targets: 3600, followed by 3700–3800 USD
❌ Bearish Scenario:
• Break below the triangle support around 3300
• Corrective targets: 3200, followed by 3000 USD
📌 The 50-day moving average is positioned below the current price, acting as a dynamic support, which increases the likelihood of a strong bullish breakout.

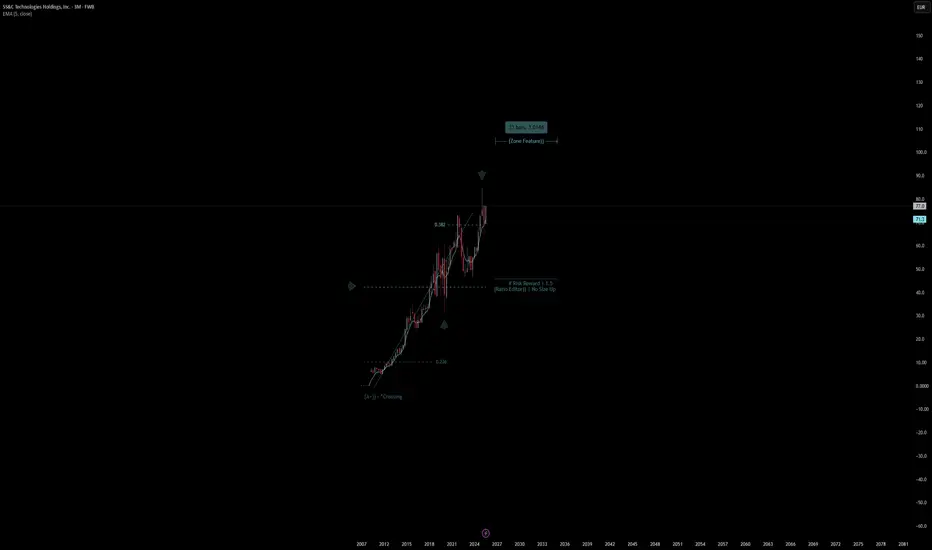
SS&C Technologies Holdings, Inc. | Chart & Forecast SummaryKey Indicators On Trade Set Up In General
1. Push Set Up
2. Range Set Up
3. Break & Retest Set Up
Notes On Session
# SS&C Technologies Holdings, Inc
- Double Formation
* (A+)) - *Crossing - Long Entry - *5EMA | Subdivision 1
* (Ratio Editor)) | No Size Up - *Uptrend Area | Completed Survey
* 33 bars, 3014d | Date Range Method - *(Uptrend Argument))
- Triple Formation
* (P1)) / (P2)) & (P3)) | Subdivision 2
* 3 Monthly Time Frame | Trend Settings Condition | Subdivision 3
- (Hypothesis On Entry Bias)) | Regular Settings
* Stop Loss Feature Varies Regarding To Main Entry And Can Occur Unevenly
- Position On A 1.5RR
* Stop Loss At 48.00 EUR
* Entry At 66.00 EUR
* Take Profit At 91.00 EUR
* (Uptrend Argument)) & No Pattern Confirmation
- Continuation Pattern | Not Valid
- Reversal Pattern | Not Valid
* Ongoing Entry & (Neutral Area))
Active Sessions On Relevant Range & Elemented Probabilities;
European-Session(Upwards) - East Coast-Session(Downwards) - Asian-Session(Ranging)
Conclusion | Trade Plan Execution & Risk Management On Demand;
Overall Consensus | Buy
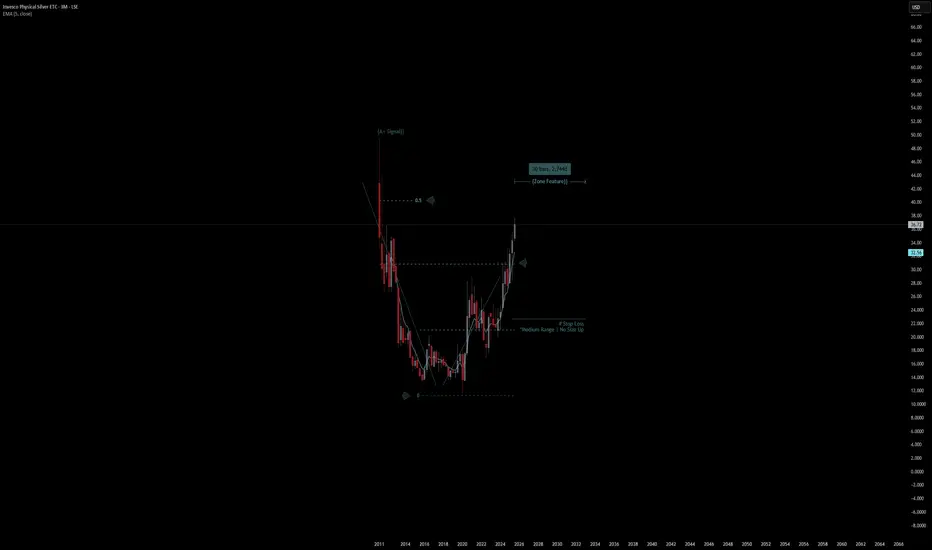
Invesco Physical Silver ETC | Chart & Forecast SummaryKey Indicators On Trade Set Up In General
1. Push Set Up
2. Range Set Up
3. Break & Retest Set Up
Notes On Session
# Invesco Physical Silver ETC
- Double Formation
* (A+ SIgnal)) - Short Entry - *5EMA | Subdivision 1
* Medium Range | No Size Up - *Reversal Area | Completed Survey
* 30bars, 2744d | Date Range Method - *(Uptrend Argument))
- Triple Formation
* (P1)) / (P2)) & (P3)) | Subdivision 2
* 3 Monthly Time Frame | Trend Settings Condition | Subdivision 3
- (Hypothesis On Entry Bias)) | Regular Settings
* Stop Loss Feature Varies Regarding To Main Entry And Can Occur Unevenly
- Position On A 1.5RR
* Stop Loss At 25.00 USD
* Entry At 33.00 USD
* Take Profit At 45.00 USD
* (Uptrend Argument)) & No Pattern Confirmation
- Continuation Pattern | Not Valid
- Reversal Pattern | Not Valid
* Ongoing Entry & (Neutral Area))
Active Sessions On Relevant Range & Elemented Probabilities;
European-Session(Upwards) - East Coast-Session(Downwards) - Asian-Session(Ranging)
Conclusion | Trade Plan Execution & Risk Management On Demand;
Overall Consensus | Buy
Dow Jones Breaks Out of Inverse Head & Shoulders, Eyeing FurtherThe Dow Jones Index has confirmed a breakout from the classic Inverse Head and Shoulders pattern, signaling a potential trend reversal to the upside. The neckline breakout, supported by rising trading volumes, adds strength to the bullish outlook and paves the way for a more sustained upward move. If the index holds above this key level, further capital inflows could drive the Dow toward higher targets in the medium term.

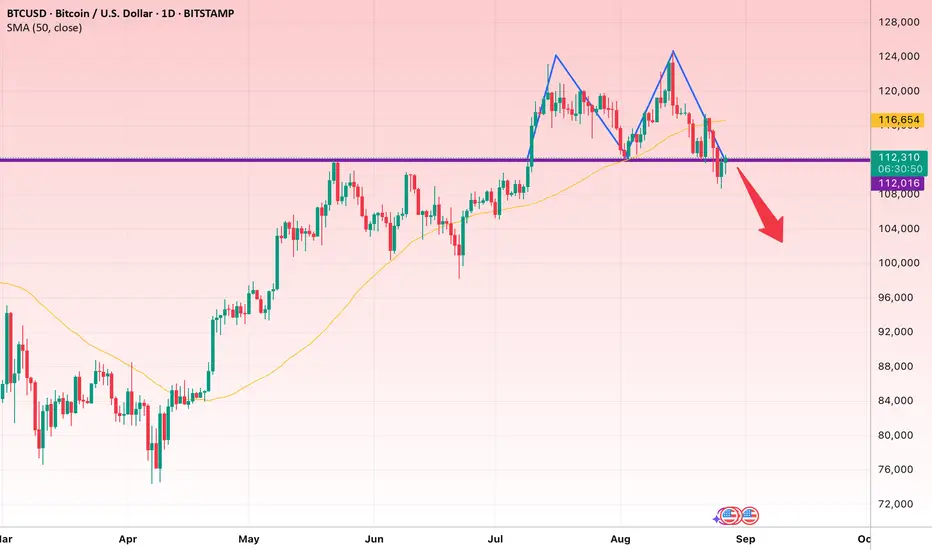
Bitcoin Signals Deeper Correction as Double Top FormsBitcoin has broken below its 50-day moving average, signaling weakening bullish momentum in the short term. At the same time, the emergence of a classic Double Top pattern near a key resistance zone has intensified selling pressure, raising the likelihood of further downside. If upcoming support levels fail to hold, Bitcoin could enter a deeper corrective phase and potentially face a prolonged consolidation period.
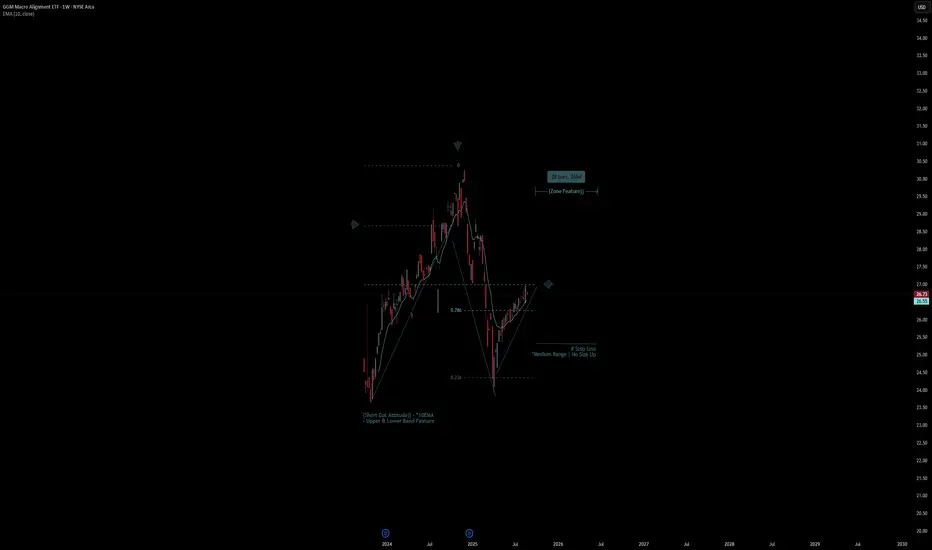
GGM Macro Alignment ETF | Chart & Forecast SummaryKey Indicators On Trade Set Up In General
1. Push Set Up
2. Range Set Up
3. Break & Retest Set Up
Notes On Session
# GGM Macro Alignment ETF
- Double Formation
* Upper & Lower Band Feature - Long Entry - *10EMA | Subdivision 1
* Medium Range | No Size Up - *Retest Area | Completed Survey
* 40bars, 280d | Date Range Method - *(Uptrend Argument))
- Triple Formation
* (P1)) / (P2)) & (P3)) | Subdivision 2
* Weekly Time Frame | Trend Settings Condition | Subdivision 3
- (Hypothesis On Entry Bias)) | Regular Settings
* Stop Loss Feature Varies Regarding To Main Entry And Can Occur Unevenly
- Position On A 1.5RR
* Stop Loss At 25.00 USD
* Entry At 26.00 USD
* Take Profit At 28.00 USD
* (Uptrend Argument)) & No Pattern Confirmation
- Continuation Pattern | Not Valid
- Reversal Pattern | Not Valid
* Ongoing Entry & (Neutral Area))
Active Sessions On Relevant Range & Elemented Probabilities;
European-Session(Upwards) - East Coast-Session(Downwards) - Asian-Session(Ranging)
Conclusion | Trade Plan Execution & Risk Management On Demand;
Overall Consensus | Buy
Truist: Potential BreakoutTruist Financial spent almost two months consolidating, but now some traders may think the regional bank is starting a new uptrend.
The first pattern on today’s chart is the March 24 closing price of $42.15, its peak before "Liberation Day." TFC crossed that level in late June and pulled back to hold it on August 1. That may suggest old resistance has become new support.
Second, the 50-day simple moving average (SMA) had a “golden cross” above the 200-day SMA in mid-August. That may suggest its long-term trend is getting more bullish.
Third, the 8-day exponential moving average (EMA) is above the 21-day EMA. MACD is also rising. Those patterns may reflect short-term bullishness.
Finally, TFC ended yesterday above its recent closing high from July 27. It also had a bullish outside candle. Has a breakout begun?
TradeStation has, for decades, advanced the trading industry, providing access to stocks, options and futures. If you're born to trade, we could be for you. See our Overview for more.
Past performance, whether actual or indicated by historical tests of strategies, is no guarantee of future performance or success. There is a possibility that you may sustain a loss equal to or greater than your entire investment regardless of which asset class you trade (equities, options or futures); therefore, you should not invest or risk money that you cannot afford to lose. Online trading is not suitable for all investors. View the document titled Characteristics and Risks of Standardized Options at www.TradeStation.com . Before trading any asset class, customers must read the relevant risk disclosure statements on www.TradeStation.com . System access and trade placement and execution may be delayed or fail due to market volatility and volume, quote delays, system and software errors, Internet traffic, outages and other factors.
Securities and futures trading is offered to self-directed customers by TradeStation Securities, Inc., a broker-dealer registered with the Securities and Exchange Commission and a futures commission merchant licensed with the Commodity Futures Trading Commission). TradeStation Securities is a member of the Financial Industry Regulatory Authority, the National Futures Association, and a number of exchanges.
TradeStation Securities, Inc. and TradeStation Technologies, Inc. are each wholly owned subsidiaries of TradeStation Group, Inc., both operating, and providing products and services, under the TradeStation brand and trademark. When applying for, or purchasing, accounts, subscriptions, products and services, it is important that you know which company you will be dealing with. Visit www.TradeStation.com for further important information explaining what this means.

TSLA (swingtrade) Bull flag1. Pattern : Bull flag breakout
2. retest: done
3. sma 50 on hold in D1,W
* could fake break out alway stoploss

$BTC Has Entered the DANGER ZONEI warned ya’ll about this ₿itcoin correction on the 15th when that big bearish engulfing candle printed.
CRYPTOCAP:BTC has now officially entered the DANGER ZONE with a break below the 100DMA, 0.236 Fib and previous local high territory.
If PA breaks even further, next stop is the 0.382 Fib ~$105k and possibly the 200DMA ~$101k
