Long Setup: Darphane Gold Certificate Targeting 110.24I am looking at the Daily chart for **DARPHANE ALTIN SERTIFIKASI (BIST:ALTIN)**. The asset has been in a sustained uptrend since October. Currently, the price is reacting to the Simple Moving Average (SMA), which is acting as a dynamic support level around **85.39**. We are seeing a bounce from this zone, with the price currently trading at **88.27**.
The trend structure remains bullish as long as the price holds above the SMA and the key horizontal support structure. The ATR (Average True Range) is sitting at **4.74**, indicating there is enough volatility to support a move toward the target.
I am projecting a continuation of the bullish momentum toward new highs.
Direction: Long
Target (Take Profit): 110.24 (Upper Green Zone).
Stop Loss: 69.33 (Lower Red Zone). This is placed conservatively below the major horizontal support line visible at **74.10** to allow breathing room for volatility.
* ****
If the price breaks below the 74.10 support and the SMA, this bullish thesis would be invalidated.
Moving Averages

Apollo Hospital- Short setupQuick summary
Price trading below the EMAs with a prior pivot low recently breached and a visible zone of confluence aligning with daily EMAs. Momentum looks bearish while price remains under EMA21/EMA50 on daily.
Key details
- Structure: Prior pivot low breached; lower highs forming
- Confluence: Zone aligns with daily EMAs — important supply/resistance area
- Bias: Bearish while price stays below the EMAs; bullish invalidation if price reclaims and closes above them
- Treat the confluence zone as a high‑attention area for entries or rejections.
- Use a clearly defined stop and position sizing consistent with your risk rules.
- Look for confirmation (rejection wick, bearish engulfing, or momentum divergence) before committing.
- If price reclaims the EMAs with conviction, reassess bias and avoid shorting into strength.

Kpit Technologies – Short SetupThis chart outlines a potential short setup based on price action and moving average dynamics.
A higher timeframe supply zone is identified near 1220, with price currently trading below both the 21 EMA and 50 EMA indicating bearish momentum.
Setup Highlights:
- Structure Break: Prior pivot low breached, signaling potential trend shift.
- Retest Zone: Area between 21 EMA and 50 EMA may act as rejection zone.
- Stop Loss Reference: SL aligned with 15% of Daily ATR
- Invalidation Criteria: No entry if price dips below 1060 and rebounds.
- Risk-Reward: Target set at 1:3 for disciplined trade management.


Is BP Starting to Rise?BP has been quiet as other majors like Exxon Mobil and Chevron have rallied, and now the London-based energy giant may be starting to climb.
The first pattern on today’s chart is the July 29 closing price of $32.96. BP tested and held that level in October, which may suggest old resistance has become new support.
Second, prices have made incrementally higher lows since. That may indicate a new uptrend is trying to emerge.
Third, the 50-day simple moving average (SMA) had a “Golden Cross” above the 200-day SMA in late July. The 100-day SMA followed in September. That alignment, with faster SMAs above slower SMAs, may suggest longer-term direction is turning upward.
Next, the 8-day exponential moving average (EMA) has crossed above the 21-day EMA. MACD is also rising. Those signals may be consistent with a short-term uptrend.
TradeStation has, for decades, advanced the trading industry, providing access to stocks, options and futures. If you're born to trade, we could be for you. See our Overview for more.
Past performance, whether actual or indicated by historical tests of strategies, is no guarantee of future performance or success. There is a possibility that you may sustain a loss equal to or greater than your entire investment regardless of which asset class you trade (equities, options or futures); therefore, you should not invest or risk money that you cannot afford to lose. Online trading is not suitable for all investors. View the document titled Characteristics and Risks of Standardized Options at www.TradeStation.com . Before trading any asset class, customers must read the relevant risk disclosure statements on www.TradeStation.com . System access and trade placement and execution may be delayed or fail due to market volatility and volume, quote delays, system and software errors, Internet traffic, outages and other factors.
Securities and futures trading is offered to self-directed customers by TradeStation Securities, Inc., a broker-dealer registered with the Securities and Exchange Commission and a futures commission merchant licensed with the Commodity Futures Trading Commission). TradeStation Securities is a member of the Financial Industry Regulatory Authority, the National Futures Association, and a number of exchanges.
TradeStation Securities, Inc. and TradeStation Technologies, Inc. are each wholly owned subsidiaries of TradeStation Group, Inc., both operating, and providing products and services, under the TradeStation brand and trademark. When applying for, or purchasing, accounts, subscriptions, products and services, it is important that you know which company you will be dealing with. Visit www.TradeStation.com for further important information explaining what this means.

The Ultimate Guide to Moving AveragesYo, crypto fam! 😎
Moving averages are a bit like your car’s rear-view mirror — they won’t tell you what’s about to happen, but they’re great at showing you where you’ve been. Whether you’re a seasoned pro or just starting out, understanding how MAs work can give you the edge in identifying trends and making smarter trades. But like anything in trading, they come with their nuances. Let’s dive into the core of moving averages: lag, trend, and perception .
The Lag of Moving Averages
First things first — moving averages lag. Simple as that. They’re lagging indicators by design because they’re built on past price data. A moving average doesn’t predict where price is going; it just smooths out historical moves so the trend is easier to read.
Whether you’re using a simple moving average (SMA) or an exponential moving average (EMA), both are doing price smoothing — cutting through noise, not forecasting the future. The difference is speed. An SMA averages a fixed set of past prices, which makes it slower when the market snaps or flips fast. An EMA gives more weight to recent candles, so it reacts quicker — but it still lags behind real-time price action.
Moving Averages and Trends
Moving averages are trend indicators, plain and simple. They help you see where the market is actually heading by filtering out the noise and focusing on the bigger move. If price is holding above the moving average, you’re dealing with an uptrend. If it’s stuck below, that’s a downtrend. 📊
But here’s the catch: how well moving averages work depends a lot on market conditions. In clean, trending markets, moving averages trend like champs. They help you stay in trades longer and often act as dynamic support or resistance while price pulls back and pushes higher or lower. In sideways or choppy markets, though, they start to betray you — price keeps slicing through the MA, crossovers pile up, and false signals show up fast.
Moving Averages and Perception
When it comes to moving averages perception, it’s all about how you read them. Because they smooth out price, they make the market’s direction look cleaner and more obvious. But don’t get fooled — price smoothing always comes with a trade-off. The smoother the line, the later it reacts. ⏳
That’s why moving average calculation actually matters. How much weight is given to past prices decides how fast the MA responds to new moves. Heavier smoothing means fewer fake-outs, but more delay. Less smoothing means quicker signals — and more noise.
How to Use Moving Averages Effectively?
Now that you get the lag, the trend, and the perception, let’s talk about how traders actually use moving averages in real trading.
Use MAs with other indicators: A single MA is fine, but it’s way more useful when it’s backed up by something else. Pair moving averages with RSI, MACD, or volume to filter bad signals. If price is holding above an SMA and RSI is showing bullish momentum, that setup already looks a lot cleaner than an MA signal on its own.
Choose the right type of MA: SMA vs EMA usually comes down to market speed and personal style. EMAs fit fast, volatile markets like crypto because they react quicker to price. SMAs move slower, which makes them better for cleaner, more established trends where you want stability, not speed.
Adjust the timeframe: The MA length you use changes everything. Short-period MAs (like 5 or 10) react fast and suit scalping or day trading. Longer ones (50 or 200) smooth things out and give you the bigger trend picture. There’s no “best” setting — you dial it in based on how you trade and how much noise you’re willing to deal with.
The Takeaway
Moving averages are a solid analytical tool, but like any indicator, they’re not magic. They help point out the trend, cut through market noise, and give context to momentum — but they’re still lagging and always based on past price action. That’s why MAs work best as part of a bigger setup, not as standalone signals. Traders who backed them up with RSI, MACD, or volume usually caught the warning signs early. Those who didn’t… paid for it.
Remember, this is just an analysis tool, not a recommendation. Always consider your own strategy and risk tolerance.

Box Theory LITE — Free Market Structure VisualizerI’ve built Box Theory LITE, a streamlined Pine Script® v6 indicator for futures, stocks, and indices (MES, ES, NQ, SPY, TSLA, and more).
This free version focuses on visualizing key daily levels with a clean overlay of:
• Previous Day High/Low (PDH/PDL)
• Daily Box projection for breakouts/reversals
• Opening Ranges, pivots, multi-timeframe swings (hourly/4H)
• EMAs, Bollinger Bands, VWAP
💡 Why LITE:
It’s perfect for beginners or traders who want quick visual context without extra alerts or signals. Think of it as the foundation for understanding market structure.
⚡ Want More?
I now have two PRO versions:
• Box Theory PRO — adds signals, alerts, presets, and advanced risk management for daily trades.
• Box Theory PRO Weekly — tailored for weekly options spreads, giving you high-level structure and setup insight.
If you’re interested in unlocking these PRO tools, send me a message on TradingView. I guide traders through setup, presets, and subscription info personally.
Start with LITE, master your charts, and see why PRO can give you an edge.

Paramount Skydance Corp | PSKY | Long at $11.53Bull Case
Undervalued: Trading at a steep discount (P/S ~0.5x, P/B ~0.7x) compared to peers like Netflix $NASDAQ:NFLX.
Turnaround: New management (post-Skydance merger) is driving $3B+ in cost savings, heavy investment in high-impact content (e.g., UFC deal, major talent signings), and revitalizing Paramount+ streaming growth.
Mergers / Acquisitions: Ongoing bid for Warner Bros. Discovery NASDAQ:WBD could create massive synergies, scale in streaming, and unlock significant value if successful.
Portfolio: Iconic brands (CBS, Paramount Pictures, Nickelodeon, etc.) plus Skydance's production firepower position it for box office/streaming wins and long-term cash flow recovery.
Bear Case
Debt: ~$15B in debt with high interest costs (though lowering) - risk of dilution.
Streaming Losses: Paramount+ is still burning significant cash; subscriber growth has slowed, and profitability remains distant amid competition.
Weak Box Office & Content Risks: Recent theatrical underperformance and uncertainty around major releases could delay recovery.
Technical Analysis
The stock is currently at the bottom of my selected historical simple moving average (see bands). This is often and area of consolidation, but there is a chance that the price dips below the current trading value ($8-$10 is a possibility) in the near-term before moving higher.
Action
Personally, I think the UFC deal is huge - especially the upcoming White Fight in June 2026. Paramount is introducing real-time programmatic ad sales for live sporting events and trying to reduce costs. With interest rates shifting and reducing the weight of the debt burden, this one may be a sleeper. But, near-term downside is a risk ($8-$10). Regardless, at $11.53, NASDAQ:PSKY is in a personal buy zone for a starter position. If the stock falls further to the predicted "lows", more entries will be made if the outlook stays bullish.
Targets into 2029
$15.00 (+30.1%)
$22.00 (+90.8%)

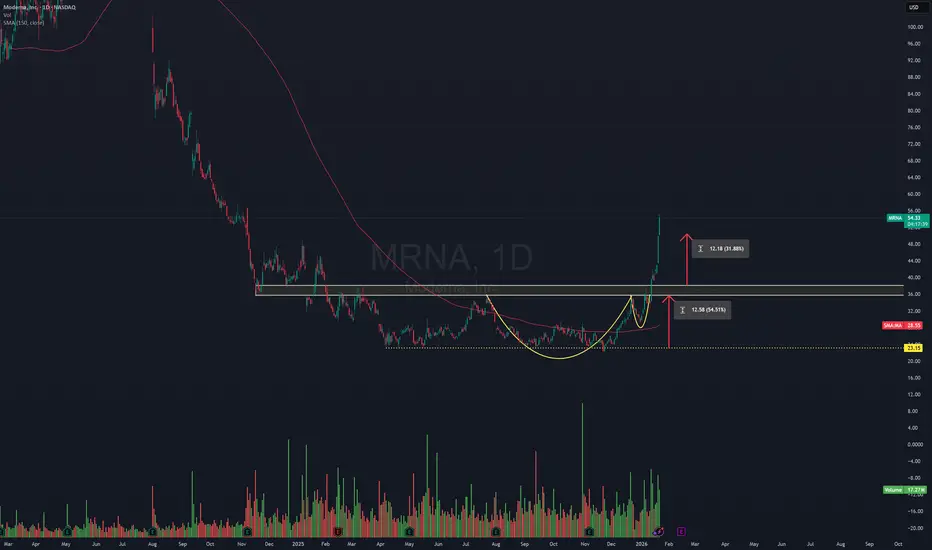
Target PROFIT Reached i published this setup on 15.1.26, before this break, we reached the target and even more, 43%
since i published it 11 days ago.
SUCCEEDED
congrats who took it.
I would place a stop on ATR or consider taking profit for now
Short Trade Setup – PAYTMTimeframe: 125-minute chart
Trade Type: Short
Rationale:
Price has rejected the confluence zone of EMA 21 and EMA 50, which aligns with a higher time frame supply zone. The recent bearish candle and breakdown below equilibrium suggest weakening momentum. A dotted projection indicates potential continuation toward the higher time frame demand zone near ₹1,180.00.
Risk-Reward: Approx. 2.5:1

AstraZeneca Could Be Holding SupportAstraZeneca has been climbing, and now it’s pulled back.
The first pattern on today’s chart is the August 2024 high of $87.68. The drugmaker cleared that level in November and has remained there since, which may confirm a long-term breakout has occurred.
Second is the final price on Friday, November 14. AZN bounced near that weekly close in December and early January. Now it may be trying to hold that same support again.
Third, prices are below the rising 50-day simple moving average. Is that an opportunity for trend followers to buy the pullback?
TradeStation has, for decades, advanced the trading industry, providing access to stocks, options and futures. If you're born to trade, we could be for you. See our Overview for more.
Past performance, whether actual or indicated by historical tests of strategies, is no guarantee of future performance or success. There is a possibility that you may sustain a loss equal to or greater than your entire investment regardless of which asset class you trade (equities, options or futures); therefore, you should not invest or risk money that you cannot afford to lose. Online trading is not suitable for all investors. View the document titled Characteristics and Risks of Standardized Options at www.TradeStation.com . Before trading any asset class, customers must read the relevant risk disclosure statements on www.TradeStation.com . System access and trade placement and execution may be delayed or fail due to market volatility and volume, quote delays, system and software errors, Internet traffic, outages and other factors.
Securities and futures trading is offered to self-directed customers by TradeStation Securities, Inc., a broker-dealer registered with the Securities and Exchange Commission and a futures commission merchant licensed with the Commodity Futures Trading Commission). TradeStation Securities is a member of the Financial Industry Regulatory Authority, the National Futures Association, and a number of exchanges.
TradeStation Securities, Inc. and TradeStation Technologies, Inc. are each wholly owned subsidiaries of TradeStation Group, Inc., both operating, and providing products and services, under the TradeStation brand and trademark. When applying for, or purchasing, accounts, subscriptions, products and services, it is important that you know which company you will be dealing with. Visit www.TradeStation.com for further important information explaining what this means.

Bitcoin rockets off 2026 lows to retest key zoneWith a Greenland framework reached, risk assets are humming again, including bitcoin which staged a dramatic turnaround on Wednesday after tumbling to 2026 lows earlier in the session, rebounding to test a former support zone comprising $90,000 and the 50DMA. The proximity of the price to this zone allows it to be used to build trades around, depending on how the near-term price action evolves.
Should the risk revival extend into Asia, which appears likely, we may see an extension of the corrective bounce, allowing for longs to be established above the 50DMA with a stop beneath $90,000 to protect against reversal. Potential targets include $92,000 or $94,000 initially, depending on the risk reward you are seeking.
However, should the rebound stall beneath the former support zone, it would suggest it may have flipped to offering resistance. Given the environment, while this would allow for it to be used to build short trades, the probability of bearish setups succeeding screens as low right now. If you are inclined to look at shorts, Wednesday’s low would be an obvious target, with a stop above the 50DMA for protection.
Given the headline-driven backdrop, the signal from the oscillators has shifted well down the pecking order in terms of consideration. Even then the overall message is neutral on directional risks. Place greater emphasis on price action when assessing setups.
Good luck
DS

IONQ (swingtrading ) Market is Bearish right now, be awake
---------------------
-The price couldn’t break below the 50 SMA on IONQ
-It moved sideways for a while and is now breaking out
-The uptrend is still intact

DocuSign | DOCU | Long at $56.00Similar to my sentiment around my investment in Zillow , DocuSign NASDAQ:DOCU may show continued weakness in the near-term. The open price gaps in the $30's and $40's may get filled before a strong move up given the housing market news is all doom and gloom (it's winter and interest rates are going lower this spring/summer, causing many buyers and sellers to 'pause' searching/selling). But, contrary to news headlines, the housing market is actually still red hot in many locations as the great wealth transfer continues. The market is still pent up with buyers and sellers who are looking for low rates to move / sign loans. So, from housing to financial institutions, NASDAQ:DOCU has hold within this niche.
Technical Analysis
The price is currently just below the bottom of my selected historical simple moving average band. This band represents the historical mean and, inevitably, the price ebbs and flows through it. It's often an area of share accumulation and support/resistance. If the price dips further into the $40's and $30's to close the lowest open price gaps, I'll be going in heavily (unless there is a major economic collapse).
Growth
Anticipated EPS growth between 2025 ($3.78) and 2027 ($4.54) = +20.0%
Anticipated revenue growth between 2025 ($3.21 billion) and 2027 ($3.69 billion) = +14.9%
Health
Debt-to-Equity: 0.1x (very healthy)
Quick Ratio / short-term debt: .73x (slight risk)
Altman's Z Score / risk of bankruptcy: 4.7 (low risk)
Action
While there may be short-term weakness for NASDAQ:DOCU down into the $40's and $30's, the future looks bright as long as the housing / financial market doesn't break. Thus, at $56.00, NASDAQ:DOCU is in a personal buy zone with additional entries planned with dips to close the lowest open price gaps (unless a major economic crash happens).
Targets into 2028
$83.00 (+48.2%)
$100.00 (+78.6%)

ALLE Investment Grade Multi-Timeframe Long Setup*not investment advice or recommendation. Simply a reflection of how I intend to participate in this market*.
ALLEGION (ALLE) - Investment Grade Multi-Timeframe Long Setup.
MONTHLY TIMEFRAME: We see bullish price structure. Equally, if not more important, is the integrity of the trend. We see the bullish trend has strong integrity based on the strong ADX reading. 2Y & 4Y SMA's are rising, and we have bullish RSI momentum that is nowhere near overbought. This gives us the green light to look further on the Weekly timeframe for entries. The
WEEKLY TIMEFRAME: We see on the decline since October that the weekly trend integrity is very weak (based on declining ADX during the decline). This tells us that this is a dip worth buying. We also see the 10 week (approximately 50 day) SMA turning up and back in alignment with the rising 200D SMA. The Weekly 5 period RSI has crossed and closed back above 50, indicating bullish momentum on this timeframe is back in alignment with the dominant bullish monthly trend.
ENTRY: I will be buying on a stop @ 166.79. This implies bullish follow-through above the high of the weekly bar that resumed the bullish weekly momentum. Stop @ 157.80.
TARGET: Based on the strong monthly trend integrity, I am looking for a move to ATH @ 180.68. I plan to peel 10% off at 1.25 R, 20% off at 2R, and leave the remaining 70% as a runner trailing based on weekly structure &/or ATR.
Happy to hear thoughts and questions.

Potential Megaphone in TechTechnology stocks have been struggling, and some traders may see long-term topping patterns.
The first item on today’s chart of the SPDR Select Sector Technology ETF (XLK) ETF is the pair of diverging lines since December 22. That directionless movement is a potential “megaphone” pattern that could be associated with distribution (rather than accumulation).
Second, XLK closed $143.97 on December 31. It stayed above that level for almost three weeks, but yesterday turned negative on a year-to-date basis.
Third, the 50-day simple moving average has started falling. The 8-day exponential moving average (EMA) also crossed below the 21-day EMA. Those patterns may reflect weakness in the intermediate and short terms.
Next, you have the record high on October 29 and a bearish gap the following week. XLK has remained below those levels as the broader market inched to new highs. Such a lack of relative strength, combined with lower monthly highs, may also reflect spreading weakness.
Standardized Performances for the ETF mentioned above:
SPDR Select Sector Financial ETF (XLF)
1-year: +23.83%
5-years: +121.46%
10-year: +572.13%
(As of December 31, 2025)
Exchange Traded Funds ("ETFs") are subject to management fees and other expenses. Before making investment decisions, investors should carefully read information found in the prospectus or summary prospectus, if available, including investment objectives, risks, charges, and expenses. Click here to find the prospectus.
TradeStation has, for decades, advanced the trading industry, providing access to stocks, options and futures. If you're born to trade, we could be for you. See our Overview for more.
Past performance, whether actual or indicated by historical tests of strategies, is no guarantee of future performance or success. There is a possibility that you may sustain a loss equal to or greater than your entire investment regardless of which asset class you trade (equities, options or futures); therefore, you should not invest or risk money that you cannot afford to lose. Online trading is not suitable for all investors. View the document titled Characteristics and Risks of Standardized Options at www.TradeStation.com . Before trading any asset class, customers must read the relevant risk disclosure statements on www.TradeStation.com . System access and trade placement and execution may be delayed or fail due to market volatility and volume, quote delays, system and software errors, Internet traffic, outages and other factors.
Securities and futures trading is offered to self-directed customers by TradeStation Securities, Inc., a broker-dealer registered with the Securities and Exchange Commission and a futures commission merchant licensed with the Commodity Futures Trading Commission). TradeStation Securities is a member of the Financial Industry Regulatory Authority, the National Futures Association, and a number of exchanges.
TradeStation Securities, Inc. and TradeStation Technologies, Inc. are each wholly owned subsidiaries of TradeStation Group, Inc., both operating, and providing products and services, under the TradeStation brand and trademark. When applying for, or purchasing, accounts, subscriptions, products and services, it is important that you know which company you will be dealing with. Visit www.TradeStation.com for further important information explaining what this means.

Deckers May Have StalledDeckers Outdoors plunged in late 2025, and now traders may see further downside risk.
The first pattern on today’s chart is the drop on October 24 after guidance trailed estimates. The footwear company rebounded in December, but it could be showing signs of stalling this month.
Second is the $99.70 level, the final price on Friday, December 5. DECK mostly stayed above that weekly close until breaking sharply below it yesterday.
Third, the current weakness is occurring at the falling 100- and 200-day simple moving averages. That may confirm a long-term downtrend.
Fourth, the 8-day exponential moving average (EMA) just crossed below the 21-day EMA. MACD is also falling. Those signals may reflect short-term bearishness.
Finally, DECK made a 2 1/2-year low of $78.91 in November. Could trend followers view that as a natural level for a retest?
TradeStation has, for decades, advanced the trading industry, providing access to stocks, options and futures. If you're born to trade, we could be for you. See our Overview for more.
Past performance, whether actual or indicated by historical tests of strategies, is no guarantee of future performance or success. There is a possibility that you may sustain a loss equal to or greater than your entire investment regardless of which asset class you trade (equities, options or futures); therefore, you should not invest or risk money that you cannot afford to lose. Online trading is not suitable for all investors. View the document titled Characteristics and Risks of Standardized Options at www.TradeStation.com . Before trading any asset class, customers must read the relevant risk disclosure statements on www.TradeStation.com . System access and trade placement and execution may be delayed or fail due to market volatility and volume, quote delays, system and software errors, Internet traffic, outages and other factors.
Securities and futures trading is offered to self-directed customers by TradeStation Securities, Inc., a broker-dealer registered with the Securities and Exchange Commission and a futures commission merchant licensed with the Commodity Futures Trading Commission). TradeStation Securities is a member of the Financial Industry Regulatory Authority, the National Futures Association, and a number of exchanges.
TradeStation Securities, Inc. and TradeStation Technologies, Inc. are each wholly owned subsidiaries of TradeStation Group, Inc., both operating, and providing products and services, under the TradeStation brand and trademark. When applying for, or purchasing, accounts, subscriptions, products and services, it is important that you know which company you will be dealing with. Visit www.TradeStation.com for further important information explaining what this means.

Magna International (MG.TO) — Swing Trade Idea💰 MG.TO — Swing Trade Idea
🏢 Company Snapshot
• Magna International is a global auto-parts manufacturer with diversified exposure across EV, ADAS, and traditional OEM supply chains.
• Matters now: sustained relative strength vs TSX, constructive auto/industrial rotation, and price holding trend structure after a controlled pullback.
📊 Fundamental Context (Trade-Relevant Only)
• Valuation: Fair to slightly discounted vs global auto-parts peers after prior rerating
• Balance Sheet: Manageable leverage, no near-term liquidity stress
• Cash Flow: Stable, supports reinvestment and buybacks
• Dividend: Neutral to supportive (not the trade driver)
Fundamental Read: Fundamentals do not conflict with the trend and provide a stable backdrop for a technical continuation swing.
🪙 Industry & Sector Backdrop
• Short-Term (1–4 weeks): Auto/industrial complex holding bid; no aggressive sector distribution
• Medium-Term (1–6 months): MG outperforming TSX Industrials on trend persistence
• Macro Influence: Rates stabilizing → reduces pressure on cyclical multiples
Sector Bias: Bullish
📐 Technical Structure (Primary Driver)
• Trend: Strong uptrend — price above rising 50-SMA (~72.6) and well above 200-SMA (~60.5)
• Momentum: RSI(2) recently oversold → reset within trend, not breakdown
• Pattern: High-tight advance followed by orderly pullback into dynamic support
• Volume: No capitulation; pullback volume remains corrective
Key Levels
• Support: 71.00 – 72.50 (50-SMA + prior breakout zone)
• Resistance: 78.50 – 80.50 (recent highs / measured extension)
🎯 Trade Plan (Execution-Focused)
• Entry: 71.80 – 73.00 (reclaim / hold of 50-SMA with stabilization)
• Stop: 70.80 (daily close below trend support invalidates)
• Target: 79.80
• Risk-to-Reward: ~2.4R
Alternate Scenario: If price loses 50-SMA, stand aside and reassess near rising structure around 69–70; no chase below trend.
🧠 Swing Trader’s Bias
Price remains in a controlled daily uptrend with RSI reset into support. Looking for confirmation off the 50-SMA to target a retest of highs for a >2R swing. A decisive close below 70.80 invalidates the setup.

Robinhood TRADE IDEA $HOODNASDAQ:HOOD What do you think about this trade idea?
Robinhood stock has bounced strongly from its moving average three times in the recent past, clearly showing that this level is acting as an important area of support. Each pullback toward the moving average has attracted buyers, leading to meaningful rebounds, which makes this level worth watching closely again.
After a strong run earlier in 2025, the stock has experienced a sharp pullback, coming down from around $150 to near the $100 level. This correction has made the chart structure more interesting, especially from a risk-to-reward perspective. While the end of the move has been rough, the overall trend still has the potential to resume if price holds above this key moving average.
If you’re considering a buying opportunity in Robinhood, it’s important to closely monitor how the stock behaves around this moving average. A strong reaction or bullish confirmation from this level could signal another leg higher, while a clean break below it may suggest further downside. Overall, this moving average remains a critical decision point for anyone looking to trade or invest in the stock.

Bitcoin 2 day death cross doom - December 2025At the end of each 4 year cycle (October 2025 being the last around $120k), price action is followed by a 2 day death cross.
“But Ww the 4 year cycle is broken!! It does not apply anymore.”
“This time is different Ww”
Hold that thought…
The previous 2 day death crosses are shown below (in addition to the December 2025 print above), after completion of the 4 year cycle. The same conditions repeat time after time:
1. A rise to market structure.
2. A confirmation of resistance, and following deep correction over the next two years.
Here are the facts that followed each previous death cross:
1. Price action would see a further 60% correction after the cross and resistance confirmation. $30k it is then, should history repeat.
2. The length of each bear market increases roughly by a factor of 1.23, see 2 week chart below.
3. 938 days x 1.23 = 1153 days for the next bear market resistance breakout, should the death cross confirm. Downtrend does not reverse until February 2029!
2 week big picture chart - the increased length of each bear market
You think this time is different? That’s cute. The next bear market is going to be beyond exhausting. Influencers you’ll notice are all talk of 2026 and the “money printer” nonsense.
Each black vertical line on the 2 week chart below is a 2 day death cross print. Really, look left, tell me this time is different with a straight face.
This big picture is more than just another death cross. A confirmation of this idea is also a confirmation of this idea: “ Bitcoin in multi year collapse back to $1k - December 2025 ”
In the old days Ponzi schemes were often referred to as “pyramid schemes”, with new members of the scheme (or scam) recruiting new money. That’s all Bitcoin has ever done in its life, recruited new sources of money. The Boomer money via ETFs and Small to Medium sized businesses added 1% or so of their cash was never adoption, it was a punt, pure and simple.
5 month chart
Previous 2 day death crosses:
February 2022
July 2018
September 2014
Conclusions
So here we are again, the 2 day death cross turns up right on cue. The little rally everyone calls "strength" because it helps them sleep at night. Think circa $100-102k ish if price decides to do the traditional "don't worry lads, I'm fine" routine. Then reality turn up. structure gets tested, resistance gets confirmed and suddenly the market remembers it's not a Disney film.
"Deep correction becomes the main event"
History says after confirmation the market tends to do the unthinkable... repeatedly.. for ages. If that pattern repeats, $30k isn't crazy, it's basically the punchline.
Bear markets don't just hurt, they drag. If the bear length expands (need to view higher time frames to understand the 1.23 expansion better), then the next downtrend isn't a quick dip; it's a long, grey, joyless slog. The sort of thing that makes you nostalgic for inflation.
And if this cross confirms, it's not just bearish.. . it's existential. Because it doesn't merely support "cycle top then unwind"... it also strengthens the broader "multi year collapse" narrative. The one people laugh at right up until they stop laughing.
Everyone shouts "THIS TIME IS DIFFERENT", of course it is.. because hope is free and accountability is expensive. Influencers will keep promising 2026 will be glorious, the "money printer" will save us as the chart does what it always does: Humiliate certainty.
So the take is simple: If resistance confirms after this cross, the probability shifts toward a long, grinding bear phase, the kind that makes even true believers quietly change the subject at the family dinner.
If resistance does not a confirm, we then see a "short squeeze" event. But that's not growth or adoption, it's just a short squeeze of retail traders liquidating themselves as they have done throughout 2025. Either way the death cross has a high probability of playing out.
Ww
Disclaimer
==========================================================
This is not financial advice. It’s market commentary with a side of sarcasm.
I’m not your adviser. I’m not even your mate who “knows charts.”
Technical analysis is pattern recognition, not prophecy. Sometimes it works. Sometimes it’s astrology for people who like spreadsheets. The sample size here is tiny. Three-ish comparable events is not a law of nature, it’s a vibe with a ruler.
Crypto is volatile. You can lose some, most, or all of your money, and then still have to watch influencers call it a “healthy correction.” If you trade this, do your own research, manage risk, size positions like an adult, and accept responsibility for your decisions.
In short: treat this as a theory, not a guarantee. And if your entire financial plan depends on “it has to go up because I want it to”… congratulations, you’re not investing, you’re praying.

KWEB LongWeekly EMA 20,50,200 in uptrend
Weekly resistance/support line
Long entry 37.5
Stop 34
Target 54
Risk management is much more important than a good entry point.
I am not a PRO trader.
In my trading plan, the Max Risk of each short term trade should be less than 1% of an account.

XPEV LongWeekly EMA 20,50 in uptrend
Weekly resistance/support line
Long entry 20.5
Stop 17
Target 35
Risk management is much more important than a good entry point.
I am not a PRO trader.
In my trading plan, the Max Risk of each short term trade should be less than 1% of an account.

IONQ to Lead Bullish Quantum Stock Move?*Not investment advice or recommendation.*
IONQ Bullish "Investment Grade" Trade Setup:
Multi-timeframe analysis and reliable indicators like ADX & RSI point towards the *potential* for a strong upside move for IONQ and other similar quantum computing stocks like QUBT & RGTI.
MONTHLY TIMEFRAME:
The ADX shows the monthly timeframe bullish trend is extremely strong and has integrity. This is step number 1 and suggests that looking for entry on the Weekly chart is a worthwhile pursuit. We also see the 2 & 4 year SMA's sloping upwards, indicating the path of least resistance on this timeframe is higher.
WEEKLY TIMEFRAME:
The pullback that has occurred since October has seen a declining ADX on the weekly timeframe, implying weak seller integrity. This is a classic combination where the HTF (Monthly) ADX is very strong, and the pullback on the entry timeframe (Weekly) is weak. We have a very strong trend on the HTF, weak conviction from Sellers on the entry timeframe. This gives us the green light to look for resumption of bullish momentum to get long.
Last week the 5 week RSI closed above 50, and we took out last weeks high today, implying the bullish momentum has resumed and is in alignment with the strong monthly trend. A further confluence is the Buyers stepping in at the rising 200 day SMA, creating higher lows on the weekly chart, and we see the 50 day starting to flatten/rise in alignment with the rising 100 & 200 day SMA's, suggesting the "path of least resistance" is higher.
My entry is 52.46 with a stop below January lows @ 43.80. This is a wide stop as this is an "investment" style swing trade, which I anticipate holding for several weeks. Based on the ADX strength on the monthly, I think there are strong chances that this stock rallies to ATH (approximately 60% gains from current price levels).
Happy to hear thoughts, questions or comments.
