Zscaler May Be OversoldZscaler recently climbed to a three-year high, and now it’s pulled back.
The first pattern on today’s chart is the May 30 gap after earnings and revenue beat estimates. That may reflect positive fundamentals.
Second, the cybersecurity stock has retraced half the move following results. Stabilizing here may confirm direction is pointing higher.
Third, prices are trying to stabilize near the rising 50-day simple moving average.
Fourth, stochastics have dipped to an oversold condition.
TradeStation has, for decades, advanced the trading industry, providing access to stocks, options and futures. If you're born to trade, we could be for you. See our Overview for more.
Past performance, whether actual or indicated by historical tests of strategies, is no guarantee of future performance or success. There is a possibility that you may sustain a loss equal to or greater than your entire investment regardless of which asset class you trade (equities, options or futures); therefore, you should not invest or risk money that you cannot afford to lose. Online trading is not suitable for all investors. View the document titled Characteristics and Risks of Standardized Options at www.TradeStation.com . Before trading any asset class, customers must read the relevant risk disclosure statements on www.TradeStation.com . System access and trade placement and execution may be delayed or fail due to market volatility and volume, quote delays, system and software errors, Internet traffic, outages and other factors.
Securities and futures trading is offered to self-directed customers by TradeStation Securities, Inc., a broker-dealer registered with the Securities and Exchange Commission and a futures commission merchant licensed with the Commodity Futures Trading Commission). TradeStation Securities is a member of the Financial Industry Regulatory Authority, the National Futures Association, and a number of exchanges.
TradeStation Securities, Inc. and TradeStation Technologies, Inc. are each wholly owned subsidiaries of TradeStation Group, Inc., both operating, and providing products and services, under the TradeStation brand and trademark. When applying for, or purchasing, accounts, subscriptions, products and services, it is important that you know which company you will be dealing with. Visit www.TradeStation.com for further important information explaining what this means.
Moving Averages

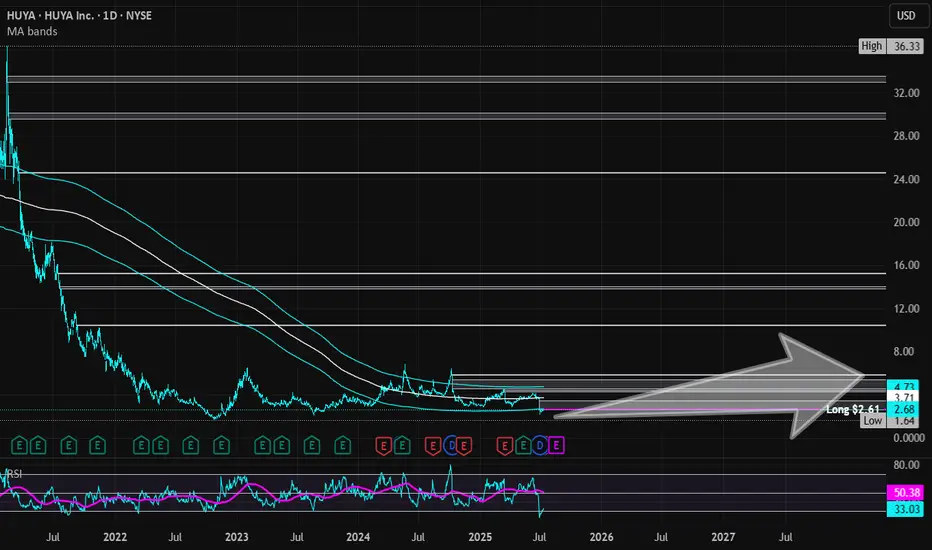
HUYA | HUYA | Long at $2.61HUYA NYSE:HUYA operates game live streaming platforms in China. This stock got my attention based on the reported fundamentals and price position, but moderate "Chinese delisting" risks exist given the US's new political administration.
Book Value = $3.23 (Undervalued)
Forward P/E = 4.1x (Growth)
Debt-to-equity = 0x (Healthy)
Quick Ratio = 1.56x (Healthy)
Altman's Z Score = <1.8 (Bankruptcy risk is relatively high)
From a technical analysis perspective, the stock price momentum has shifted upward based on the historical simple moving average. The price often consolidates within and slightly outside of this simple moving average band before progressing higher (after a long period of selling). While near term-declines are a risk, a longer-term hold (if the fundamentals do not change and delisting doesn't occur) may pay off given the value, growth, and overall health of the company.
Thus, at $2.61, NYSE:HUYA is in a personal buy zone.
Targets into 2028:
$3.45 (+32.2%)
$5.80 (+122.2%)
Elevance Health | ELV | Long at $286.00What are seeing in the healthcare and health insurance provider industry right now is destruction before a once-in-a-lifetime boom. The baby boomer generation is between 60 and 79 right now and the amount of healthcare service that will be needed to serve that population is staggering. Institutions are crushing them to get in - it's just near-term noise, in my opinion. My personal strategy is buy and hold every healthcare opportunity (i.e. NYSE:CNC , NYSE:UNH , NYSE:HUM etc).
Elevance Health NYSE:ELV just dropped heavily due to lower-than-expected Q2 2025 earnings, a cut in full-year profit guidance from $34.15-$34.85 to ~$30 EPS, and elevated medical costs in Medicaid and ACA plans. It's near-term pain (may last 1-2 years) which will highly likely lead to long-term growth. The price has touched my historical simple moving average "crash" band. I would not be shocked to see the price drop further into the $260s before a rise. However, the near-term doom could go further into the year. I am anticipating another drop to the "major crash" simple moving average band into the $190s and $220s to close out the remaining price gaps on the daily chart that occurred during the COVID crash. Not to say it will absolutely reach that area, but it's locations on the chart I have for additional buys.
Thus, at $286.00, NYSE:ELV is in a personal buy zone (starter position) with more opportunities to gather shares likely near $260 before a bounce. However, if the market or healthcare industry really turns, additional buys planned for $245 and $212 for a long-term hold.
Targets into 2028:
$335.00 (+17.1%)
$386.00 (+35.0%)

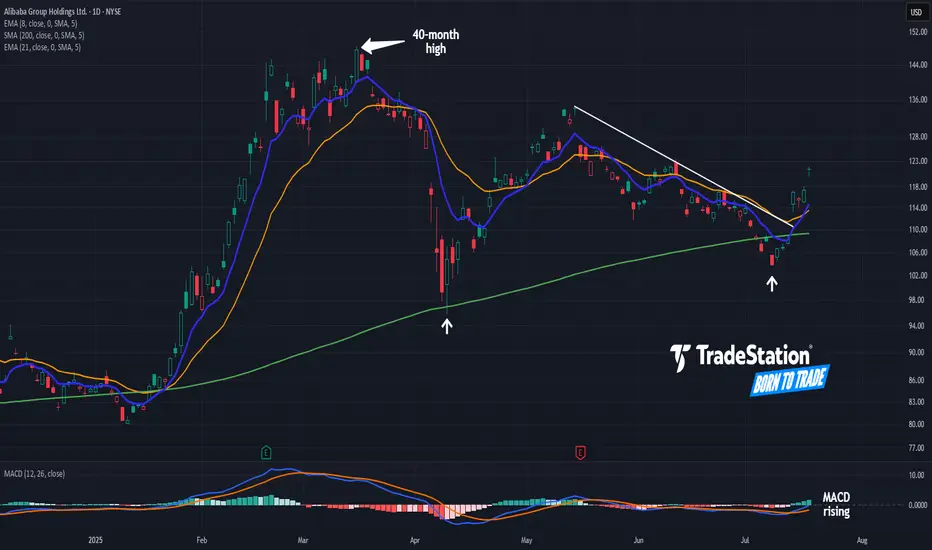
Alibaba Breaks a TrendlineAlibaba began 2025 with a big rally. Now, after a long pullback, some traders may see further upside in the Chinese tech giant.
The first pattern on today’s chart is the pair of higher lows (marked with white arrows) along the rising 200-day simple moving average. Those may reflect the development of a longer-term uptrend.
Second, BABA peaked above $148 in March. It was the highest price since November 2021. That may suggest a long-term downtrend is fading.
Third is the series of lower highs in May and June. The stock broke that falling trendline this week, a potential sign of improving price action in the short term.
Next, MACD is rising and the 8-day exponential moving average is nearing a potential cross above the 21-day EMA. Those could be viewed as further positive short-term signals.
Finally, BABA is an active underlier in the options market. (Volumes have averaged more than 200,000 contracts per session in the last month, according to TradeStation data.) That may help traders take positions with calls and puts.
TradeStation has, for decades, advanced the trading industry, providing access to stocks, options and futures. If you're born to trade, we could be for you. See our Overview for more.
Past performance, whether actual or indicated by historical tests of strategies, is no guarantee of future performance or success. There is a possibility that you may sustain a loss equal to or greater than your entire investment regardless of which asset class you trade (equities, options or futures); therefore, you should not invest or risk money that you cannot afford to lose. Online trading is not suitable for all investors. View the document titled Characteristics and Risks of Standardized Options at www.TradeStation.com . Before trading any asset class, customers must read the relevant risk disclosure statements on www.TradeStation.com . System access and trade placement and execution may be delayed or fail due to market volatility and volume, quote delays, system and software errors, Internet traffic, outages and other factors.
Securities and futures trading is offered to self-directed customers by TradeStation Securities, Inc., a broker-dealer registered with the Securities and Exchange Commission and a futures commission merchant licensed with the Commodity Futures Trading Commission). TradeStation Securities is a member of the Financial Industry Regulatory Authority, the National Futures Association, and a number of exchanges.
Options trading is not suitable for all investors. Your TradeStation Securities’ account application to trade options will be considered and approved or disapproved based on all relevant factors, including your trading experience. See www.TradeStation.com . Visit www.TradeStation.com for full details on the costs and fees associated with options.
Margin trading involves risks, and it is important that you fully understand those risks before trading on margin. The Margin Disclosure Statement outlines many of those risks, including that you can lose more funds than you deposit in your margin account; your brokerage firm can force the sale of securities in your account; your brokerage firm can sell your securities without contacting you; and you are not entitled to an extension of time on a margin call. Review the Margin Disclosure Statement at www.TradeStation.com .
TradeStation Securities, Inc. and TradeStation Technologies, Inc. are each wholly owned subsidiaries of TradeStation Group, Inc., both operating, and providing products and services, under the TradeStation brand and trademark. When applying for, or purchasing, accounts, subscriptions, products and services, it is important that you know which company you will be dealing with. Visit www.TradeStation.com for further important information explaining what this means.
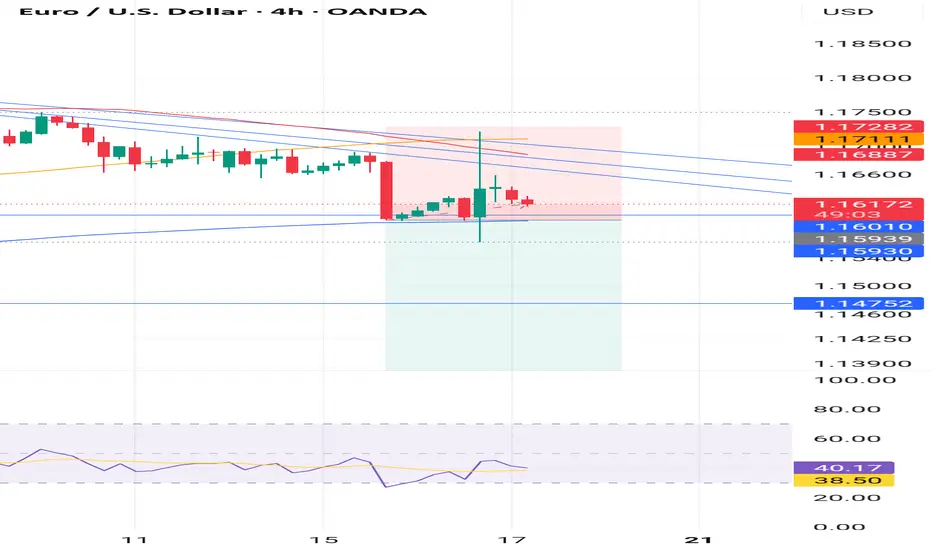
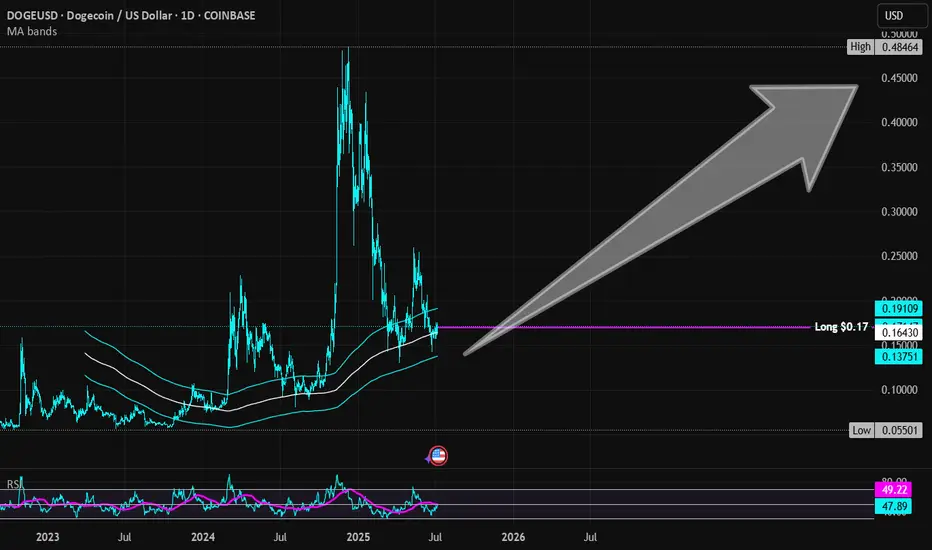
Dogecoin | DOGE | Long at $0.17Currently within my historical simple moving average area and consolidating. I suspect a move up is imminent, but 100% speculation. Crypto "bros" know more than I do.
Targets into 2028:
$0.25 (+47.1%)
$0.45 (+164.7%)
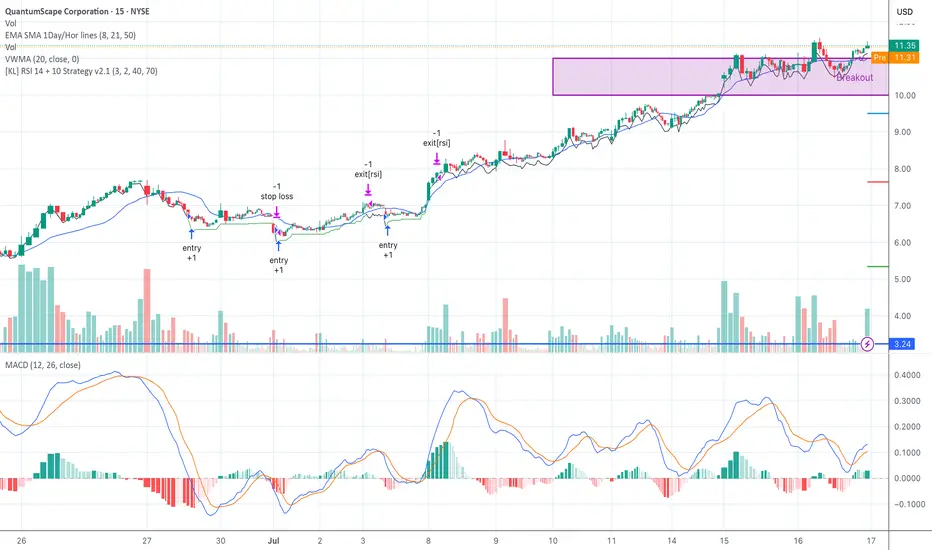
QS Breakout Setting Up — Entries Triggered, Waiting for ConfirmSeed System entries are printing on QS with trailing profit zones holding firm.
MACD crossovers confirming the move. Watching RSI cooling just under breakout resistance at $11.35.
A push through $11.50 with volume and I’m adding — slowly.
Support at $10.03, cut fast if price shows weakness.
Let the market do the heavy lifting.
#QS #SeedSystem #SwingTrading #TrendFollowing #LivermoreStyle #BreakoutWatch
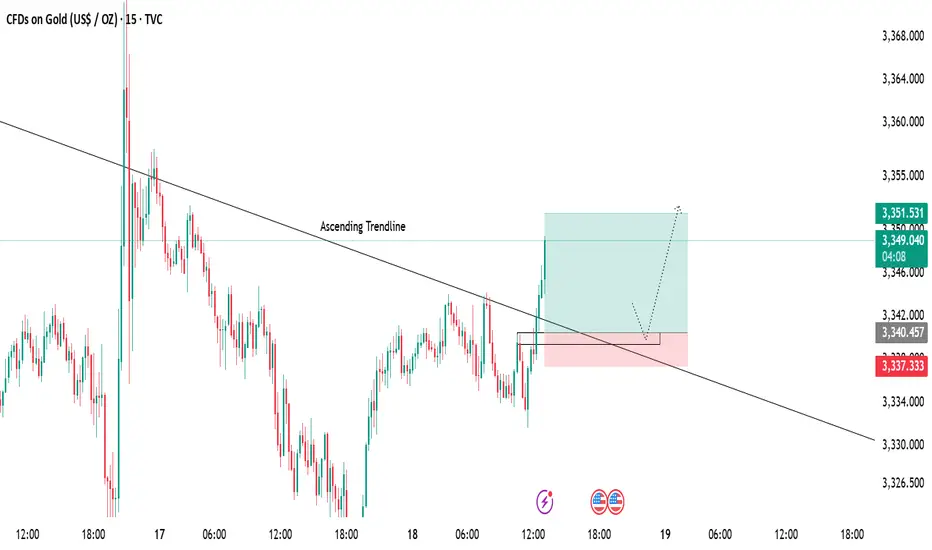
Gold 15-Min Chart Analysis Alert!Gold has successfully broken above the descending trendline, showing early signs of bullish momentum. Price has reclaimed structure and is now trading above the breakout level.
📌 Retest Zone:
We can expect a possible pullback towards the marked zone for a healthy retest before continuing the upward move.
🎯 Bullish Target:
As long as price holds above the support area, the bullish bias remains intact with targets around 3351+.
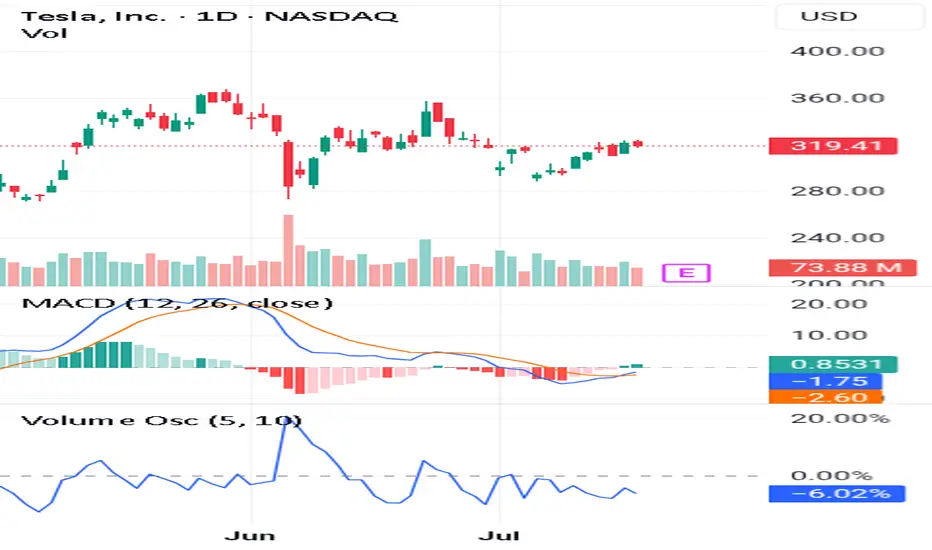
(Learn More)Use These 3 Steps To Spot Long-Lasting Trends👉Trade before the earnings report
👉Make sure the volume oscillator is below zero
👉Make sure the MACD lines give you a Bullish signal
If you look at this chart you can see all the steps alignment.
This is very important because you want to catch a long term trend.
Also it has to follow the 3step rocket booster strategy.
In order for you to learn more about this strategy 🚀 Rocket Boost This Content.
Disclaimer ⚠️ Trading is risky please learn how to use Risk Management And Profit Taking Strategies. Also feel free to use a simulation trading account before you use real money.
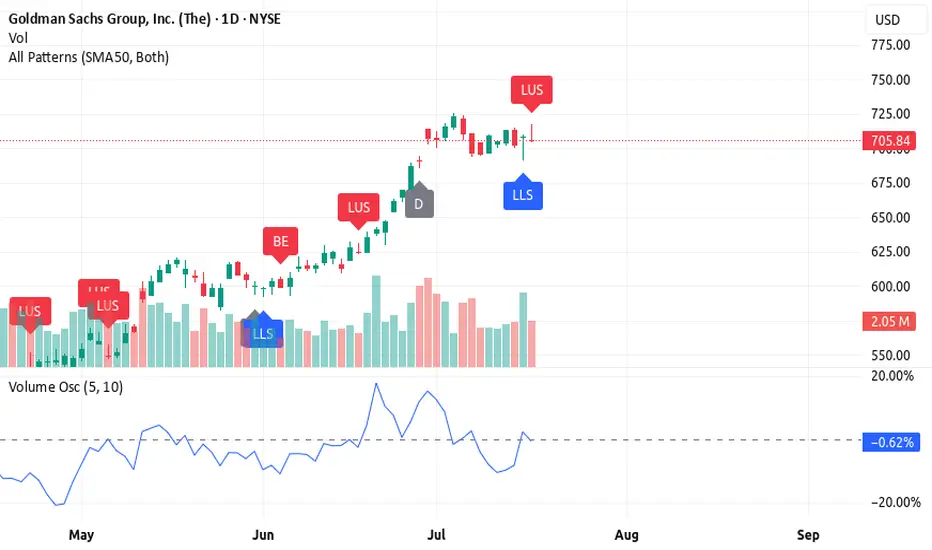
3 Reasons Why Goldman Sachs (GS) Still Looks Bullish🚀 3 Reasons Why Goldman Sachs (GS) Still Looks Bullish (Despite a Bearish Candle)
Goldman Sachs is in a bullish trend, but the latest candlestick is flashing a warning. Here's why GS still looks strong — and what to watch for next 📈
1️⃣ Candlestick pattern – long upper shadow
The long upper shadow shows sellers pushed the price down from the highs, signaling resistance. While bearish short-term, it often happens during strong trends as the market breathes before pushing higher.
2️⃣ High volume on a bearish candle
The negative volume shows resistance, but it may actually represent bear exhaustion. High volume without a breakdown
suggests bears tried to push it down — and failed. Classic fake-out.
3️⃣ Volume oscillator still rising
Despite the pullback candle, the volume oscillator is holding above zero and trending up, showing momentum is still on the bulls' side.
🔥 Rocket Booster Strategy still intact
✅ Price above 50 EMA
✅ Price above 200 EMA
⚠️ Just a temporary shakeout? If the next candle confirms support, GS may continue the bullish push.
⚠️ Disclaimer: Always use a simulation (demo) account before trading with real money. Learn proper risk management and profit-taking strategies to protect your capital.
ATAI bulls look primed for another leg upATAI gave us the highest close we've seen in nearly 3 years today as bulls closed at high of the day approaching resistances from the gap up on July 1st. Today saw 2x the volume traded yesterday which is a great sign when looking for daily continuation.
Anticipate resistance at 2.81. 3.00, 3.01, and weekly 200 SMA
Red flag from here would be to fail at 3.00 and reverse to break below 2.53.

Ball Corporation Quote | Chart & Forecast SummaryKey Indicators On Trade Set Up In General
1. Push Set Up
2. Range Set Up
3. Break & Retest Set Up
Notes On Session
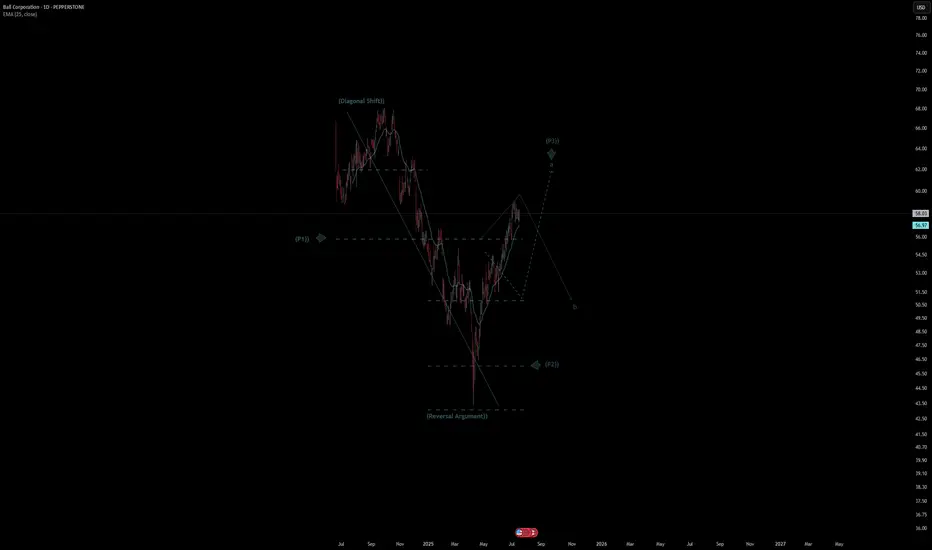
# Ball Corporation Quote
- Double Formation
* (Diagonal Shift)) At 67.00 USD | Completed Survey
* (Reversal Argument)) - *Fractional Spike | Subdivision 1
- Triple Formation
* (P1)) / (P2)) & (P3)) | Subdivision 2
* (TP1) = a / Long Consecutive Range
* (TP2) = b / Short Consecutive Pullback | Subdivision 3
* Daily Time Frame | Trend Settings Condition
- (Hypothesis On Entry Bias)) | Regular Settings
- Position On A 1.5RR
* Stop Loss At 53.00 USD
* Entry At 58.00 USD
* Take Profit At 65.00 USD
* (Uptrend Argument)) & No Pattern Confirmation
- Continuation Pattern | Not Valid
- Reversal Pattern | Not Valid
* Ongoing Entry & (Neutral Area))
Active Sessions On Relevant Range & Elemented Probabilities;
European-Session(Upwards) - East Coast-Session(Downwards) - Asian-Session(Ranging)
Conclusion | Trade Plan Execution & Risk Management On Demand;
Overall Consensus | Buy


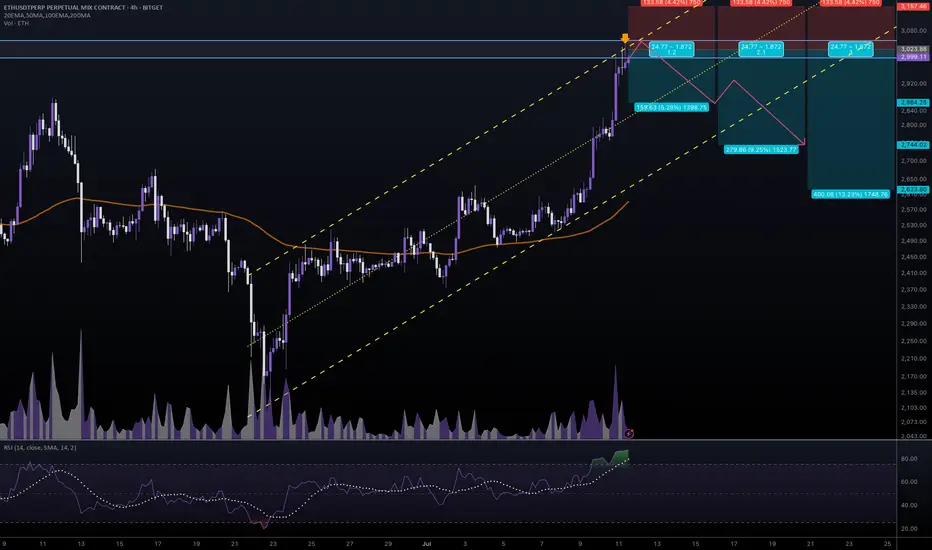
#ETHUSDT #4h (Bitget Futures) Ascending channel on resistanceEthereum printed a gravestone doji followed by a shooting star, RSI is overbought, local top seems in.
⚡️⚡️ #ETH/USDT ⚡️⚡️
Exchanges: Bitget Futures
Signal Type: Regular (Short)
Leverage: Isolated (9.0X)
Amount: 5.0%
Entry Zone:
2996.99 - 3050.49
Take-Profit Targets:
1) 2864.25
2) 2744.02
3) 2623.80
Stop Targets:
1) 3157.46
Published By: @Zblaba
CRYPTOCAP:ETH BITGET:ETHUSDT.P #4h #Ethereum #PoS ethereum.org
Risk/Reward= 1:1.2 | 1:2.1 | 1:3.0
Expected Profit= +47.5% | +83.3% | +119.0%
Possible Loss= -39.8%
Estimated Gaintime= 1-2 weeks
XRP: 22 Minutes to LIFT OFF!I'm bullish, no question about it.
I wouldn't want to be on the other side of this trade right now. Everything I'm seeing points to a strong move coming soon.
Weekly cross is giving confirmation.
Bullish engulfing on the hourly, with momentum building across lower timeframes.
Price action suggests we're setting up for a retest of the previous ATH, and there's a real possibility of printing new highs from here.
Season’s about to kick off — I’m positioned accordingly.
Due in 15 minutes

Trump’s Noise, Market’s Choice: Downtrend ContinuesTrump came out with a fake piece of news to create some volatility for himself.
But the trend went back to its original path, and in my opinion, the downtrend will likely continue.