BHEL Technical Outlook: Volatility Compression Signals Breakout Bharat Heavy Electricals Limited (BHEL) is currently in a high-probability consolidation phase after a strong prior uptrend, with price action compressing into a tightening range.
The weekly chart shows an ascending triangle, highlighting persistent accumulation through higher lows while supply caps the upside—typically a continuation pattern in a bullish structure.
Price remains comfortably above long-term moving averages, reinforcing medium- to long-term trend strength and downside protection.
On the daily timeframe, a Bollinger Band squeeze is visible, signalling volatility contraction and increasing odds of an impulsive move.
RSI in the mid-50s to low-60s reflects healthy momentum without overbought conditions, allowing room for expansion.
MACD downside momentum is fading, with histogram flattening—often an early sign of trend resumption.
₹270–272 acts as a strong demand zone, while ₹290–295 is the key breakout trigger.
A decisive close above ₹290 with volume could unlock an upside move toward ₹310–325, while a break below ₹270 would extend consolidation.
Bottom line:
BHEL is coiling within a bullish structure, with volatility compression setting the stage for a directional breakout. The trend remains constructive, and the next move is likely to be sharp once price escapes the current range.
Movingaveragecrossover

BXY approaching weekly 50SMA & monthly 20EMAThe pound is due for a rally as it is nearing critical SMA and EMA. The algorithm presumably has to test these moving averages before higher highs. If support holds, all pound pairs should see some bullish momentum.

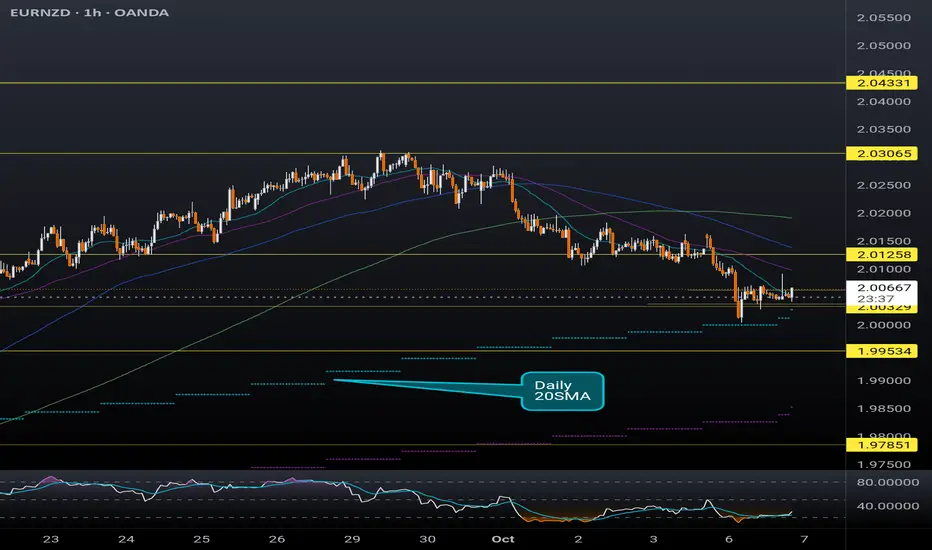
EURNZD finding support at the daily 20SMASimilar to the previous 2 posts regarding GBP pairs, EURNZD is currently riding support at the daily 20SMA (overlayed on this 1H chart). The hourly RSI is also indicating this pair is oversold. RBNZ is expected to cut interest rate tomorrow by another 25 basis points which could be the catalyst to realizing this potential bullish move. Recent weakness in the NZD came after the latest interest rate cut, and if further dovish comments follow the interest rate decision tomorrow, this pair could retest the 2.03xx high hit in late September.
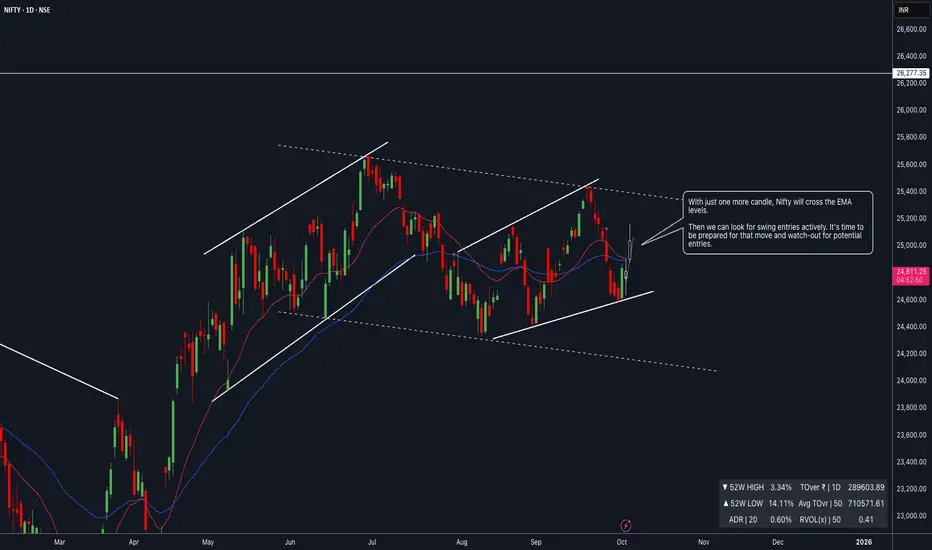
NIFTY : Nifty at a Turning Point : EMA Breakout in Sight📈 Nifty Technical & Fundamental Outlook
With just one more candle, Nifty looks set to cross above the key EMA levels. This shift is crucial as it signals potential strength building up in the market. Once that confirmation comes through, we can start actively looking for swing entries. The next few sessions will be important to track, so it’s time to stay prepared and alert for possible opportunities.
From a broader perspective, the market seems to be aligning with the best-case scenario I was expecting. The sentiment is turning bullish, and unless we witness sharp bouts of selling pressure in the coming days, the probability of a sustained recovery appears strong.
On the fundamental side, a couple of factors are supportive:
The GST cut is expected to boost consumption and corporate earnings.
With upcoming quarterly results, the overall market P/E ratio could find stronger justification if earnings come in robust.
Institutional delivery data is not reflecting any aggressive selling interest, which adds confidence to the current setup.
✅ All these tailwinds together create a strong case for a bullish bias in the near term.
As traders, the plan now is simple: track the EMA breakout, monitor earnings triggers, and stay ready for high-probability swing setups.
📢📢📢
If my perspective changes or if I gather additional fundamental data that influences my views, I will provide updates accordingly.
Thank you for following along with this journey, and I remain committed to sharing insights and updates as my trading strategy evolves. As always, please feel free to reach out with any questions or comments.
Other posts related to this particular position and scrip, if any, will be attached underneath. Do check those out too.
Disclaimer : The analysis shared here is for informational purposes only and should not be considered as financial advice. Trading in all markets carries inherent risks, and past performance is not indicative of future results. It’s essential to conduct your own research and assess your risk tolerance before making any investment decisions. The views expressed in this analysis are solely mine. It’s important to note that I am not a SEBI registered analyst, so the analysis provided does not constitute formal investment advice under SEBI regulations.
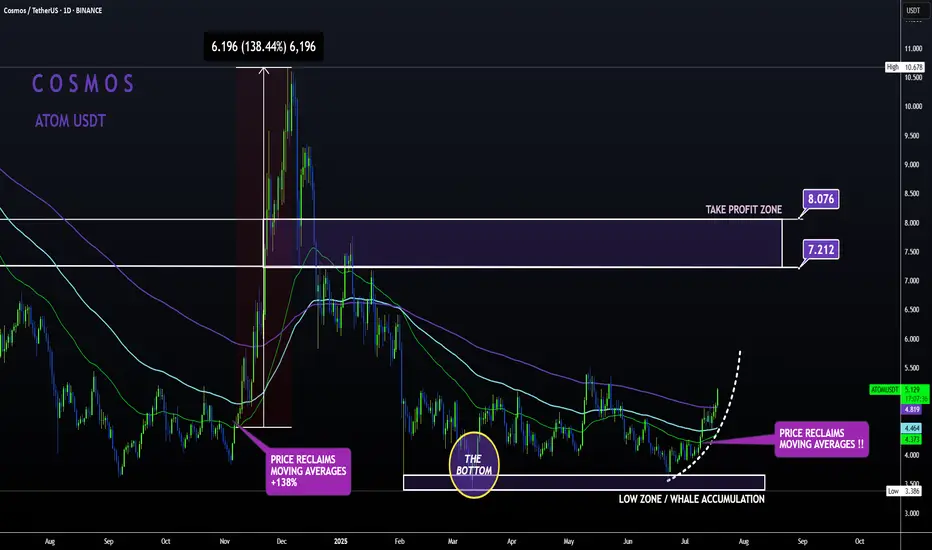
ATOM Sleeping GIANT ALT | Moving Averages BULLISH like NOV24'ATOM is slowly but surely making a turn up towards the first Take Profit point.
From the bottom, Cosmos has already increased a whopping 52% , with even more room to grow:
In my previous update, the 4 was still bearish when looking at trend lines and moving averages.
However, this has flipped to bullish from the 4h upward, with the price trading high above the moving averages in the 4h and in the daily timeframe:
4H:
Daily:
Note how previously, the big increases started as soon as the price regained the moving averages as support.
Bitcoin MA 50 crosses 100If history repeats, this could be even bigger gains soon ahead. The blue MA 50 just crossed the orange MA 100 which happened in Oct '24 as well as Oct '23 -- this time happening so soon could defy historical pattern, but with a possible Fed interest rate cut in the works, this could be huge.
After the recent Fed announcement that there would be no interest rate cuts at this time, the reason given was that the market was holding steady, though a recession was not entirely ruled out. If a recession starts to rear its ugly head before June 17th Fed meeting, they may change their outlook and enact interest rate cuts to ensure the economy can continue unscathed. Since Trump has walked back tariffs on China and is still working with the rest of the world to lower tariffs, the interest rates may not be cut in June.
What does this mean for Bitcoin?
A recession is still on the horizon, even without rate cuts and with lowered tariffs. The damage has already been done by tariffs, enough so that reports of impending empty shelves soon to hit stores this month is still a concern. People flock to other investment strategies when the market is so uncertain, hence Gold and Bitcoin getting their boosts recently.
It's my opinion that Bitcoin will continue to grow in price as investors scramble to keep their portfolios on an uptrend. The MA 50 and MA 100 crossing is a great signal and gives me confidence in a continuing uptrend.

BTCUSDT: Signals a 2-Week Retest—Trend Still Alive
BTC’s been wild, but zoom out to the 2-week chart— we’ve got a solid uptrend with higher highs and lows. Last week’s dip isn’t a reversal—it’s a retest of the 50-day EMA (around $64.8k as of March 10, 2025). Volume’s thinning, RSI’s looks oversold. Indicators flashed a ‘hold’ here—no sell signal yet, which tells me the trend’s got legs or at least a bounce.
Bullish Case : If BTC holds the retested level (e.g., a prior resistance-turned-support), it could resume upward momentum. A two-week stabilization suggests accumulation, and a break above the recent high could target the next psychological level (e.g., $90,000).
Bearish Risk : If the retest fails—price breaks below the key level with high volume—it could signal a deeper correction, potentially revisiting lower supports (e.g., $70,000 or $60,000). A two-week trend turning into a failed retest might indicate profit-taking or macroeconomic pressure with all the news.
It's worth just taking a zoomed out look, no panic just yet and let it play out a little more.

The algos have awoken. $NIO Short term squeeze?As soon as the Weinstein 30-week indicator trended up on the 1-minute chart (first time since the start of January), price rallied by 1% and heavy call buying pushed the options premium to the bullish territory.
As a result, the indicator is trending up on the 30-minute chart for the first time since last November. I think that a squeeze is highly likely to occur over the next few days.

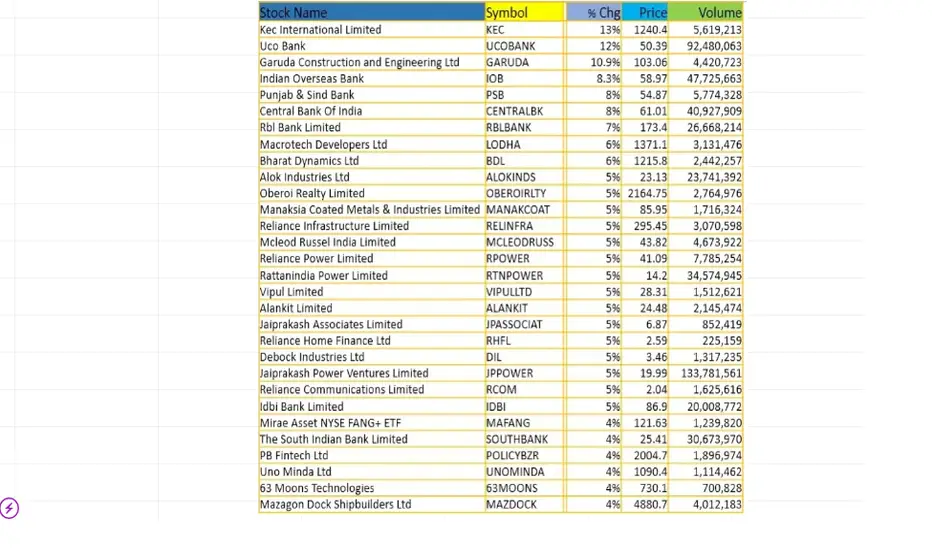
Best Intraday stocks technical & fundamental analysis| 3-jan2025Technical Analysis stocks (3-jan-2025)
follow us for more updates and information
message us for any stocks entry & exit and targets and related information.

Best Intraday stocks technical & fundamental analysis| 31Dec2024Technical Analysis of Moving average stocks (31/Dec/2024)
follow us for more updates and information
message us for any stocks entry & exit and targets and related information.

Best Intraday stocks fundamental-technical analysis |30 Dec 2024Fundamental Technical Analysis of Moving average stocks (30/Dec/2024)
follow us for more updates and information
message us for any stocks related information

Best Intraday stocks technical analysis | 27 Dec 2024Technical Analysis of Moving average stocks (20/Dec/2024)
follow us for more updates and information
message us for any stocks related information.

$SOL Short-Term Pain Ahead CRYPTOCAP:SOL price broke to the downside of the 50D SMA
Bearish Crossing from the 20D MA ahead.
Needs to hold critical support at $190 / .786 Fib
Another bearish day could dump CRYPTOCAP:SOL to $175 / .618 , and if that doesn’t hold the move should finish at $165 / 50% level.
RSI shows more downside for confluence.

Best Intraday stocks technical analysis | 19th Dec 2024Technical Analysis of Moving average stocks (19/Dec/2024)
follow us for more updates and information
message us for any stocks related information.

Best Intraday stocks technical analysis | 18th Dec 2024Technical Analysis of Moving average stocks (18/Dec/2024)
follow us for more updates and information
message us for any stocks related information.

Best Intraday stocks technical analysis | 17th Dec 2024Technical Analysis of Moving average stocks (16/Dec/2024)
follow us for more updates and information
message us for any stocks related information.

Best Intraday stocks technical analysis | 16th Dec 2024Technical Analysis of Moving average stocks (16/Dec/2024)
follow us for more updates and information
message us for any stocks related information.

Best Intraday stocks technical analysis | 12th Dec 2024Technical Analysis of Moving average stocks (12/Dec/2024)
follow us for more updates and information
message us for any stocks related information.

Intraday stocks for today (11/Dec/2024)Technical Analysis of Moving average stocks (11/Dec/2024)
follow us for more updates and information

Intraday stocks for trading (09/Dec/2024)Technical Analysis of Moving average stocks (09/Dec/2024)
follow for more updates and information

Intraday top stocks for trading (06/Dec/2024)Technical Analysis of Moving average stocks (06/Dec/2024)
follow for more updates and information

Intraday moving average stocks for (05/Dec/2024)Technical Analysis of Moving average stocks (05/Dec/2024)
follow for more updates and information
Intraday moving average stocks for (04/Dec/2024)Technical Analysis of Moving average stocks (04/Dec/2024)
follow for more updates and information
