ELLIOT WAVE | BIG INDUSTRIES BHDBIG industries Bhd
- Very hot stock past 2 weeks, waiting for another game play. Might be a profitable trade for swing trader
IDEA TRADING TEKNIKAL
1. Head and shoulder pattern spotted waiting for breakout confirmation with volume = sincere BO
2. Moving average tersusun cantik = strong uptrend
3. Entry level pada MA20 and MA50, TF daily
4. breakout downtrendline and able to succeed above + formation of HH and HL
IDEA TRADING FUNDAMENTAL
1. Quarter report 3 quarter constant making profit = something brewing
2. ROA, ROIC, ROE improve for 5 years
Movingaveragecrossover

Ripple price predictionThe Ripple price has plummeted to the lowest level since February as the stocks and cryptocurrency market fell. XRP is trading at $0.7161, about 23% below the highest point this month. It remains about 47% below the highest point in 2021, bringing its total market cap to about $33 billion. Other coins like Ethereum, Bitcoin, Solana, and Cardano have plunged.
The XRP price has plunged because of the ongoing concerns about the bond market. The ongoing bond sell-off has pushed yield prices to the highest level in years. The yields of the 10-year and 30-year are approaching the 3% mark. At the same time, there are signs that the yield curve inversion will continue for a while.
This performance has helped drag most cryptocurrencies and stocks down. The tech-heavy Nasdaq 100 index has fallen by more than 8% from this month’s highest level. Likewise, the Dow Jones and S&P 500 indices have not done well as investors anticipate a more hawkish Federal Reserve. The bank has already hinted that it will deliver several interest rate hikes this year.
Another reason why the XRP price has dropped sharply is the ongoing SEC vs Ripple case. The case is still dragging in court, and analysts expect the verdict to happen in this year’s second quarter.
The daily chart shows that the Ripple price has been in a strong bearish trend in the past few days. However, a closer look shows that this crash happened after the coin formed a rising wedge pattern ( A rising wedge is usually a bearish sign )
The coin has also moved below the 25-day and 50-day moving averages. The two have made a bearish crossover, signaling that the downward trend will continue. Therefore, the next key support level to watch will be at $0.62 ( the lowest level on February 24 this year ).

Here are all the reasons I still like Dogecoin!Traders,
Here are all the reasons I still like Doge here:
#1 RSI at 54 with lots of overhead room.
#2 After drawback, still above the 100 day
#3 Retracement was exactly 50% (just like BTC)
#4 Intersecting moving averages. 20 and 100 are intersecting right at support and just below the 50% fib retracement level, making this an extremely strong support level area.
My next target would be the 200 day overhead, a full 24%+ profit from current price.
Best to you all. LMK if you enter this trade here.
- Stewdam.us

Here are the coins that I've had to remove from "This Week's HotTraders,
I go through our list and remove 15 coins from the list, some of which have pumped and some which haven't. I'll give an explanation for the removal of each in the video. Six coins remain on the list. Link below.
⛓️ 🔗 Useful Links 🔗 ⛓️
(against house rules, see below)

Moving Average Cross Over StrategyWe start by creating a visual for when all moving averages are in order and across the 200 moving average . In this example, I have used a vertical line in the colour of our bias direction, Long(Green) , when this condition has been met. We now have an increased confidence by filtering out trade setups that do not meet our bias giving a higher probability and focus.
Levels of previous resistance give us a price that we can enter the market by turning into a new level of support . In this example I have highlighted this with a red arrow located on the left hand side.
Now we have a trading bias and a methodology to set price restrictions to enter the market, we can now trade only long positions and trade setups . In this example I have highlighted long opportunities that have been triggered with arrows in green located on the right hand side. Entry points can be executed on either the daily , 4hour or 1hour charts depending on risk and trading style preference. Please note - Lower time frames may generate more signals which presents more risk.

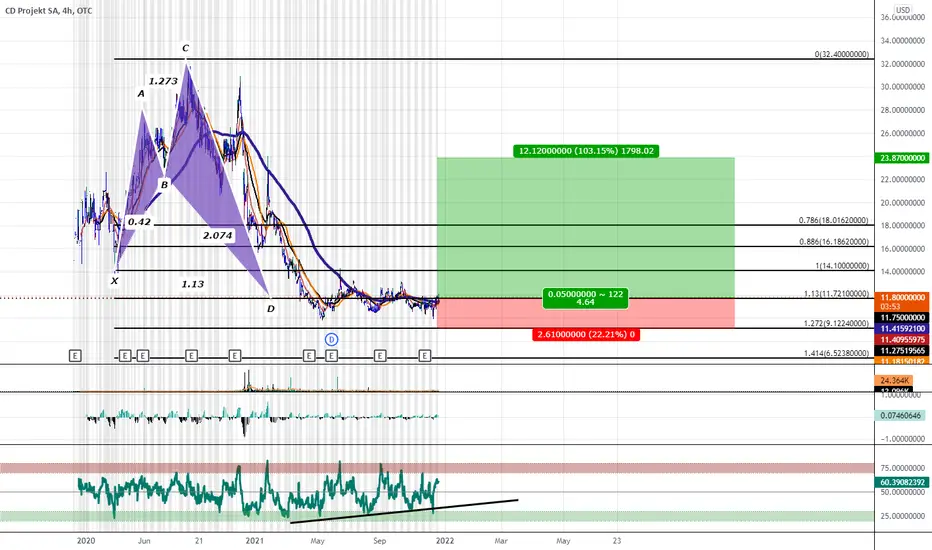
CD Projekt; Bullish Shark: Many Instances of Bullish DivergenceWe have been at this PCZ for awhile and showing many instances of bullish divergence now we can see that many of the moving averages have converged and it seems that we will be getting a golden cross pretty soon now may be the time for this game dev to rise once more.
First matured & clear Technical Analysis for BitCoin as long as we stay above this ma, and we creep a lil bit higher and higher to allow the moving averages to align themselves correctly. We will be ready for 100k soon. Although if that yellow crosses above the lighter yellow on daily, and this MFI indicator is at that dangerous level. GET OUT

THAILAND SET: SABUY LONG POSITION - PRE-BUY SUPERTREND SIGNALPRE-BUY SUPERTREND SIGNAL at Elliott Wave 4 AT 8.95 - CUTLOSS 7.90
Overall SET down due to COVID outbreak of Delta variance and lockdown 3.0 in 28 provinces

A short fall and a good price increase are on the wayThe last time the MA50D and MA200D intersected, we saw a price increase, and as the MA50D approaches the MA200D, I expect the price to rise. But given the bitcoin and USDT.D dominance position, we are a little more cautious.
The most important area of resistance and support seen in the past is 0.259 and $ 0.21, and considering the pattern of the three-star candlestick in the evening, I expect the price to fall to these support points.
Therefore, in three steps, 0.3, 0.259 and 0.2391, we make our purchase and set the loss limit at 0.2.

BYND Long SetupNASDAQ:BYND broke out of channel two days ago and has setup a favorable long trade.
Entry above today's high at 157.45
Stop loss under today's low at 151.47
Profit target has multiple options but I am going just under the resistance from 2/16/21 at 183.50
Risk/Reward ratio of 4.36

How I Find Trends In Markets Finding Trends in the market is a tool needed to stay on the right side of the trade.
Here I attempt to help you out by giving some tips that I have found through my 7 years of looking at the charts.
I have noticed that while the focus is on the avg close of the markets that isn't where trends take place in fact aiming for the avg is a good way to continuously lose on trades. In the video I show how to place trades based on the extremes Highs and Lows to aim for better returns while providing my insights on why looking at the market in these terms is better than standard way of looking at markets

BTC : How to watch the DEATHCROSS on the 1hrIf you want a front row seat to the infamous upcoming DEATHCROSS, go to the 1hr and set your MA's to the lengths shown in the chart.
// Durbtrade

APD repeating yearly pattern, golden cross into bull run??Hi. In this 1D chart I've plotted out the price increase of 2019 and 2020, marked their golden crosses in the first halves of the year and placed the resistance line from 2020 that the current golden cross could indicate will result in the price breaking through and rising past it during this year.
Keep in mind that the fundamentals of APD are also very good.
Thank you. Please if you have any thoughts or comments do leave them below and I would gladly discuss or adjust my interpretations and methods.
This does not constitute financial advice.
Any prices, even if explicitly stated, are presented with intent to discuss the symbol and potential interpretations.
Any trades shown or mentioned are examples and neither recommendations or mandates.

MMP is looking bullish NYSE:MMP is looking bullish, 200 MA and 50 MA are crossing and the stock is trading above 20 MA. The anticipated price movement is shown on the chart, buy now or wait for retest of the 50 MA with a trailing stop daily close below 50 MA, a break of 50$ confirms target around 60$.
Hit the like button please if you find this useful :)
This is only my own view and not financial advice, do your own analysis before buying or selling
Happy Trading!
MLong

$MINE Golden cross on the 1 hour chartThe hourly chart looks like we have a golden cross coming the next day or two. A golden cross is extremely bullish and price goes parabolic.
#goldencross #mine
Give the chart a like if you like what you see!
MLong

GBPCHF EMA's RIBBON strategy Simple and effectiveGBPCHF
Price has broadly moved above the EMA's ribbon its one of the easy method to predict the trend on September 08 the price felled below the ribbon and the selling happened rapidly. Whenever the ribbon is constricted the trend going to reverse and if the ribbon is widen enough still the upside/Downside momentum is intact
In GBPCHF the ribbon was turned upside and its showing some sign of bullish trend. The price trading around 50% Fibonacci level. We can expect short term downward play before the bullish run. Series of bullish candles are formed n H4 timeframe
The swing target would be 1.20500. Stop lose may placed below the 38.2% Fibonacci level
If you like our work give us a thumbs up. Donating via tradingview coins will make us to provide more valuable ideas

CLEAN AND PROFESSIONALEUR/USD Swing trade idea!
After a long rally to the upside, finally this pair is showing some reversal signs on daily TF. Looking for a head and shoulder to form on this pair and entering on the right shoulder with fibonacci and daily res confluences. Looking for price action to play out on 4h and 1h timeframes. If you are a more conservative trader you can wait for the trendline and daily support to break and retest to confirm your entry. #tradesafe #theforexdaddy

TRQ DailyHit my scanner this morning. PM volume was way up, has been in an uptrend since the 9EMA and 21EMA crossed over the 200MA.
Looking for entry. Excited about this chart.
TLong

NZDUSD short setupThe Kiwi has come under some selling pressure following the latest RBNZ decision, with the central bank expanding QE and giving their strongest hint yet at negative rates - they are in "active preparation."
NZDUSD dropped near a 1-month low in response after already closing below the 21 EMA for the 1st time since mid-May.
Bearish cross in 8/21 EMAs seen which could indicate trend has turned lower.
Conservative stop above recent high eg 67.20.
No fixed profit target but looking for a move to the low 60s.

THE BULLS ARE NOT GONE YET!!I'm sensing strong bullish pressure from the Daily Time-frame. Indicated to the left of the chart is a MA crossover between my Exponential & Weighted Moving Averages. Price recently bounced off of Daily Support towards the end of June. I expect the signal EMA to make a potential crossover with the 200 EMA.
(Orange Line) If that occurs i predict price movements towards Daily Resistance.
Comment below your analysis of GJ

GBP/USD LONG so im using for technical indicator is moving average 50,100,100
GBP/USD huge momentum for down but buys try to price push up 20 mar 24 buys momentum WAITING FOR COMING DEMAND AREA AND REJECT PRICE UP

Buying and selling the 50 & 200 MA made easyFirst mark matching crosses then switch to line break chart. Room for one mistake only i.e. whipsaw. NOT ADVICE. DYOR.

EURCHF 1D MA-X CROSSOVER STRATEGYTim's MA-X Strategy.
This is a Moving Average Crossover or MA-X Trading Strategy setup.
MA-X strategy consists of the 100 period simple moving average (SMA) in red,
and the 20 period exponential moving average in blue.
If the 20 ema is above the 100 sma then we only take buys or longs.
If the 20 ema is below the 100 sma the we only take selss or shorts.
*In this case price is above the 100 sma so we will only take buys or longs.
*This Pair has been in a nice uptrend foe some time.
*It's now pulled back below the 20 ema and consolidating below the 20.
*We are going to look for a close above the 20 ema to go long.
*This trade plan we buy a daily candle close above the 20 ema.
On the breaking candle to enter a full-sized position we want to the volume bar reach up to the volume average.
If it doesn't reach the average but does reach 75% of the average open a ½ size position to reduce risk.
You can calculate the percentage by dividing the first volume average by the second volume average.
You should at least get 75%, if you don't then stand aside on the trade.
The stop loss will be 1.5 x ATR.
The first target will be 1 x ATR.
So the way that works is you get your candle close above the 20 ema that's your entry point.
At that time you look at the ATR of that candle.
You multiply that by 1.5 to get your SL.
You measure that distance behind the entry and that will be your SL.
Then you measure 1 ATR above the entry and that will be your first target.
If after entering the trade the candle closes back below the 20 ema, tke the loss right then.
Do not wait for price to hit the SL.
Our intention is that a breakout above the 20 ema should be explosive and hit our target fairly quickly.
If the momentum goes away we want to shut the trade down without taking a full stop if possible.
When price hits our first target, close half the position for profit and set the SL to break even on the remainder.
Follow stops as price moves in our direction until the market takes us out.
These two rules are the very definition of cuttoing your losses and letting your winners run.
Typically does this by using two positions.
The first position has a stop loss and a take profit.
That position will close automatically when the first target is hit.
The second position will only have a stop loss and not take profit.
This is the position that will be allowed to run.
When the first target is hit we have to manually move our stop up to break even on the second position.
Risk only two percent of your trading account of each trade.
Each position will then only be 1%.
