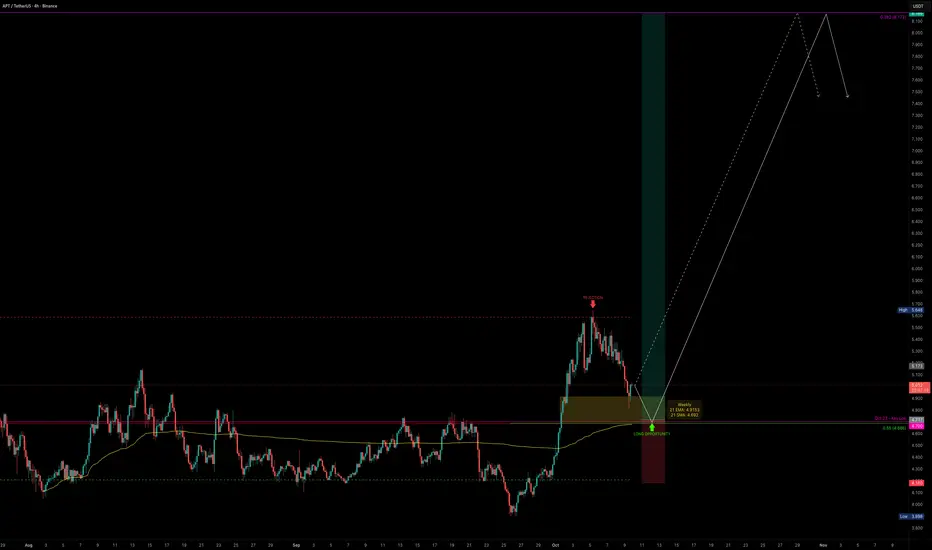
APT — 248 Days of Consolidation, Breakout PotentialAPT has been trading sideways for the past 248 days, building a massive base of consolidation. Things are starting to get interesting.
Recently, APT made its first real attempt to break above the yearly VWAP core (~$5.6) but got rejected, completing a 5-wave impulse right at this resistance zone. The rejection was no surprise: it lined up perfectly with the VAH of the 248-day trading range and the 4B market cap resistance at $5.69.
Now, after a strong impulse, we are in correction mode and this could set up the next major swing long opportunity.
🟢 Support Confluence Zone ($5.0–$4.5)
POC of 248-day range: $4.685
Anchored VWAP (from Aug low): sits right at the POC
Key Low (Oct 2023): $4.70
0.55 Fib retracement (of 5-wave impulse): $4.686
21 Daily EMA/SMA: $4.847 / $4.7
21 Weekly EMA/SMA: $4.915 / $4.69
200 4H EMA/SMA: $4.7 / $4.582
All confluences point to this being a critical support zone that bulls must defend.
🔴 Resistance Zone ($5.6–$5.7)
Yearly VWAP core (~$5.6)
VAH of 248-day range (~$5.6)
4B Market Cap resistance (~$5.69)
This zone remains the big wall to break. Once cleared with strong volume, upside potential opens significantly.
Freshly built (unpublished) Anchored VWAP Suite , which provides VWAP tracking:
Fair Value Trend Model :
Trade Setup
Long Entry: Ladder between $5.0–$4.5
Invalidation: Below VAL of range
Targets: $5.7 (major resistance), $7 (Fair Value), $8.172 (0.382 Fib)
Potential swing setup with R:R of 1:6+
Possible gain of +70% if structure holds and volume confirms breakout
Quick Take
APT is sitting at one of the most important support zones of the year. If this base holds, it sets up a high-probability swing long with great upside potential. All eyes are on whether bulls can reclaim momentum and finally break through the $5.7 wall.
🔍 Indicators used
Multi Timeframe 8x MA Support Resistance Zones → to identify support and resistance zones such as the weekly 21 EMA/SMA.
Fair Value Trend Model → Calculates a regression-based fair value curve
➡️ Available for free. You can find it on my profile under “Scripts” and apply it directly to your charts for extra confluence when planning your trades.
_________________________________
💬 If you found this helpful, drop a like and comment!
Movingaveragestrategy
LINK — Massive $20 Support Zone, Wave 5 Loading?I haven’t seen this much confluence stack in one place for LINK in a long time. The $20–$19 zone is absolutely packed with technical factors, making it a critical level to hold for bullish continuation.
🧩 Confluence at $20–$19
Golden Pocket: $20.19 (0.618) → $19.59 (0.666)
Yearly VWAP: $18.87
21 Weekly EMA/SMA: $19.68 / $18.39
Yearly Open: $20.02
0.666 Fib Speed Fan: aligned with $20 zone
1.0 Trend-Based Fib Extension: at $20 → completion of wave 4
Pitchfork Buy Zone: 0.702–0.75 levels right at $20
Midpoint of 1-Year Trading Range
Anchored VWAP (from $30.94 high, 287 days): $19.55
Daily Level: $19.66
Weekly Level: $19.28
Monthly Level: $19.27
Yearly Level: $19.51
🟢 Long Setup
We’ve already seen a bounce from $20, confirming demand at this zone.
Plan: Buy now and add on retracements if price dips back toward $20/$19.
Stop-Loss: Below 21 SMA weekly at $18.39
TP1 → $30 psychological resistance & prior key high
TP2 → $34.57 (0.618 Fib retracement)
This setup offers an R:R of 1:7+ with a possible yield of +70% if played toward TP2.
Structure Outlook
With this stacked confluence, it looks like wave 4 has completed and LINK could be ready for its next leg up. The $20 zone is make-or-break, and as long as it holds, the case for bullish continuation remains strong.
Indicators used
DriftLine — Pivot Open Zones → For identifying key yearly/monthly/weekly/daily opens that act as major S/R reference points
Multi Timeframe 8x MA Support Resistance Zones → to identify support and resistance zones such as the Weekly 21 EMA/SMA.
➡️ Available for free. You can find it on my profile under “Scripts” and apply it directly to your charts for extra confluence when planning your trades.
_________________________________
💬 If you found this helpful, drop a like and comment!

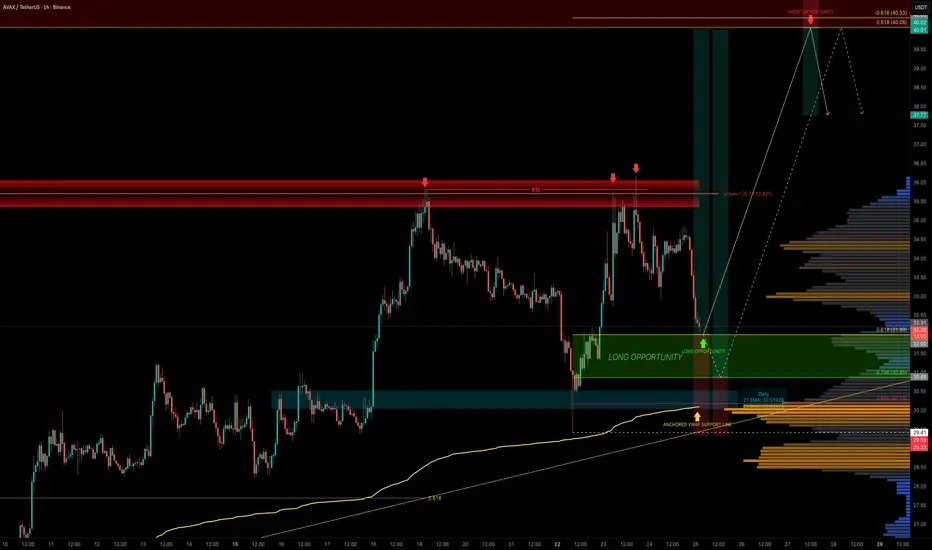
AVAX — Next Stop $40?AVAX has been one of the stronger high-cap performers recently, but the yearly open at $36 has proven to be a tough ceiling. Price has rejected this level three times already, each time offering short opportunities. This level also aligns with the 15B market cap, making it a key resistance zone.
Now, AVAX is retracing into a prime area for long setups, retracing part of the recent 5-wave impulse.
🟢 Long Entry Zone
0.618 Fib retracement: $32 → first bounce zone
0.786 Fib retracement: $30.85 → deeper entry opportunity
0.886 Fib retracement: $30 → highest confluence long entry
Invalidation: Below $29.41 (origin of the impulse)
Confluence at $30
The $30 level is the strongest support cluster, backed by multiple technical factors:
POC of this trading range
0.886 Fib retracement of the impulse
21 EMA/SMA (daily timeframe)
Anchored VWAP support
$30 psychological round number
0.618 Fib speed fan support
This makes laddering entries from $32 down to $30 the most optimal approach.
Targets
First Target: $36 yearly open → retest of major resistance (fourth attempt)
Main Target: $40 resistance cluster → 0.618 Fib retracement, negative -0.618 Fib extension
R:R: 1:3 up to 1:6 depending on entry
Educational Insight
When analysing trades, confluence is king. A single indicator may provide a signal, but when multiple tools align at the same level the probability of that zone holding increases significantly.
The $30 zone for AVAX is a great example of confluence stacking. This doesn’t guarantee success, but it gives traders a defined edge with a clear invalidation point. The same logic applies to resistance: at $40, multiple technical layers align, making it a high-probability take-profit zone.
Quick Take
AVAX is pulling back into a stacked support zone. With solid confluence at $30–$32, this zone sets up the fourth attempt at breaking the $36 yearly open resistance.
And as the saying goes in trading: the 4th touch often breaks. If it does, AVAX could quickly rally toward the $40 resistance cluster, where multiple confluences align.
Indicators used
DriftLine — Pivot Open Zones → For identifying key yearly/monthly/weekly/daily opens that act as major S/R reference points
Multi Timeframe 8x MA Support Resistance Zones → to identify support and resistance zones such as the Daily 21 EMA/SMA.
LuxAlgo — Liquidity Sentiment Profile (Auto-Anchored)
➡️ Available for free. You can find it on my profile under “Scripts” and apply it directly to your charts for extra confluence when planning your trades.
_________________________________
💬 If you found this helpful, drop a like and comment!
AVAX — 220-Day Range Broken, Next Stop $35?After 220 days of consolidation, AVAX has finally broken out of its trading range. The key resistance at $27 was cleared, and price quickly pushed into the $30 psychological level, where it faced rejection. Currently, AVAX is consolidating just below, around $29.
So, what’s next? Now all eyes are on the retest to confirm $27 as the new launchpad.
Support Confluence (Long Entry Zone)
3M/Quarterly level: $27.71 → major support
0.382 Fib retracement: $27.65 (low $23.87 → $30)
0.5 Fib retracement: $26.93 → perfectly aligned with $27 zone
Swing High: $27.38 → could be retested
4H 21 EMA: $27.71
4H 21 SMA: $27.41
Weekly VWAP: $27.41
Fair Value Gap (FVG): imbalances in this zone
📌 With all these layers of confluence, the $27.7–$27.4 zone is the ideal long entry area.
Resistance Confluence (Take Profit Zone)
0.5 Fib retracement of the entire downtrend: $35.22
15B Market Cap resistance: $35.5
Yearly Open: $35.7 → major target
3M/Quarterly level: $35.71
TPO resistance cluster: $35.22–$37.28
📌 Together, these levels form a stacked resistance zone at $35–$37, making it both the ideal take-profit area and a potential short setup.
Zoomed-Out View:
TPO Chart Reference:
🟢 Long Trade Setup
Entry Zone: $28.0 → $27.4 (DCA best approach)
Stop-Loss: Below $26 (to be adjusted after reversal confirmation)
Take Profit: $35
Potential Gain: +25%
R:R: 1:4+
Technical Insight
After 220 days of sideways compression, the breakout above $27 marks a shift in market structure.
A retest of this level would validate it as new support and provide a high-probability swing long setup.
The $35–$37 zone, reinforced by the yearly open at $35.7, stands out as the major resistance cluster, making it both the ideal profit target and a potential reversal area.
Key Levels to Watch
Support Zone: $28–$27
Resistance Zone: $35–$37
🔍 Indicators used
DriftLine — Pivot Open Zones → For identifying key yearly/monthly/weekly/daily opens that act as major S/R reference points
Multi Timeframe 8x MA Support Resistance Zones → to identify support and resistance zones such as the 4H 21 EMA/SMA.
➡️ Available for free. You can find it on my profile under “Scripts” and apply it directly to your charts for extra confluence when planning your trades.
_________________________________
💬 If you found this helpful, drop a like and comment!

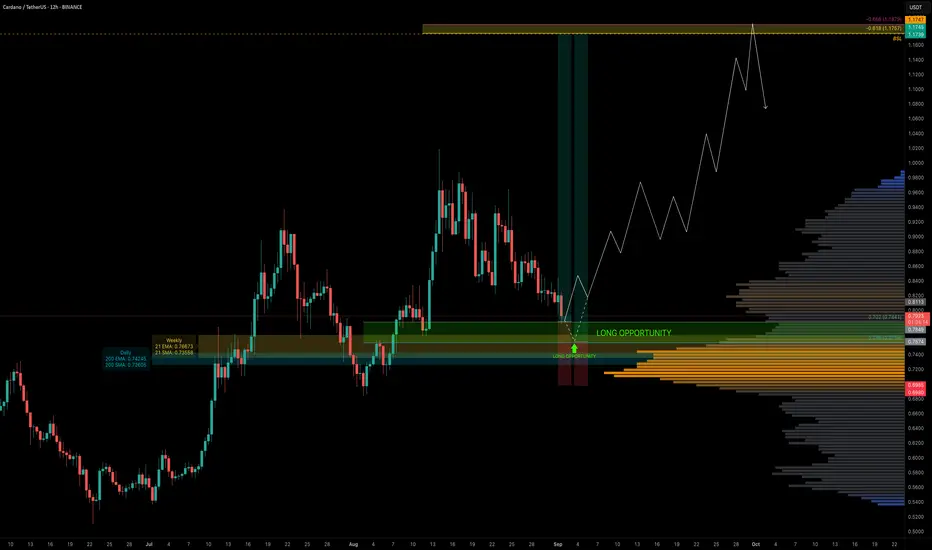
ADA — Fib Harmony With EMA/SMA SupportADA has been in a downtrend for the past 18 days and is now approaching a cluster of key support levels. Today, price tapped the 0.702 Fib retracement ($0.7841) — an optimal area for long entries.
The main focus, however, is the 0.786 Fib retracement, which aligns with a liquidity pocket and multiple layers of confluence, making it the most ideal entry zone.
🧩 Confluence at 0.702–0.786 Fib Zone
0.702–0.786 Fib retracement → prime long entry range
Liquidity pocket → sitting around the 0.786 Fib
200 EM ($0.7424) / 200 SMA ($0.726) (daily)
21 EMA ($0.766) / 21 SMA ($0.735) (weekly)
Pitchfork lower support line → intersecting the zone
0.618/0.666 Fib Speed Fan → adding another support layer
🟢 Long Trade Setup
Entry Zone: 0.702–0.786 Fib retracement
Best Entry: Around the 0.786 Fib
Stop-Loss: Below $0.70 (to be adjusted after seeing more price action)
Target (TP): $1.1757 (–0.618 Fib, in confluence with key high & buy-side liquidity at $1.1747)
Potential Move: +50%
R:R: ~1:4.5 up to 1:7 (depending on entry)
Technical Insight
ADA is testing deeper retracements within its current downtrend, the 0.702–0.786 Fib zone combines structural, dynamic, and liquidity-based confluence.
The added support of the weekly 21 EMA/SMA strengthens this area as a pivotal level for bulls to defend.
If held, this zone could fuel a swing long setup with great upside potential.
The $1.1747–$1.1757 zone is both a high-confluence take-profit area and a potential short opportunity, given the liquidity resting above that level.
🔍 Indicators used
LuxAlgo — Liquidity Sentiment Profile (Auto-Anchored)
Multi Timeframe 8x MA Support Resistance Zones → to identify support and resistance zones such as the weekly 21 EMA/SMA
➡️ Available for free. You can find it on my profile under “Scripts” and apply it directly to your charts for extra confluence when planning your trades.
_________________________________
💬 If you found this helpful, drop a like and comment!
DRIFT — No More Drifting, Breakout ImminentDRIFT has been trading sideways in a 226-day range, capped by resistance at $0.75. The POC of this entire range sits at $0.6, and price is currently trading above it at $0.62.
Volume spikes within the range show solid participation, and the structure is starting to resemble a Head & Shoulders formation with a neckline at $0.75 that needs to break.
Bullish Confluence (Support Zone)
Trading above:
21 Daily EMA ($0.593) / SMA ($0.592)
21 Weekly EMA ($0.577) / SMA ($0.549)
200 Daily EMA ($0.5828) / SMA ($0.5483)
Monthly Open → $0.5888
0.618 Fib retracement of current move → $0.5987 (long trigger)
Clear invalidation: below weekly 21 SMA ($0.549) / daily 200 SMA ($0.5483)
Resistance Confluence (Target Zone $1.3–$1.38)
nPOC of the end 2024 / early 2025 trading range → $1.3
0.786 Fib retracement → $1.2935
0.382 Fib retracement of entire downtrend → $1.3056
0.618 Fib retracement of smaller wave → $1.3677
Yearly Open → $1.3664
500M Market Cap → $1.38
📌 This creates a resistance cluster between $1.3–$1.38, an ideal take-profit zone and potential short opportunity.
🟢 Long Setup Idea
Entry: $0.62–$0.60 (ladder in near confluence with Fib + support levels)
Stop: Below $0.55 (weekly 21 SMA/ daily 200 SMA invalidation)
Targets:
TP1: $1
TP2: $1.3
Potential Gain: +115%
Quick Take
If $0.75 breaks, DRIFT could move quickly toward $1.3–$1.38, a zone stacked with resistance and confluences, the perfect place to secure profits/look for a short setup.
Key Levels
Support: $0.62–$0.60 (Fib + POC + EMAs)
Resistance: $0.75 neckline, then $1.3–$1.38 (confluence cluster)
🔍 Indicators used
LuxAlgo — Liquidity Sentiment Profile (Auto-Anchored)
DriftLine — Pivot Open Zones → For identifying key yearly/monthly/weekly/daily opens that act as major S/R reference points
Multi Timeframe 8x MA Support Resistance Zones → to identify support and resistance zones such as the weekly 21 EMA/SMA.
Fair Value Trend Model → Calculates a regression-based fair value curve
➡️ Available for free. You can find it on my profile under “Scripts” and apply it directly to your charts for extra confluence when planning your trades.
_________________________________
💬 If you found this helpful, drop a like and comment!

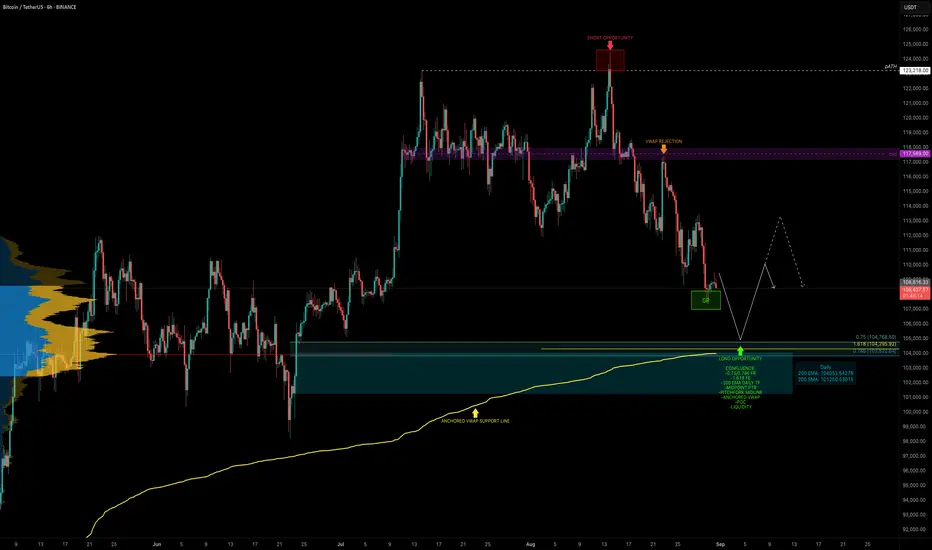
BTC — Identifying High-Probability Long Zone With ConfluenceBTC has been in a 17-day downtrend since the swing failure at the ATH (~$124.5K). That move acted as both a bull trap and the completion of a 5-wave structure, offering an excellent short entry at the highs.
Now the key question: where is BTC heading next, and where is the next high-probability trade setup?
Current Situation
BTC is sitting at the 0.618 Fib retracement ($108,236) of the move from $98.2K → $124.5K. Many traders are already buying this level, which is valid but a deeper zone below offers stronger confluence.
🧩 Confluence Zone: $105K–$104K
POC of the previous trading range → ~$104K
0.75 Fib retracement: $104,768.5
0.786 Fib retracement: $103,823
Anchored VWAP (from swing low $74,508) → just above the 0.786 Fib
Midpoint of the previous 60-day range
Liquidity cluster → positioned around $105K–$104K
1.618 Fib extension target: $104,296
Pitchfork midline → supporting this level
200 EMA (daily) → adding dynamic support at ~$104K
This creates a high-confluence support cluster between $105K–$104K, making it the next strong long setup.
🟢 Long Trade Setup
Entry Zone: $106K–$104K
Stop-Loss: Below $103K
TP: $110K-$114K
R:R Potential: 1:2+
Technical Insight
The ATH rejection confirmed both bullish exhaustion and a completed 5-wave move, triggering the current correction.
While the 0.618 retracement offers valid support, the $105K–$104K zone holds significantly stronger confluence.
This makes it the most attractive high-probability long entry zone in the current structure.
🔍 Indicators used
Multi Timeframe 8x MA Support Resistance Zones → to identify support and resistance zones such as the daily 200 EMA/SMA.
➡️ Available for free. You can find it on my profile under “Scripts” and apply it directly to your charts for extra confluence when planning your trades.
_________________________________
💬 If you found this helpful, drop a like and comment!
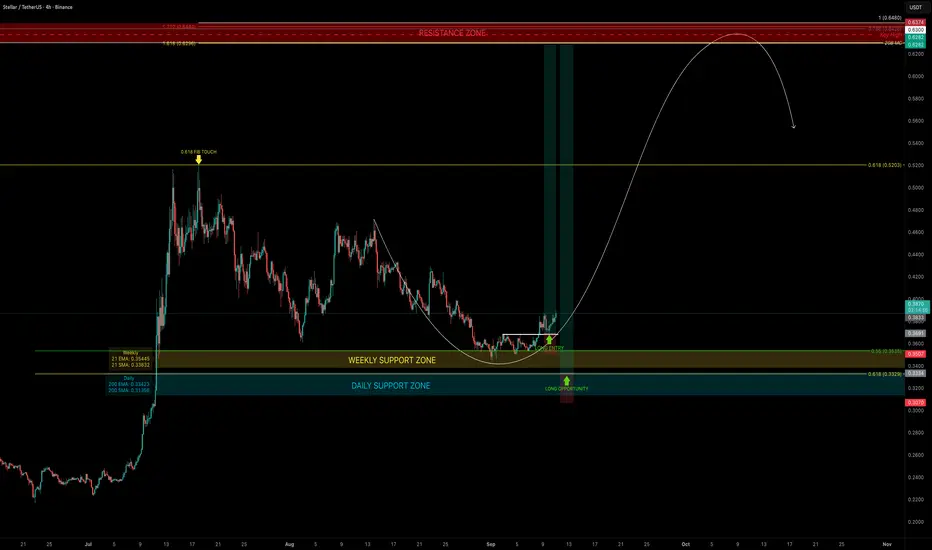
XLM — Correction Ending, Rally Loading?XLM recently found support at the 0.55 Fib retracement, in confluence with the 21 EMA/SMA on the weekly timeframe, triggering a bounce. The ideal 0.618 long entry unfortunately did not come into play.
Support Confluence
21 EMA (weekly): $0.3536
21 SMA (weekly): $0.3384
200 EMA (daily): $0.33425
200 SMA (daily): $0.3136
This cluster around $0.35–$0.31 forms a strong dynamic support zone and a great range for DCA laddering.
Resistance Confluence (Take Profit Zone $0.63–$0.65)
20B Market Cap Resistance: ~$0.63
Key High (Buy-Side Liquidity): $0.6374
0.786 Fib retracement: $0.6426
1.0 Trend-Based Fib Extension: $0.648
1.618 Fib Extension: $0.6296
Together, these create a stacked resistance cluster between $0.63–$0.65 → ideal take-profit zone and potential short setup.
🟢 Trade Plan
Best Entry: Laddering (DCA) from current levels down toward $0.31
Stop-Loss: Flexible depending on DCA strategy, clear invalidation below $0.31
Target (TP Zone): $0.63–$0.65
Technical Insight
The bounce from the 0.55 Fib retracement + weekly 21 EMA/SMA shows bulls defending this zone.
With strong dynamic support below and a stacked resistance confluence cluster at $0.63–$0.65, XLM may be setting up for a 70%+ rally.
DCA remains the best approach, as laddering down toward $0.31 allows flexible positioning.
Key Levels to Watch
Support: $0.35–$0.31 (EMA/SMA cluster, DCA zone)
Resistance / TP: $0.63–$0.65 (Fib, extensions, market cap confluence)
🔍 Indicators used
Multi Timeframe 8x MA Support Resistance Zones → to identify support and resistance zones such as the weekly 21 EMA/SMA.
➡️ Available for free. You can find it on my profile under “Scripts” and apply it directly to your charts for extra confluence when planning your trades.
_________________________________
💬 If you found this helpful, drop a like and comment!
XRP — $2.5 Liquidity Zone Could Trigger the Next RallyAfter hitting a new all-time high (ATH) on 18th July, XRP failed to hold the previous ATH ($3.40) as support. This breakdown led to a –25% drop, finding support at the 0.5 Fib retracement of the $1.90 → $3.66 move, followed by a solid +24% bounce back to the pATH (200B MC at $3.36) and 0.702 Fib retracement → an ideal short opportunity.
Now XRP has been trending in a descending triangle pattern for 50 days, with $3 acting as the key resistance. This level is the Point of Control (POC) of the last 75-day trading range, adding weight to its importance. On top of that, the anchored VWAP (~$3.035) is currently reinforcing $3 as additional resistance.
🧩 Confluence Support Zone ($2.665–$2.45)
Liquidity cluster: many stop-losses reside here
Anchored VWAP (support): ~$2.62
Yearly anchored VWAP: $2.59 → strong support level
Golden Pocket (0.618–0.666): $2.5777–$2.4936
21 EMA ($2.665) / 21 SMA ($2.576) (weekly): dynamic HTF support
233 EMA ($2.44) / 233 SMA ($2.53) (daily): strong moving average cluster
Market Cap Support: $2.52 aligns with the $150B level
1.0 Trend-Based Fib Extension: $2.4498 → aligning perfectly with the $2.5 support zone as a reversal point
This creates a high-probability long entry zone between $2.665–$2.45, with multiple overlapping technical factors.
🟢 Long Trade Setup
Entry Zone: $2.665–$2.45
Stop-Loss: Below $2.25 for now, to be adjusted once price action confirms a reversal.
Potential Gain: up to +60% depending on execution
Technical Insight
After 50 days of correction, XRP is approaching a major liquidity and confluence zone.
The golden pocket, VWAP, EMA/SMA clusters, market cap support, and 1.0 Fib extension all stack together at around $2.5, making it a powerful reversal point.
Meanwhile, $3 remains the key resistance, reinforced by the POC of the last 75-day range and the anchored VWAP (~$3.035). Bulls must reclaim this level to confirm bullish continuation.
Key Levels to Watch
Support: $2.665–$2.45 (reversal zone)
Resistance: $3.00
🔍 Indicators used
Multi Timeframe 8x MA Support Resistance Zones → to identify support and resistance zones such as the weekly 21 EMA/SMA.
➡️ Available for free. You can find it on my profile under “Scripts” and apply it directly to your charts for extra confluence when planning your trades.
_________________________________
💬 If you found this helpful, drop a like and comment!

LINK — The $20 Pivot ZoneLINK has been in a corrective phase, dropping –21% in the past 10 days. The big question: where is the next high-probability long entry?
Looking at the liquidity, there’s a clear pocket between $21–$20 where many stop-losses are positioned. Let’s break down the confluences.
🧩 Confluence Support Zone ($21–$20)
0.618 Fib retracement of the move: $20.19 → sits right in the liquidity pocket
Yearly Open (yOpen): $20.02 → major confluence
Psychological level: $20 key support
Trend-based Fib extension 1.0: $21.04 → ideal entry zone
Anchored VWAP: ~$20.85 → additional support
55 EMA ($20.835) / 55 SMA ($20.33) (daily): strong dynamic support cluster
0.73 Fib Speed Fan: aligning with the zone
Imbalances (FVG): could be filled here
Together, these create a solid support range between $21–$20 for long positioning.
🟢 Long Trade Setup
Entry Zone: $21–$20
Stop-Loss: Below golden pocket / yearly open
Target (TP): $30.94 (key high + potential short opportunity)
Potential Move: +50%
R:R: 1:5+
🔍 Indicators used
DriftLine — Pivot Open Zones → For identifying key yearly/monthly/weekly/daily opens that act as major S/R reference points
Multi Timeframe 8x MA Support Resistance Zones → to identify support and resistance zones such as the daily 55 EMA/SMA.
➡️ Available for free. You can find it on my profile under “Scripts” and apply it directly to your charts for extra confluence when planning your trades.
_________________________________
💬 If you found this helpful, drop a like and comment!

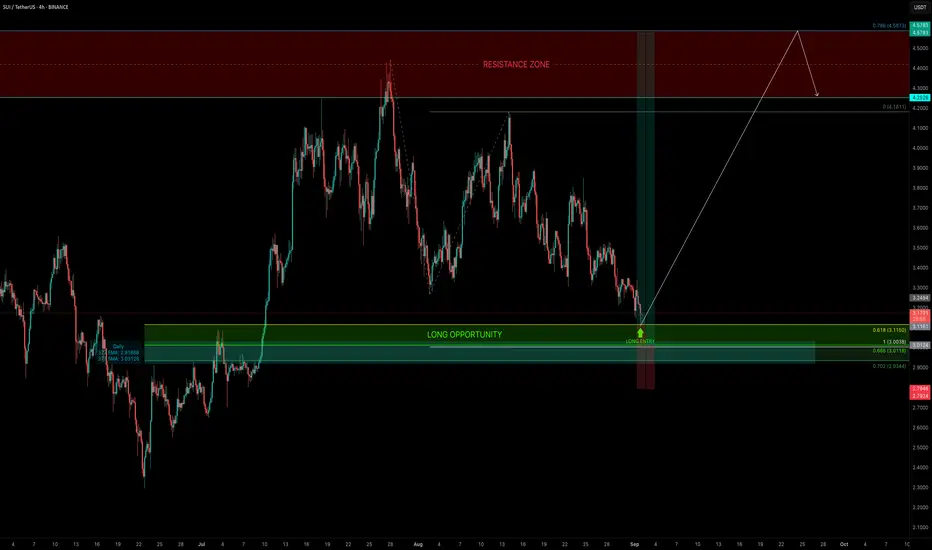
SUI — The $3 Confluence ZoneFor almost 2 months, SUI has been trading sideways in a range between $4 and $3. Today, price tapped the 0.618 Fib retracement ($3.115) of the entire move and bounced, giving a clean long trigger.
Looking ahead, the 1.0 trend-based Fib extension sits at $3.00 → a psychological key level in confluence with the 0.666 Fib retracement, making it the ideal long entry if price sees another drop.
🧩 Confluence Support Zone
0.618–0.702 Fib retracement → primary long entry range
Trend-based Fib extension 1.0: $3.00
0.666 Fib retracement: overlapping $3.00
377 EMA (daily): $2.919
377 SMA (daily): $3.03
🟢 Long Trade Setup
Entry Zone: $3.115 (0.618) → down to $3.00 (extension + retracement confluence)
Best Entry: Around $3.00
Stop-Loss: Below $2.80 (beneath 377 EMA support)
Target: Range highs
Potential Move: +50%
R:R: 1:5+
🔍 Indicators used
Multi Timeframe 8x MA Support Resistance Zones → to identify support and resistance zones such as the weekly 21 EMA/SMA.
➡️ Available for free. You can find it on my profile under “Scripts” and apply it directly to your charts for extra confluence when planning your trades.
_________________________________
💬 If you found this helpful, drop a like and comment!
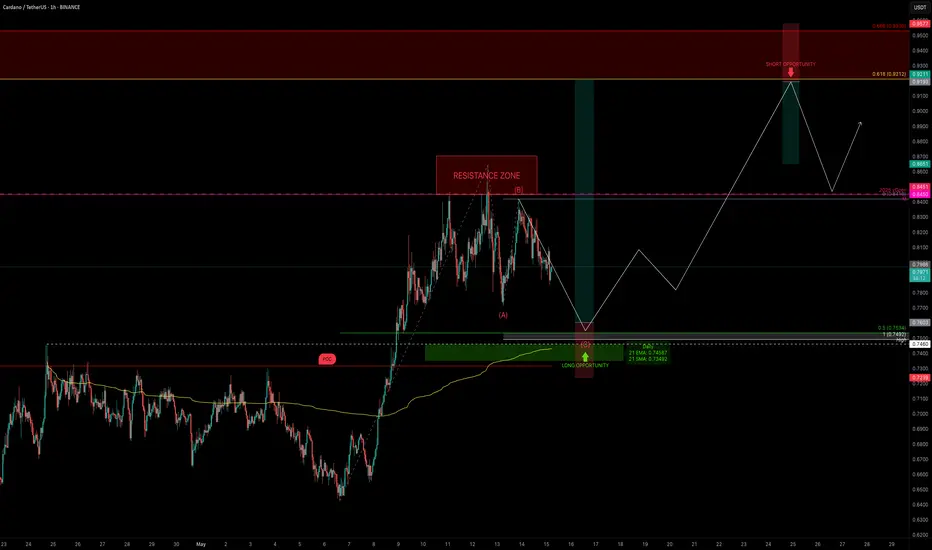
SUI — Where Liquidity Turns Into OpportunitySUI has been trading sideways for the past 40 days, offering solid swing opportunities both long and short. At the moment, there is one long setup that stands out → the $3.33 zone, where multiple layers of confluence align.
🧩 Confluence Factors: 5
1.0 Trend-Based Fib Extension: $3.3319
Prior Low: $3.3272 → potential liquidity sweep (SSL)
Anchored VWAP: Supporting the zone
Weekly 21 EMA / SMA: Acting as dynamic support
40d Range Context: Range low positioning
🟢 Long Trade Setup
Entry Zone: ~$3.33 (liquidity sweep into support)
Stop-Loss: Below $3.25
Target: Range highs near $4.20
R:R Potential: 1:10+
Note: Wait for bullish confirmation (order flow or strong reaction) before entering.
Technical Insight
The $3.33 level combines liquidity, fib projection, VWAP support, and the weekly 21 EMA/SMA → all pointing to a high-probability reaction zone. In sideways environments, such confluence at range lows often defines pivot points for the next swing move. If defended, upside targets remain the range high around $4.20.
🔍 Indicators used
Multi Timeframe 8x MA Support Resistance Zones → to identify support and resistance zones such as the weekly 21 EMA/SMA.
➡️ Available for free. You can find it on my profile under “Scripts” and apply it directly to your charts for extra confluence when planning your trades.
_________________________________
💬 If you found this helpful, drop a like and comment!

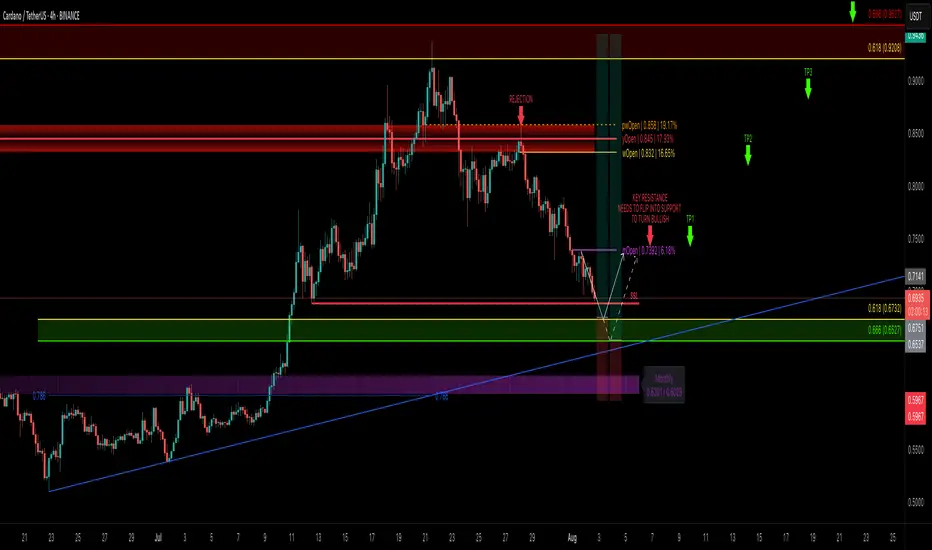
ADA Correction Nearing Completion — Is It Time to Load Up?After tagging the golden pocket resistance zone between $0.9208–$0.9527, ADA completed a clean 5-wave Elliott impulse right into a major resistance. Since then, price has corrected -25%, and we’re now likely nearing the end of an ABC correction — the final wave C.
🧩 Technical Breakdown
➡️ Wave A: 5-wave drop after the peak
➡️ Wave B: Bounce rejected at yearly open (yOpen) — that was a great short opportunity around $0.845
➡️ Wave C: Now working toward completion
🎯 C Wave Target Zone: $0.69–$0.65
This zone has strong confluence:
0.618 Fib retracement of the entire 5-wave move at $0.6732
1.0 TBFE (Trend-Based Fib Extension) aligns perfectly
Sell-side liquidity (SSL)
0.786 Fib Speed Fan support
Monthly 21 EMA/SMA adding a final confluence layer
🟢 Long Setup
Entry Zone: $0.69–$0.65 (ladder in)
Stop Loss: Below the monthly 21 EMA/SMA ($0.6)
Target 1: mOpen key resistance
Target 4: 0.666 Fib at ~$0.95
Risk:Reward: ~1:4+
💡 Educational Insight
After a 5-wave impulsive move, ABC corrections are common. Using the Trend-Based Fib Extension tool to project wave C, especially when paired with liquidity zones, VWAP, or moving averages, helps pinpoint high-probability reversal zones. It’s about confluence and reaction — not prediction.
🔍 Indicators
For this analysis, I’m using my own indicators
DriftLine – Pivot Open Zones and
MFT MA Support/Resistance Zones
both available for free. You can find them on my profile under “Scripts” and apply them directly to your charts for extra confluence when planning your trades.
_________________________________
💬 If you found this helpful, drop a like and comment!
NEAR’s Pullback Zone Found — Is $4 Next?NEAR just pulled off a +50% rally from the 0.618 Fibonacci retracement at $2.224 — a strong show of force from the bulls. After that explosive move, price is now cooling off in a consolidation phase, preparing for the next leg higher.
🟢 Long Setup — Dip Before Lift?
The next high-probability long zone lies between:
$3.026 – $2.94
Possible but less likely of a deeper dip to $2.78 (0.5 Fib of the recent move)
Long entries can be laddered between $3.00 and $2.90 (even $2.80 if volatility kicks in).
Stop-Loss: Below the daily 21 EMA ($2.7344) and 21 SMA ($2.6739)
Target: $4.00
R:R: ~4:1 — clean and structured
This setup aligns with standard continuation behaviour after strong impulses — consolidation, retrace, and resume.
🔴 Short Setup (on Rejection at $4.00)
Entry: ~$4.00
Stop-Loss: Above $4.25
Target: Yearly open (~$3.65)
R:R: ~1.5:1 — not ideal, but valid on confirmation
🎯 Summary
NEAR is consolidating after a strong move — either ready to continue higher or retest deeper into Fib support
Long zone: $3.00–$2.90 (poss. $2.80)
Short zone: $4.00 (on rejection only)
Simple structure, clean risk, and nothing forced — exactly how it should be.
Sometimes, less is more. Let price show the next move. Stay ready. 📈
___________________________________
If you found this helpful, leave a like and comment below! Got requests for the next technical analysis? Let me know.

ADA Correction Nearing Completion — Trade It Like a ProADA is respecting structure beautifully and currently consolidating after completing a 5-wave impulse move. The key question now is: where are the next high-probability trade setups?
Let’s break it down step by step.
Market Structure & Elliott Context
ADA has completed a full 5-wave bullish sequence, and—as expected—is now in a correction phase. This appears to be forming a classic ABC correction.
Using the Fibonacci retracement tool:
0.5 retracement of the entire move sits at → $0.7534
This aligns perfectly with the previous swing high at $0.746 — a level that has yet to be retested
The 1:1 trend-based Fib extension of a potential ABC correction puts Wave C at → $0.7492
Confluence Check:
This entire support zone (~$0.75) is stacked with technical alignment:
✅ Previous swing high: $0.746
✅ 0.5 Fib retracement: $0.7534
✅ 1:1 extension: $0.7492
✅ Daily 21 EMA: $0.7455
✅ Daily 21 SMA: $0.7347
✅ Point of Control (POC): ~$0.7318
✅ Anchored VWAP: Also sitting in this zone
✅ Pitchfork golden pocket: Aligns as dynamic support
All of these support indicators point to one thing: this ~$0.75 zone is a high-probability long entry area.
🟢 Long Setup
Entry zone: Ladder between $0.77 – $0.75
Average entry: ~$0.76
Stop-loss: Below $0.7318 (under POC)
Target: $0.9212 (0.618 retracement of the recent down wave)
R:R: ~5:1
Potential upside: +22%
🔴 Short Setup (on Rejection Only)
Entry: $0.9212 (0.618 Fib retracement of downtrend)
Stop-loss: Above 0.666 Fib → ~$0.958
Target: previous swing high or yearly open
R:R: ~1.4:1 (it can be adjusted tighter upon confirmation)
This short setup isn’t ideal in terms of R:R unless we see clear rejection. But with confirmation — like an SFP, bearish engulfing, or divergence — the stop can be tightened, making the risk-to-reward much more favourable.
📘 Educational Insight: Why Structure Beats Emotion
In trading, the strongest setups occur where multiple tools converge—Fib levels, EMAs, VWAP, volume zones, and past price action. When these align, it’s not about guessing—it’s about preparing.
The key is to wait for structure to come to you, not the other way around. Patience allows clarity. Clarity allows precision. And precision pays.
💡 Final Thoughts
The plan is clear. Levels are set. Now it’s just observation and discipline.
Good trades don’t chase attention — they present themselves to those who wait.
___________________________________
If you found this helpful, leave a like and comment below! Got requests for the next technical analysis? Let me know.
XRP Correction Complete? — Long Setup Aligned with Fib & OBXRP has completed a 5-wave impulse move. As expected, XRP is now in a corrective phase, pulling back after rejecting from a key resistance — and it’s doing so with technical precision.
The question now: where is the next high-probability long setup? Let’s break it down.
🧠 Market Structure & Key Zones
Using Fibonacci retracement from the base of the 5-wave impulse, we now have a potential golden pocket target aligned with major confluence.
🔽 Support Zone
🔹 0.618 Fib retracement: $2.2982
🔹 Daily Bullish Order Block: $2.2949
🔹 Daily 21 EMA: $2.329
🔹 Daily 21 SMA: $2.301
🔹 Liquidity pool
🔹 0.786 Fib Speed Fan (only if price drops between May 17–18)
This creates a high-confluence support cluster at ~$2.3 — a prime candidate for a long re-entry.
🟢 Long Trade Setup
Entry: Ladder between $2.32 and $2.28
Stop-loss: ~$2.21
Target: $2.7175 (0.618 Fib retracement of the corrective downtrend)
R:R: ~5:1
🔴 Short Setup (Conditional)
Trigger: Rejection at $2.7175
Entry: ~$2.7175
Stop-loss: Above $2.8033 (0.666 Fib) → set at ~$2.811
Take Profit: ~$2.56 or lower
R:R: ~2:1+ (dependent on entry confirmation and PA behaviour)
Shorts only valid if a clear rejection or SFP pattern emerges. If momentum is strong, this level may break — so wait for structure to confirm.
📘 Educational Insight: Why Confluence Matters
Too often, traders chase single-indicator signals. But real edge comes from confluence — when multiple tools (Fibs, MAs, Order Blocks, Liquidity, VWAPs, FVG, Speed Fans etc.) agree on the same zone. This alignment not only increases confidence in your entry, but also sharpens your risk management.
Think of it as building a case — the more aligned evidence you have, the stronger your trade thesis becomes.
📌 Summary
XRP is in a corrective phase after a 5-wave impulse
Clean rejection from weekly resistance → continuation of bearish trend
Long zone: ~$2.3
SL: ~$2.21 | TP: $2.7175 | R:R ~5:1
Optional short: $2.7175 rejection → SL $2.811 | TP $2.56
Precision isn’t about predicting — it’s about being ready when the chart speaks with clarity. Patience makes probability powerful.
___________________________________
If you found this helpful, leave a like and comment below! Got requests for the next technical analysis? Let me know.

VIRTUAL TA Masterclass — Elliott Wave Meets Gartley HarmonicVIRTUAL has been on fire! Printing a clean 5-wave Elliott impulse with a +431% run in just 33 days. But after every strong trend comes a healthy correction, and that’s where we likely are now. Trading below key resistance and showing signs of exhaustion. The question: Where is the next high probability trade setup?
Let’s break down what the chart is telling us.
🧠 Structure Overview
Wave 5 peaked at $2.2169
Wave A dropped -25%
Wave B bounced +30%
Currently: VIRTUAL's trading under the $2 psychological level and weekly open ($2.0358) → signs of momentum cooling
A corrective Wave C is likely underway, and all signs point toward a very specific zone.
⚠️ Liquidity Dynamics
The longer VIRTUAL grinds sideways near $2.00 without showing real momentum, the more vulnerable late long positions become:
Retail traders are buying resistance
SLs are likely clustered just below Wave A’s low
This creates a liquidity pocket waiting to be swept — perfect fuel for Wave C
🔍 The $1.58–$1.47 Support Cluster: 14 Layers of Confluence
This zone isn’t guesswork — it’s loaded with technical overlap:
1️⃣ 1:1 Trend-Based Fib Extension of Wave A → $1.573
2️⃣ Monthly Open → $1.5354
3️⃣ 0.382 Fib Retracement of the entire rally → $1.5295
4️⃣ Bullish Fair Value Gap → $1.57–$1.53
5️⃣ Anchored VWAP from ATH → ~$1.46
6️⃣ Anchored VWAP from Wave 3 → ~$1.46
7️⃣ 0.618 Fib Speed Fan Support (~end of May timing)
8️⃣ 4H 233 SMA → ~$1.52
9️⃣ 4H 200 EMA → ~$1.52
🔟 Daily 200 SMA → $1.5251
1️⃣1️⃣ Weekly 21 SMA → $1.462 (reinforces the VWAP zone)
1️⃣2️⃣ Declining Daily Volume → momentum weakening
1️⃣3️⃣ Liquidity Pool below Wave A → likely to be swept
1️⃣4️⃣ $2 = Golden Pocket Resistance + Psychological Barrier
🔴 Short Trade Setup (Active as Long as SFP Holds)
For those favouring downside continuation toward the Wave C target, a short setup is in play:
Entry: Weekly open retest around $2.0358
Stop-loss: Above SFP high at $2.143
Target: 1:1 Trend-Based Fib Extension of Wave A → $1.573 or the Swing Low of Wave A at $1.647
R:R ≈ 1:4 — a solid, well-structured short opportunity
As long as price remains below the SFP and the $2.00 golden pocket resistance, bears maintain control.
🟢 Long Trade Setup
Entry: Ladder between $1.58–$1.47
Avg. Entry: ~$1.53
SL: Below $1.40
TP1: $1.88 (local resistance) → R:R ≈ 1:2.5
TP2: $3.33 (0.618 Fib of entire bear market) → R:R ≈ 1:12
👉 Bonus TP for Harmonic Setup: 0.618 Fib of CD leg
✨ Bonus Confluence: Potential bullish Gartley Harmonic in Play
VIRTUAL is also forming a valid Gartley harmonic pattern — one of the most reliable reversal setups in classical trading theory.
🔸 XA: B retraced to 0.602 → ✅ (criterion: ~0.618)
🔸 AB: C retraced 0.87 → ✅ (valid range: 0.382–0.886)
🔸 CD: Projected to complete at 0.786 of XA → ~$1.474
• CD is a 1.356 expansion of BC
• AB ≈ CD symmetry is valid
• TP = 0.618 retracement of CD leg
This adds even more weight to the $1.47–$1.53 buy zone.
📘 Educational Takeaway
The best setups don’t rely on one method — they align multiple disciplines. Here, we have Elliott Waves, Fibonacci retracements, anchored VWAPs, volume structure, moving averages, time symmetry, and now a harmonic pattern — all pointing to the same opportunity. Most traders never wait for alignment. That’s why most lose.
💬 Final Words
✍️ Smart trading isn’t about always being in a trade — it’s about being in the right one at the right time.
While others FOMO at $2, you wait for the right opportunity to come to you — where structure, liquidity, and probability all shake hands.
The patient are rewarded. Always.
___________________________________
If you found this helpful, leave a like and comment below! Got requests for the next technical analysis? Let me know.

$NAS100 / $QQQ – The 200 SMA Breakout... or Bull Trap?📈 Nasdaq just charged through the 200-day moving average like it wasn’t even there. But if you zoom out, this level has acted as a brick wall before — and we may be walking straight into a trap.
🔍 Key Observations:
The last failed breakout above this zone led to a major rejection.
We're back at horizontal resistance from prior tops.
Price action resembles a Rope-a-dope move — run up, suck in longs, then rug pull.
⚠️ No real breakout without confirmation + volume. Don’t let the short-term green candles distract you from the macro ceiling above.

THETA at Rock Bottom? The Bounce Could Be LegendaryFor the past 136 days, THETA has been in a strong downtrend, shedding an incredible -82% from its high at $3.351. Recently, it tapped into a major support level at $0.617, interesting that it's like the golden ratio 0.618. And it bounced off it beautifully. Over the last few days, we’ve seen a notable surge in volume, hinting at potential accumulation. Could this be one of the best times to scale in? It might just be. An 82% discount is no joke.
🔑 Key Levels to Watch
The $1 level is the key psychological and technical resistance everyone’s eyeing. Longing from current levels to $1 offers a solid +40% gain, not bad at all. But let’s zoom out and get the bigger picture with some Fibonacci levels.
Using Fib retracement on the full 136-day move down:
0.236 Fib = $1.252 → Approx. +75% from current price
0.382 Fib = $1.653 → Roughly +135% gain
These are solid mid- to long-term upside targets if bullish momentum builds.
📈 Trade Setup & R:R
Invalidation: Current low at $0.600
Monthly Open: $0.804. Reclaiming and flipping this level into support would be a bullish sign.
Current Resistance: Around $0.71, where the anchored VWAP (yellow line) aligns with a yearly level. This needs to be broken and ideally retested as support.
We might also be seeing the early formation of an inverse head and shoulders pattern. While the “head” is still developing, if this setup plays out, the target sits at $1.5.
And here’s the kicker:
That $1.5 region lines up with multiple higher timeframe moving averages, adding significant weight to the level:
Monthly 21 EMA: $1.52
Monthly 21 SMA: $1.47
Weekly 21 SMA: $1.514
This confluence makes $1.47–$1.52 a major magnet for price and a likely take-profit or reaction zone if momentum continues.
👉 Feel free to use this indicator—just head over to my profile and under the Scripts section, add it to your favorites. Enjoy.
🎯 Risk to Reward Potential
These setups have excellent R:R potentials, ranging from 3:1 to over 60:1, depending on entry, stop-loss placement, and target selection. These are the kinds of high-probability setups that traders dream of. Clean structure, strong support, major upside, and clear invalidation.
If we see a breakout above $1 with strong volume, it could act as a catalyst for an even faster move toward higher Fib levels and MA targets.
Didn’t want to go too deep, but this lays out a clear roadmap with levels to monitor and possibilities to consider. The rest depends on how new data unfolds in the coming weeks. As always... plan your trade, manage your risk, and let the market come to you. Keep monitoring volume, structure, and key levels. The opportunities are here, now it's about execution.
____________________________________
If you found this helpful, leave a like and comment below! Got requests for the next technical analysis? Let me know.

Approaching the 200-Week SMA – AgainHistory doesn’t repeat… but it sure does rhyme.
If all you did was buy the S&P 500 every time it touched the 200-week moving average, you would’ve: ✔️ Bought 2011, 2016, 2018, 2020, 2022… 💰 Absolutely cleaned house.
Now in 2025, we’re approaching the same level again. That SMA has acted like a trampoline for the last 15 years — will it bounce once more?
🧠 Food for thought as fear builds and the market cools.
Let’s see if the buyers step in where they always have. 👀

$RKLB preparing for takeoff? 3...2...1... NASDAQ:RKLB : Good support in the $15 area, good volume in that buy zone and floating above it's 200EMA/SMA, 50EMA/SMA and a nice weekly candle. Targets: $21.80, $22.50 and mega momentum towards $25.
WSL.

ADA - Next Trade Setups to WatchADA’s been stuck in this sideways grind for a while, and the volume’s basically ghosting us. So, where’s it at, and where’s the next move? Let’s dig in.
ADA’s sitting at $0.6615 right now, trading below the yearly open at $0.8451 and the range’s sweet spot, the POC, at $0.7325. That tells me it’s leaning a bit bearish, but not exactly screaming panic, more like it’s just chilling in this 57 day range. It tapped the monthly open at $0.6328 recently, bounced a little, but without volume showing up, it’s like nobody’s ready to commit yet.
Key Levels
Resistance Zones (Short Opportunities)
1.) Range POC: $0.7325, this is the most traded price within the 57 day range, acting as a magnet for price. A rejection here could signal a short setup.
2.) Yearly Open ($0.8451): a psychological and structural level that could cap upside if momentum remains weak. Trading below this level keeps the yearly bias bearish. A break above with volume would flip the narrative.
Support Zones (Long Opportunities)
1.) Monthly Open: $0.6328, already saw a little bounce here with that swing failure move, perfect setup for a long trade if you were quick on the draw.
2.) Yearly Open 2024 + 21 Monthly EMA: $0.594 - $0.5928, strong confluence with the prior yearly open and a key moving average. This zone aligns closely with the swing low at $0.5801, forming a robust support cluster between $0.5801 - $0.594.
3.) 21 SMA: $0.53, a deeper support level if the above zone fails. This would indicate a more significant breakdown, but it’s a potential accumulation area for longer-term traders.
Market Structure Analysis
Bearish Bias Above Swing Low: Trading below the yearly open and POC suggests sellers are in control unless price reclaims $0.7325 with conviction.
Range-Bound Behaviour: The 57 day range indicates consolidation. Volume is the missing catalyst, watch for a spike to confirm direction.
Swing Low as Key Pivot: The $0.5801 level is critical. A hold here maintains the range; a break below shifts focus to $0.53 and signals capitulation.
High-Probability Trade Setups
Long Setups
1.) Long Setup #1 at Swing Low ($0.5801 - $0.594 Zone)
Entry Trigger: Look for a swing failure pattern (SFP) where price dips below $0.5801, reclaims it, and shows rejection of lower prices (e.g., a bullish candle with a wick below).
Stop Loss (SL): Place just below the swing low
Take Profit (TP): $0.70 (near-term resistance)
Stretch Target: $0.8451 (yearly open), though this requires stronger momentum.
Confirmation: Higher-than-average volume on the reclaim + bullish price action (e.g., engulfing candle).
2.) Long Setup #2: $0.4735 Sniper Entry
Entry Trigger: If ADA takes a bigger tumble, $0.4735 is your sniper’s nest, think of it as catching the knife with style. Could be a wick that snaps back.
This is a deeper, high-reward play. Price has to fall by a lot from here, but if it hits, the R:R is amazing, and it’s below most traders radar. Patience is the name of the game.
Short Setup
At POC ($0.7325) or Yearly Open ($0.8451)
Strategic Outlook
Current Stance: If not in a trade, the $0.5801 level is the highest-probability long setup due to confluence and R:R. The SFP at $0.6328 today was a missed opportunity, but a deeper pullback sets up an even better entry.
Breakout Watch: A decisive close above $0.7325 (POC) with volume shifts focus to $0.8451. Conversely, a break below $0.5801 targets $0.53.
Patience is Key: Low volume suggests waiting for a clear catalyst (e.g., news, BTC move) to drive ADA out of this range.
Wrapping It Up
The $0.5801 swing low long with SL below and TP at $0.7 - $0.8451 is the standout trade right now—low risk, high reward, and backed by confluence. Monitor volume closely, as it’s the linchpin for any breakout or reversal. If ADA holds this support and volume picks up, the retest of $0.8451 becomes plausible.
If you found this helpful, please leave a like and a comment. Happy trading!

HBAR Bulls Nowhere in Sight – Where’s the Bottom?HBAR had an incredible bull run from November 2024 to mid-January 2025, rallying for 74 days and gaining +865%, moving from $0.0416 to a high of $0.40139. However, since then, the market has reversed, entering a 73 day downtrend and dropping -58% from its peak.
Now, the big question is: where is HBAR heading next? Let’s break down the key resistance and support levels and map out potential high-probability trade setups.
Current Market Structure – Bears in Control
HBAR is trading at $0.16765, just below a key low at $0.17721, which it must reclaim to show any bullish strength. Several critical resistance levels lie ahead:
🔴 $0.18 - $0.20 Zone: Previously strong support, now acting as resistance
🔴 Weekly Level at $0.18375 – A significant resistance zone
🔴 Monthly Open at $0.21352 – Bulls must reclaim this to regain momentum
🔴 Weekly 21 EMA at $0.20 & 21 SMA at $0.2348 – Price is trading below both, a bearish sign
🔴 200 EMA/SMA Lost – Another bearish indicator
🔴 0.618 Fibonacci Retracement at $0.17904 – This level was lost, further confirming the bearish trend
📉 Conclusion: As long as price remains under $0.18-$0.20, the trend remains bearish, and there is no sign of reversal yet.
Where Could HBAR Go Next? Finding the Next Support Levels
If HBAR fails to reclaim the key resistance levels, price could continue dropping toward the next major support zone. Here’s where the next support zone is:
🟢 0.786 Fibonacci Retracement at $0.1186 – A key potential target
🟢 Weekly Support at $0.1259 – Close to the 0.786 Fib level, adding confluence
🟢 Monthly Support at $0.1145 – Further strengthening this zone
🟢 Log Scale 0.5 Fib Retracement at $0.12923 – From the full bull run, adding another layer of support
🟢 21 Monthly EMA at $0.132 & 21 Monthly SMA at $0.1079 – These levels align perfectly with the other supports
🟢 Fib Channel Lower Support (April 4th - 9th) – If price drops to $0.12 during this time window, it aligns with the lower channel support line
📉 Conclusion: A strong support zone lies between $0.132 - $0.1079, where buyers could step in for a potential bounce.
Potential Trade Setups
📌 Long Setup (High Probability Reversal Zone)
Entry: DCA around $0.12
Stop Loss: Below $0.098
Target: $0.166
Potential Gain: +40%
R:R Ratio: 2:1 or better
🔹 If price regains $0.18-$0.20, we can look for long opportunities.
📌 Short Setup (For Those Already Shorting from Higher Levels)
Take Profit Target: Between $0.14 - $0.12
Stop Loss: Above $0.20
Market Outlook
With HBAR currently in a bearish trend, we have clearly defined key support and resistance zones and potential trade setups. The next few weeks will be crucial, as price either reclaims $0.18-$0.20 (bullish case) or drops further toward $0.12 (where a strong bounce could happen).
📢 Patience is key! Let the setup come to you and don’t force trades. Always manage risk properly.
What are your thoughts on HBAR’s next move? Leave a comment below! 🚀
