XAU/USD Plot Twist?XAU/USD: From 4106.7 to 4200 – The Comeback Tour (Featuring a Quick Dip at 4060.3)
Trade Idea Explanation:
Current Situation:
Price has successfully broken above the previous resistance at 4106.7, confirming bullish momentum.
Expected Move:
A pullback toward 4060.3 is anticipated before resuming the upward trend. This level aligns with potential support from the breakout structure.
Bullish Target:
After the pullback, the next upside target is 4200, which represents the projected extension of the bullish move.
Alternative Scenario:
If price breaks the current resistance at 4152.0, it could extend higher toward 4195 (first short entry) and 4220 (second short entry), where sellers may step in and initiate a reversal.
Enjoyed this? Show some love with a LIKE and share your thoughts in the COMMENTS! 💬
Disclaimer
My trading strategy isn’t a signal — it’s more like therapy for my brain. I’m just here crying over candlesticks while pretending it’s ‘learning market structure.’ Sharpening my skills? Sure. Building my trade journal? Absolutely. But deep down, it’s just me whispering to the charts: ‘Please love me back
Nakedchartanalysis

BTC Update: The Rollercoaster EditionAttention all chart warriors, candlestick whisperers, and Fibonacci fanatics!
If you're reading this trade plan, congratulations — you've officially entered the realm of market prophecy
🚀 BTC Update: The Rollercoaster Edition 🎢
What’s New?
Bitcoin is chilling around $86K, like that friend who says “I’m fine” after a breakup but keeps posting cryptic stories.
Upper Trendline:
Sitting pretty near $90,774 – that’s the “VIP section” where bulls want to party. Break above it, and we’re talking $97K–$104K dreams.
Lower Trendline (Breakout Zone):
Guarded at $85,500. If BTC slips below this, next stop could be $80K – aka the “budget seats.”
Price Action:
Currently stuck in a descending channel, but RSI is whispering, “Hey, maybe we’re oversold.” MACD is like that friend who says, “I think things are turning around.”
Target:
If BTC breaks the upper trendline, $97K–$104K is the next dance floor. If not… well, let’s just say $80K might be the couch we crash on.
Fun Fact:
Bitcoin’s November mood? Extreme Fear. Basically, the market is acting like someone saw a spider in the bathroom.
Good luck, everyone! And hey, don’t forget to smash that like button and drop your wildest market predictions in the comments! ❤️
Disclaimer: My trading strategy isn’t a signal—it’s more like a workout for my brain. I’m just here flexing my market structure knowledge and sharpening my trading skills while building my trade journal. Think of it as financial gym time—no personal trainers, just candlesticks!

GBP/USD: The “Breakout or Bust”What’s Happening?
Price has been sliding down like a kid on a playground slide since early November. Now it’s chilling near 1.311, looking at that trendline like, “Should I climb back up or just nap here?”
Pair: GBP/USD
Timeframe: 4H
Type: Long (Buy Setup)
Key Elements in the Chart
Downtrend Line:
A descending trendline from previous highs is drawn, showing the overall bearish structure.
Price is approaching this trendline, suggesting a potential breakout scenario.
Support Zone:
Around 1.30869 – 1.30008, marked in red.
This is the area where buyers are expected to defend, and the trade idea assumes price will hold above this zone.
Resistance Zone:
Nar 1.31775, marked as “resistance.”
Price needs to break above this level to confirm bullish momentum.
Entry & Stop:
Entry is around 1.31125 (current price).
Stop loss is below 1.30008 (support zone), protecting against downside risk.
Target:
1.34599, which aligns with the 0.618 Fibonacci retracement level from the previous swing high.
This is the bullish target if the breakout succeeds.
Price Action Logic
Price has been in a downtrend but is forming a potential reversal pattern near support.
The idea is to buy after confirmation of a breakout above the descending trendline and resistance.
Risk-to-reward looks favorable: small stop below support, large upside toward 1.34599.
✅ Summary of the Trade Idea
Bias: Bullish reversal.
Trigger: Breakout above trendline and resistance.
Stop: Below 1.30008.
Target: 1.34599 (Fibonacci level).
Good luck, everyone! And hey, don’t forget to smash that like button and drop your wildest market predictions in the comments! ❤️
Disclaimer: My trading strategy isn’t a signal—it’s more like a workout for my brain. I’m just here flexing my market structure knowledge and sharpening my trading skills while building my trade journal. Think of it as financial gym time—no personal trainers, just candlesticks!

XAU/USD Prophecy: Will 4200 Shine Bright?Greetings, Traders! Market Prophecy: XAU/USD in Action
Gold isn’t just sparkling—it’s plotting moves like a secret agent with Fibonacci codes! Here’s what the charts are whispering:
🔍 The Setup
XAU/USD has strutted its way to the 50% Fibonacci level, but if history is any guide, gold loves to go the extra mile—often stretching beyond 61.8% like it’s chasing a bonus level in a video game. Translation? There’s still some golden runway left for the bulls.
📈 The Technical Drama
On the 1-hour timeframe, we’ve got a trendline breakout—cue the fireworks!
The 30-minute chart? Resistance smashed like a piñata at a birthday party.
Now, all eyes are on the 4107 level. If price breaks this resistance, expect a pullback that could be your golden ticket for a long entry.
🎯 The Target
If the bullish momentum keeps flexing, we’re eyeing 4200 as the grand finale. Think of it as gold’s victory lap.
💡 Trading Idea
Break → Pullback → Long → Profit. Simple, but with style. Just remember: markets can be as moody as a cat, so manage your risk like a pro.
If you found this helpful, hit LIKE & COMMENT ❤️

Cup Complete, Breakout Brewing — Handle Still Lost in Tokyo!Greetings, traders! Market Prophecy is telling a story again… Don’t run — it’s not a horror movie, just a Cup & Handle trying to find its happy ending. Grab your popcorn, because this chart has more drama than a Netflix series!
The difference between EUR/JPY and USD/JPY? Simple: USD/JPY has already finished sipping its cup on the monthly chart, while EUR/JPY is still brewing like a slow barista. (Don’t worry, I’ll spill the details on the daily or weekly EUR/JPY chart later.)
For USD/JPY, the handle is still in progress — think of it as the market adding the latte art before serving the breakout. Best dip-buy zone? Around 120, but even at 140, this pair might bounce like a trader after a margin call.
Once the handle completes and resistance breaks, say goodbye to boring consolidation and hello to trending mode. That’s exactly what happened with XAU/USD — it rocketed sky-high! 🚀 So don’t miss out, unless you enjoy watching profits fly past like shooting stars.
Enjoyed this? Show some love with a LIKE and share your thoughts in the COMMENTS! 💬
Disclaimer
My trading strategy isn’t a signal — it’s more like therapy for my brain. I’m just here crying over candlesticks while pretending it’s ‘learning market structure.’ Sharpening my skills? Sure. Building my trade journal? Absolutely. But deep down, it’s just me whispering to the charts: ‘Please love me back

EUR/JPY’s Coffee Break Before the Big Bull Run!Greetings, traders! Market Prophecy: Forecasting Breakouts, Not Birthdays!
Disclaimer: My trading strategy isn’t a signal—it’s more like a workout for my brain. I’m just here flexing my market structure knowledge and sharpening my trading skills while building my trade journal. Think of it as financial gym time—no personal trainers, just candlesticks!
Attention XXXJPY lovers
In the coming months, we’re about to witness some seriously interesting moves on the XXX/JPY pair. Don’t snooze on this — it could be your chance to turn charts into cash! As we all know, the Cup & Handle is a continuation pattern, and right now, it’s brewing like a perfect latte. After years of depositing, losing, winning, and hitting repeat like a broken playlist, I thought… why not share this trade idea so we can all sip profits together? Let’s make forex fun — and profitable!”
And to answer that PM asking why I do this on weekends when the market is sleeping?
Simple — because weekdays are like speed dating with pips. I’m too busy focusing on my trade plan and fixing those little flaws that sneak in like uninvited guests. Weekends? That’s my chill time with the charts — no drama, no price action,no breakout, no trendline just me and my candlesticks having a quiet coffee date.
“If you found this helpful, hit LIKE & COMMENT ❤️ Because every click saves a trader from staring at charts alone on a Saturday night.”

ETHUSD : TRADE IDEAAnother short opportunity is on ETH/USD. On the daily timeframe, price has successfully broken below the support level at 3353.41. The recent upward movement appears to be a temporary pullback before continuing its decline toward the 2747.46 level.
Ensure strong confirmation before acting, and keep an eye on shifts in market structure.
Thanks a lot for your support & best of luck
**My trading strategy is not intended to be a signal. It's a process of learning about market structure and sharpening my trading my skills also for my trade journal**

GBPUSD Brewing a Latte: Cup & Handle Special EditionWelcome to Market Prophecy..
The recent weekly decline in GBPUSD occurred because the price failed to break above the 1.37476 resistance level (marked in yellow) and dropped to 1.30375. If the price does not break below the 1.30375 daily support level, there is a strong likelihood that it will rebound and attempt to test the nearest resistance at 1.35639. Based on the projection I’ve drawn, there is a high probability that the price will form a cup-and-handle pattern on the weekly chart. Don’t miss the opportunity for a potential swing buy.
Good luck, everyone! And hey, don’t forget to smash that like button and drop your wildest market predictions in the comments! ❤️
Disclaimer: My trading strategy isn’t a signal—it’s more like a workout for my brain. I’m just here flexing my market structure knowledge and sharpening my trading skills while building my trade journal. Think of it as financial gym time—no personal trainers, just candlesticks!

BTC Rebound: From Bear Hug to Bull RunWelcome back to Market Prophecy...
From the previous chart, the market successfully broke the support and continued its fall to the next support. So, I’m seeing a possibility that the price will drop to 77,663.25 before making a comeback to the 50%–61.8% level… because even markets need a little drama before a rebound
good luck all
**My trading strategy is not intended to be a signal. It's a process of learning about market structure and sharpening my trading my skills also for my trade journal**
Thanks a lot for your support

XAU/USD Weekly Drama: Resistance vs. Persistence!Welcome back to Market Prophecy...
Gold (XAU/USD) recently broke below its support level and the lower trendline, signaling bearish pressure. However, the price failed to breach the critical $4,000 mark, indicating strong buying interest at lower levels.
For the upcoming week, the bias shifts toward a bullish outlook, with the first key resistance located at $4,106.43. A confirmed breakout above this resistance and the trendline will serve as a strong entry signal for long positions.
Trading Plan:
Breakout Confirmation: Wait for price to close above $4,106.43 and the trendline.
Pullback Opportunity: If the breakout occurs, monitor for a retracement back to the support zone for an optimal entry.
Upside Target: The next major resistance is projected near $4,200, which will act as the primary profit target.
Key Levels to Watch:
Support: Previous breakout zone
Resistance: $4,106.43 (initial), $4,200 (target)
good luck all
**My trading strategy is not intended to be a signal. It's a process of learning about market structure and sharpening my trading my skills also for my trade journal**
Thanks a lot for your support

BTC’s Toxic Relationship with Support LevelsMarket Prophecy is back
Price made a rejection on the weekly timeframe and successfully broke through daily support at 98,920. Now, it looks like BTC might pull a classic move—retracing to the 50–61.8% Fibonacci zone, just like its previous wave—before continuing its dramatic dive toward the next support at 81,490. Traders call it ‘price action.’ I call it emotional damage
good luck all
**My trading strategy is not intended to be a signal. It's a process of learning about market structure and sharpening my trading my skills also for my trade journal**
Thanks a lot for your support

BITCOIN : WEEKLY TRADE STRUCTUREAttention all chart warriors, candlestick whisperers, and Fibonacci fanatics!
If you're reading this trade plan, congratulations — you've officially entered the realm of market prophecy
Here is my view on the current BTC/USD trade structure. Looking at the weekly chart, the price has successfully broken out of resistance and the trendline. Therefore, the current decline is a correction before a potential upward move resumes. However, if the price manages to break below the support level of 90862.16, this structure will change
good luck all
**My trading strategy is not intended to be a signal. It's a process of learning about market structure and sharpening my trading my skills also for my trade journal**
Thanks a lot for your support

XAUUSD UPDATEhi everyone
For this upward movement, the first resistance is at the 3494 level. A breakout at this level would also coincide with a breakout of the trendline. If both the trendline and resistance are broken, the price is likely to move toward the next resistance at 4984. The target price could reach the 61.8% Fibonacci retracement level.
I’m also interested in entering a long position around the 3862 area. However, if the support at 3884 breaks, I will reconsider the setup
good luck all
**My trading strategy is not intended to be a signal. It's a process of learning about market structure and sharpening my trading my skills also for my trade journal**
Thanks a lot for your support

XAUUSD UPDATE : BREACH 4149.78hi again
Market Analysis
From the previous chart, the price successfully broke above 4149.78. At the current level, the next resistance is identified at 4279.23, while key support is around 4124.81.
Trade Plan
Sell Setup:
Look for rejection at 4279.23 combined with bearish price action confirmation at that resistance level.
Buy Setup:
Look for rejection at 4124.81 combined with bullish price action confirmation at that support level
good luck all
**My trading strategy is not intended to be a signal. It's a process of learning about market structure and sharpening my trading my skills also for my trade journal**
Thanks a lot for your support

XAUUSD UPDATE: WHAT NEXTHi everyone,
Gold is currently testing the resistance level at 4149.78. A breakout above this level could push the price toward the 4203–4204 level. Conversely, if the price breaks below the 4124–4123 support, I’ll be watching for a potential pullback around 4098 or a rejection from the trendline
good luck all
**My trading strategy is not intended to be a signal. It's a process of learning about market structure and sharpening my trading my skills also for my trade journal**
Thanks a lot for your support

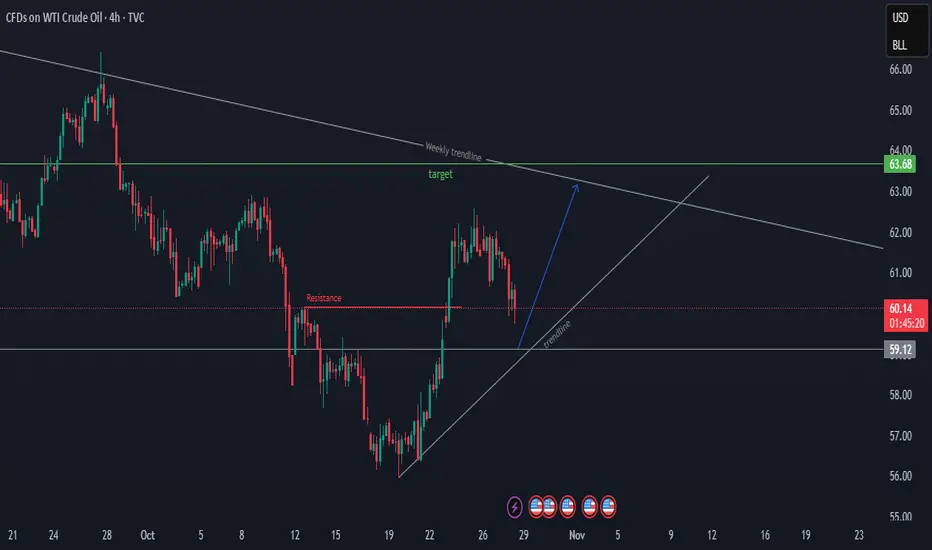
USOIL TRADE IDEAhi all
USOIL has broken through the resistance level at 60.17 on the H4 timeframe. The current decline is likely a pullback. In my view, the 59.3–59.1 range presents a good opportunity to go long on USOIL
good luck all
**My trading strategy is not intended to be a signal. It's a process of learning about market structure and sharpening my trading my skills also for my trade journal**
Thanks a lot for your support
GBPJPY TRADE IDEAhi all
For the GBPJPY pair, a breakout has occurred on the trendline. I’m currently waiting for a breakout at the nearest support level before entering a short position at that level.
My nearest target is around the 199.212 level
good luck all
**My trading strategy is not intended to be a signal. It's a process of learning about market structure and sharpening my trading my skills also for my trade journal**
Thanks a lot for your support

BTCUSD TRADE IDEAhi all
For the BTCUSD pair, a breakout has occurred on the H1 timeframe. This current pullback presents an opportunity to enter a long position, with a short-term target around the 115,529.68 level. From that level, I anticipate a potential swing setup, with the next target near 111,666.21
good luck all
**My trading strategy is not intended to be a signal. It's a process of learning about market structure and sharpening my trading my skills also for my trade journal**
Thanks a lot for your support

XAUUSD : What is the expected reversal point for XAU/USD?hi everyone
The drop in gold indicates profit-taking. This can be observed as other XXX/USD pairs continue to move normally. After forming a double top, the decline has now reached around the 0.618 Fibonacci level. I’m more interested in the 0.786 level, which is around 3961.89 or 3818.06
good luck all
**My trading strategy is not intended to be a signal. It's a process of learning about market structure and sharpening my trading my skills also for my trade journal**
Thanks a lot for your support

GBPNZDI am looking for Short at this area, as long as this zone didn't break then Entry is valid.
If breaks then looking for Higher TF entry.
Marked Zone confirmation already taken in account.
Confirmation Steps taken:
H4 Drop Base Drop
Daily Double Marubozu
Weekly Bearish Engulfing
Above step makes my entry strong, i will target previous low but put on Break Even at Tp1 level.
#NakedChart #Bystra #Strategy #BBMA

Gold 31 July – Bearish Bias Holds, Watching Supply ZonesGold (XAUUSD) Analysis – 31 July
Market structure is now aligned across both higher and lower timeframes:
H4: Bearish
M15: Bearish
This alignment strengthens the probability of trend-continuation setups in favor of the dominant downtrend.
🔄 Current Market Behavior:
The M15 chart is currently in a pullback phase, retracing toward its previous lower high and approaching a key supply zone.
📍 Key Supply Zones to Watch:
Zone 1 – Immediate Supply Zone (3299 – 3305)
• First area of interest where price may react.
• If respected and followed by M1 confirmation, a short setup could be initiated.
• Watch for signs of exhaustion or sharp rejection.
Zone 2 – Higher Supply Zone (3326 – 3332)
• If the first zone fails, this becomes the next high-probability area.
• Well-aligned with the broader bearish structure — expect stronger reaction potential.
• Suitable for cleaner high RR short trades if price reaches this level.
✅ Execution Plan:
• Observe how price behaves inside the marked zones.
• Only plan short entries after M1 confirmation — this adds precision and prevents premature entries.
• Stay patient. Let the market come to you and reveal intent before acting.
📌 Summary:
Bias: Bearish
Structure: H4 and M15 both support downside bias
Zones in Focus:
– Primary: 3299–3305
– Secondary: 3326–3332
Execution: Wait for confirmation before entering.
Risk-Reward: Maintain 1:3 RR minimum (e.g., 40 pip SL, 120 pip TP).
Let the structure guide your setups — not impulse.
📘 Shared by ChartIsMirror

What Is Naked Forex Trading, and How Do Traders Use It?What Is Naked Forex Trading, and How Do Traders Use It?
Traders rely on various tools and techniques to trade the forex market. Naked forex trading is one of the oldest and most popular trading approaches among currency traders. This article delves into the details of naked trading, providing insights into its implementation and distinguishing features that set it apart from other analysis techniques.
Understanding Naked Forex Trading
Naked trading is a trading style that involves analysing markets using a clean price chart, meaning one without technical indicators. Traders who use this method make decisions based on real-time price movements and their trading instincts.
Naked trading has its roots in the early days of trading, long before the advent of sophisticated technical analysis tools and indicators. Early traders relied solely on price action and market behaviour to make trading decisions. By stripping away the complexity of modern trading tools, naked trading aims to return to the fundamental principles of trading, emphasising the importance of understanding market psychology and price dynamics.
Core Principles of Naked Forex Trading
Naked forex trading is based on the following principles:
- Price action analysis is the foundation of naked trading, focusing on the examination of asset price movements without the help of technical indicators. Traders rely on bar, line, or Japanese candlestick charts to identify patterns, trends, and key support and resistance levels. By concentrating on real-time price movements, traders aim to make their trading decisions based on how prices behave at specific levels.
- Naked trading emphasises simplicity and clarity as it removes the clutter of numerous trading tools. This approach helps traders maintain a clear view of the market, making it potentially easier to identify trading opportunities. The simplification also reduces cognitive load, enabling traders to focus on the most critical market movements.
- Trader instinct, often referred to as "gut feeling" or "trader's intuition," plays a significant role in naked trading. This instinct is honed over time through experience and the extensive observation of price movements and market behaviour.
Key Techniques and Tools
Mastering price action analysis is crucial in naked trading. These are the four key tools for those who use naked trading.
Candlestick Patterns
Candlestick patterns play a crucial role in naked trading strategy by providing visual representations of price movements over a specified period. Traders look for different price formations to analyse potential market reversals, continuations, or indecisions. Common candlestick patterns include doji, engulfing patterns, hammer, shooting star, and spinning top. Each offers insights into market sentiment and potential future price movements.
Chart Patterns
Chart patterns on price charts indicate potential trend reversals or continuations. Traders using naked trading techniques rely on chart patterns like flags, rounding top/bottom, diamonds, and rectangles to identify key levels where the price is likely to react. These patterns help traders anticipate market movements and plan entry and exit points accordingly.
Support and Resistance Levels
Support and resistance levels are fundamental concepts in naked trading, representing levels the price struggled to break above (resistance) or hold above (support). Traders identify these levels on price charts to anticipate potential price reversals or breakouts. Support and resistance levels are crucial for setting profit targets, placing stop-loss orders, and managing risk.
Trendlines and Channels
Trendlines and channels are used by naked traders to visualise the direction and strength of a trend. Trendlines connect successive higher lows (uptrend) or lower highs (downtrend) on a price chart, helping traders identify trend reversals or confirm trend continuations. Channels are formed by drawing parallel lines to connect highs and lows, creating a channel in which the price typically moves.
Advantages of Naked Forex Trading
Naked trading has many advantages; therefore, it’s still used by traders around the globe. Here are the key benefits of naked forex trading:
- Enhanced Focus and Simplicity: This approach removes market clutter as it offers enhanced focus by eliminating complex technical indicators. Without the distraction of multiple indicators that provide lagging signals, traders may respond more effectively to changes in price movements.
- Improved Market Understanding: By relying on naked trading tools, traders may better understand market behaviour and psychology. Observing price action directly on charts potentially enhances traders' ability to interpret market sentiment, identify key support and resistance levels, and anticipate potential trend reversals or continuations. This hands-on approach fosters a deeper understanding of the nuances of the market and improves trading skills over time.
- Flexibility and Adaptability: Traders are not constrained by specific indicator signals or rigid trading rules. Instead, they can adjust their approach based on real-time price action and evolving market dynamics. This flexibility allows them to take advantage of emerging opportunities and adapt their strategies to potentially mitigate risks.
Challenges and Limitations
Although naked trading can be effective, it has limitations that a trader considers before relying on this approach.
- Learning Curve: As naked forex trading relies heavily on interpreting price action without the assistance of technical indicators, traders may need to dedicate considerable time and effort to mastering candlestick patterns, chart analysis, and understanding market psychology. Developing the skill to interpret price movements accurately demands persistence and consistent practice.
- Emotional Discipline: A notable challenge of naked trading is the absence of clear buy or sell signals provided by indicators, which can lead to heightened emotional responses to market fluctuations. Traders must maintain discipline by adhering to their trading plans, implementing risk management strategies, and avoiding impulsive decisions.
- Market Noise: Navigating market noise is another hurdle in naked trading. Market noise refers to random price fluctuations that obscure meaningful price patterns. Traders need the patience and experience to distinguish between significant price movements and temporary fluctuations.
Practical Application of Naked Forex Trading
Setting up a trading plan is essential for implementing naked forex trading. Traders might use the following rules:
- Define Your Trading Goals: Determine your financial objectives, risk tolerance, and period of trading.
- Select Currency Pairs: Choose currency pairs that align with your trading strategy and offer sufficient liquidity.
- Identify Key Trading Times: Determine optimal times to trade based on market volatility and your availability.
- Establish Entry and Exit Rules: Define criteria for entering trades based on price action signals, such as candlestick patterns or support/resistance levels. Similarly, rules for exiting trades should be established to potentially lock in returns or cut losses.
- Risk Management: Implement risk management strategies, including setting stop-loss orders and calculating position sizes based on your risk tolerance and account size.
- Review and Adapt: Regularly review your plan to assess its effectiveness and make necessary adjustments based on evolving market conditions and personal trading performance.
Real-Life Examples and Case Studies
Real-life examples and case studies illustrate how naked forex trading principles are applied in practice:
Example 1: Trading Support and Resistance
A trader identifies a currency pair approaching a key support level on the daily chart. They wait for a bullish reversal candlestick pattern, such as dragonfly doji, to form near the support level. They enter a long trade with a stop-loss below the support level and a profit target at the next resistance level.
Example 2: Trend Confirmation
A trader observes a currency pair in a strong downtrend on the hourly chart. They wait for a pullback to a trendline and look for a bearish engulfing pattern to confirm the continuation of the downtrend. They enter a sell trade with a tight stop-loss above the trendline. However, it is difficult to determine the profit target as there are no swing lows nearby.
The Bottom Line
When they understand the naked trading forex strategy, traders may use it in other markets, including stocks and cryptocurrencies*. However, it's important to note that any analysis does not guarantee effective trading, and other factors should be considered alongside chart analysis. Risk management and a proper mindset are essential for long-term consistency.
FAQs
What Is Naked Trading in Forex?
Naked, or price action trading, is a forex trading approach that involves analysing the market using a clean price chart without any technical indicators. Traders relying on this method make decisions based on real-time price movements and their trading instincts rather than past performance. The strategy emphasises identifying key support and resistance levels, trend reversals, and price corrections purely through the observation of bar, line, or candlestick charts.
Can I Trade Without Chart Patterns?
Yes, trading without chart patterns may be possible using alternative methods such as indicator-based strategies, quantitative models, fundamental analysis, or sentiment analysis. These approaches allow traders to analyse the markets based on technical indicators, mathematical algorithms, economic data, or market sentiment.
What Is a Chart Pattern in a Price Action Strategy?
A chart pattern in a price action strategy refers to the specific formations and shapes created by the price movements of an asset, which traders use to analyse future market behaviour. These patterns emerge due to the collective actions of buyers and sellers and can indicate potential trend reversals or continuations. Some common chart patterns include triangles suggesting a consolidation before a breakout, Quasimodo indicating a potential trend reversal, and flags signalling the continuation of an existing trend.
What Is the 5-3-1 Trading Strategy?
The 5-3-1 trading strategy is a disciplined approach designed to help traders focus and improve their trading skills. It involves trading just five currency pairs to reduce complexity and enhance expertise in those markets. Traders then use only three specific strategies to master and consistently apply. Finally, they select one trading timeframe to maintain consistency and avoid confusion.
*Important: At FXOpen UK, Cryptocurrency trading via CFDs is only available to our Professional clients. They are not available for trading by Retail clients. To find out more information about how this may affect you, please get in touch with our team.
This article represents the opinion of the Companies operating under the FXOpen brand only. It is not to be construed as an offer, solicitation, or recommendation with respect to products and services provided by the Companies operating under the FXOpen brand, nor is it to be considered financial advice.

WTI TRADE IDEAhello everyone
From the previous oil movement, the entry at 58.52 moved up by 80 pips before hitting breakeven. For the upcoming open market, if the trendline and support or resistance break out as shown on the M30 chart, it could signal an opportunity to enter the market.
Ensure strong confirmation before acting, and keep an eye on shifts in market structure.
Thanks a lot for your support & best of luck
**My trading strategy is not intended to be a signal. It's a process of learning about market structure and sharpening my trading my skills also for my trade journal**
