Nasdaq Holds Below the 26,300-ResistanceHaving broken above the 26,000 mark, the Nasdaq has also moved beyond the upper boundary of a channel respected since July 2025, now trading within the duplicated (parallel) channel structure.
The mid-zone of this duplicated channel represents initial resistance near 26,300, and a confirmed breakout above this level could extend gains toward the upper boundary near 26,800.
On the downside, a move back below 25,700 could trigger a sharper pullback toward 25,400, with additional support near 25,200. The daily RSI continues to diverge negatively from price action, signaling caution near current record highs.
Written by Razan Hilal, CMT
Nasdaq

AMD's Tsunami Hitting $10,000+ | 8-Decade Blueprint🔥 FOR OUR DEDICATED FOLLOWER: The AMD Upside Target Blueprint is HERE! 🔥
You asked for clarity on AMD's path forward. This is for you, and for every trader who wants to see the real roadmap.
We've broken down the 3-week super-chart that tells the whole story. This isn't just about the next 10%; it's about the next 1,000%.
🎯 The Upside Target Hierarchy: From Tactical to Generational
1. The Wave 3 Target (~$1,000 by 2029)
· This is the MAIN EVENT for the next 5 years.
· We are currently inside this massive third wave.
· It is being powered by AMD's undeniable dominance in the AI and high-performance computing revolution.
· This wave represents the 161.8% Fibonacci Extension of the foundational Wave 1. The math is clear.
2. The Ultimate Wave 5 Target (~$10,000+ Beyond 2050)
· This is the generational wealth target.
· It represents the 261.8% Fibonacci Extension and is the final, parabolic peak of this entire 70+ year cycle.
· This is driven by technologies that are still in their infancy: Quantum Computing, AI Singularity, and interplanetary tech stacks .
🧭 The Trader's Compass: Navigating the Now
· Current Mission: Ride Wave 3 to $1,000 .
· Key Support (The Buy Zone): Any pullback toward the $240 - $230 Fibonacci confluence is a gift within the larger uptrend.
· The Catalyst: The AI boom is not a story; it's a fundamental shift . AMD is a primary architect of this new world.
🚨 NOW, WE TURN TO THE COMMUNITY 🚨
Our follower has their blueprint. Now, we turn to you, the TradingView family , to sharpen it.
We're starting a Chart Battle to help our follower see EVERY angle.
👇 THE CHALLENGE IS LIVE: 👇
Drop YOUR AMD chart below and show us:
· Your Wave Count: Do you agree with our ~$1,000 Wave 3?
· Your Targets: What's your ultimate price and timeline?
· Your Best Chart: Post your cleanest, most convincing technical analysis.
The most insightful bull OR bear case gets pinned at the top. Let's build the most comprehensive AMD analysis on TradingView, together.
Let's get it!
#AMD #ElliottWave #SuperCycle #GenerationalTrade #1000AMD #10000AMD #TechInvesting #Stocks #TradingView #Fibonacci #Wave3 #MarketCycle #LegacyWealth

A Lesson in Patience and structure - ORB waited till 2pm todayFellow traders,
Today tested patience more than precision.
The morning was a maze — choppy price action, overlapping candles, and zero conviction. The ORB range between 9:30–9:45 never gave clean confirmation. Buyers held the low, sellers pressed the top, but neither could gain control. Every candle said, “not yet.”
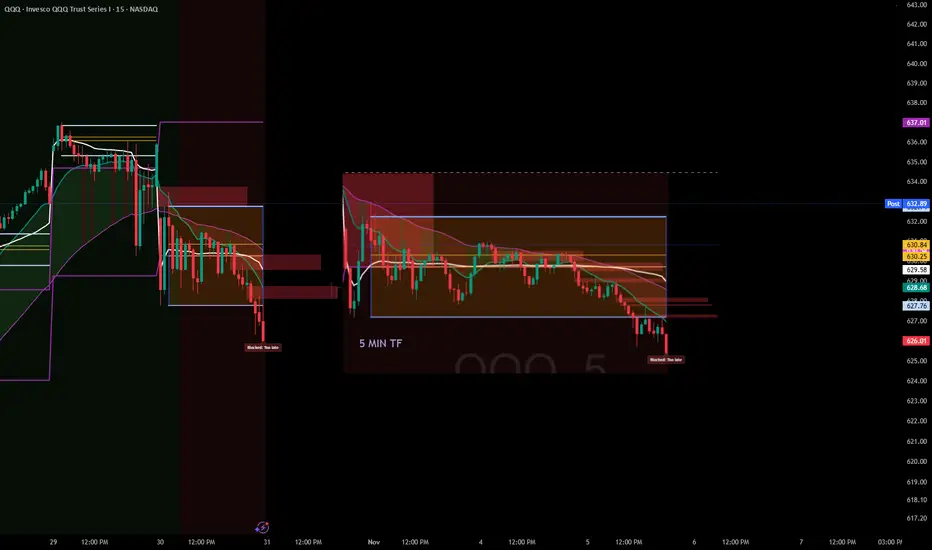
Then came midday compression. From 11 AM to 1:30 PM, QQQ coiled tightly under the EMAs and VWAP. That silence wasn’t random — it was the market loading energy. The moment VWAP was lost for good, the floodgates opened.
Finally, around 2 PM, the breakdown came: a clean retest rejection of the ORB box and an accelerated drop through 629. The move I had been watching all day finally unfolded — only this time, discipline said don’t chase.
And that’s the point of today’s session.
Not every move is yours to catch. Sometimes your biggest win is not forcing a trade that forms too late or breaks your system’s timing window.
Patience is part of the strategy.
The setup played out exactly as it should — I just didn’t have to be in it to learn from it.
Stay disciplined. Stay sharp.
— Trades with B ⚡
Honeywell: Upward?The previously defined Target Zone was clearly breached to the upside, so we have now deactivated and grayed out that zone. The stock is currently in a downward move, which we interpret as a corrective pullback within green wave . We expect this move to conclude above the resistance level at $250.20. However, if price continues to fall and drops below support at $168.99, our alternative scenario will be triggered. In that case, green wave alt. would already be complete, and price would be in green wave alt. (probability: 33%).

Bullish? Maybe This Will Change Your Mind About ETHHi guys,
This monthly inverse chart should make things clear to you that the market is about to crash hard!
Everyone is so bullish and Microstrategy just announced another BTC purchase which is a huge RED ALERT for all crypto investors.
Stay safe and let me know what do you guys think about this !

Philip Morris (PM) Weekly Outlook
NYSE:PM NYSE:PM The price is currently at the long-term ascending channel support. If it falls below 142.33, the $130 area may come into play. Stop loss should be set below 142.33. This is not financial advice.

Nasdaq Computer sector & Nasdaq nearing pullback areaNasdaq Computer (IXCO) Is nearing pullback territory (23,717 resistance). IXCO being the largest sector in Nasdaq (IXIC) means the composite index, now that it's over previous resistance, is also looking for a pullback into support (20,160).
It's possible IXCO will break resistance next year and if that happens whatever gains are made will be lost on an eventual drop back into support.
If you have call options on NVDA or other tech companies closing them when IXCO hits 23,717 is highly advisable. If it hits there around this January it could be 2 years before IXCO resumes the uptrend past 23,717. Calls will likely get destroyed during this time.
Another note is lots of tech IPOs are occurring this year with lofty valuations. When this IXCO pullback comes they are likely to get hit hard. It's a great opportunity to short or wait to buy up the ones you like when the pullback is over.
As always good luck and try your best to avoid getting into new tech related trades as this year ends. It's going to be a great idea to have cash ready next year.

Opendoor Technologies (OPEN) – Bulls Still Holding the Door OpenWhat a ride it’s been for OPEN!
Back in early July 2025, the stock finally broke above its 50-day MA, and that was the spark that started an incredible rally — all the way to a major resistance zone from June 2022.
Then, as always, the market had to test everyone’s patience — a shooting star reversal formed, price pulled back into the 0.382–0.5 Fibonacci zone, and built a solid double bottom.
Once that double bottom broke out around 13–14 August, it was rocket fuel — a massive +247% run until 11 September 2025! 🚀
Since that peak, OPEN has been cooling off — retracing with low volume and shaping a falling wedge, which usually hints at bullish continuation. The price even bounced at EMA-50 and printed a hammer candle, showing that buyers are still defending the trend.
As long as the price holds above $6.23 (hammer support), bulls are still in charge.
Break that level? Then the bears might finally get a turn.
Until then — the door’s still open for another breakout! 😉
Trade Idea 💡
Bullish scenario: Wait for a breakout above the falling wedge with volume — that’s your green light.
Support to watch: $6.23 (hammer low).
Stop loss: Just below that support.
Take profit: Trail as long as price stays above the MA-50 or aim for the $13.70 zone .

Cambium Networks Corporation (CMBM) Spike 300% in Premarket Cambium Networks Corporation (NASDAQ: NASDAQ:CMBM ) saw a noteworthy uptick of 300% gearing for a 500 surge amidst breaking out of a falling wedge .
With the last recorded RSI at 38, NASDAQ:CMBM has more room to capitalize on the dip.
In another event, Cambium Networks (NASDAQ: CMBM), today announced integration of its Cambium ONE Network solution with Starlink satellite Internet services. The integration enables scalable management, visibility, and performance optimization for Starlink Low Earth Orbit (LEO) satellite connections in conjunction with Cambium's Network Service Edge (NSE) security/SD-WAN platform and the cnMaestro™ cloud management system.
The integration brings enterprise-grade services to networks connected to Starlink, delivering enhanced security, traffic intelligence, and multi-WAN scalability to businesses, schools, service providers, and distributed enterprises that depend on satellite broadband for critical connectivity.
About CMBM
Cambium Networks Corporation designs, develops, and manufactures fixed wireless, fiber broadband, and enterprise networking infrastructure solutions in North America, Europe, the Middle East, Africa, the Caribbean and Latin America, and the Asia Pacific. The company offers fixed wireless and PON/XGSPON based broadband, Wi-Fi, and local area networking (LAN) switching infrastructure; and security gateway solutions for a range of applications, such as broadband access, wireless backhaul, Internet of Things (IoT), etc.

US Equities have this week left... only this week to be (divergently) bullish.
5 Nov or thereabouts should break down for three weeks.
26 Nov should expect a bounce, Santa rally into the 2026 New Year. 2026 looks terrible really...
Short sharp and sweet.
Take care!

Nvidia Just Under Major SupportNvidia seems to have been pulled down by the Dow just like Apple as both are just under major support. I'm sorry for my previous Nvidia chart that drew support near 140, I recognize where I screwed up, but this chart should be good. Fortunately actual 117 support wasn't that far below and my NVDA isn't too in the red.
NVDA has the lowest revenue multiple in years right now. I know it's well off it's long term trend line, but it's growth rate is unlike anything it's ever been so expecting a steeper trend line to appear makes a lot of sense. Eventually I would imagine we'll get back to that trend line, but not anytime soon.
The Dow hitting major support should finally lift NVDA and the others that have been dragged down like AAPL and AMZN.
Good luck!

NasdaqHello traders! Last Friday, we had a major selloff in the 25,000 region, which quickly sent the Nasdaq crashing by more than 4% in just a few hours. In technical analysis, 24,000 is a price that has been broken previously and is now being tested as weekly support. If we expand this movement, we project a target price of 26,000, continuing the upward movement. The technology sector remains promising with advances in artificial intelligence, and we have no news of a Federal Reserve interest rate hike. Happy trading!

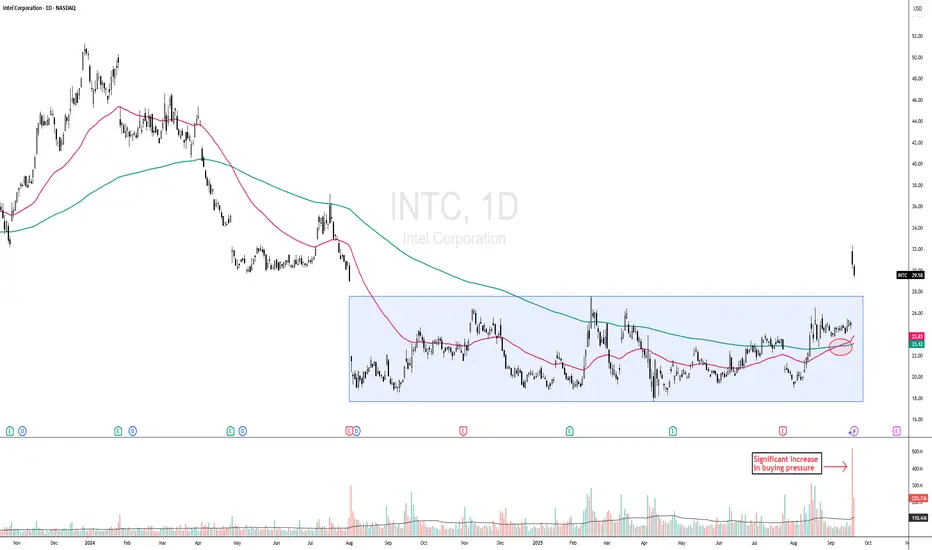
DOW THEORY PLAY - INTC CONFIRMS BREAKOUT FROM ACCUMULATION PHASEINTC - CURRENT PRICE : 29.58
Key Technical Highlights:
1. Breakout from Accumulation Phase with Strong Volume
Intel has successfully broken out of a prolonged sideways accumulation zone. The breakout is accompanied by significantly higher-than-average volume , indicating strong buying interest and institutional participation.
2. New 52-Week High Achieved
Price has breached the previous 52-week high, signaling bullish momentum and the potential start of a new price discovery phase. Historically, such breakouts often attract trend-following traders.
3. Golden Cross Formation (look at the red circle)
A Golden Cross has formed for the first time in a long period, where the 50-day EMA has crossed above the 200-day EMA — a classic long-term bullish confirmation. Notably, the last occurrence of this pattern was in July 2023 , making this the first reappearance in over two years, further reinforcing its significance as a potential turning point in market sentiment.
4. Dow Theory Alignment – Public Participation Phase
According to Dow Theory, this marks the second phase of a major uptrend — the Public Participation Phase — where broader market participants begin to enter following early accumulation by smart money. This phase typically sees strong price advances.
ENTRY PRICE : 28.00 - 30.00
FIRST TARGET : 35.00
SECOND TARGET : 42.00
SUPPORT : 25.00 (CUTLOSS below 25.00 on closing basis)
Note : This is related to point no 1. Markets have a tendency to "fall of their own weight." At bottoms, however, markets require a significant increase in buying pressure, reflected in greater volume, to launch a new bull market. A more technical way of looking at this difference is that a market can fall just from inertia. Lack of demand or buying interest on the part of traders is often enough to push a market lower; but a market does not go up on inertia. Prices only rise when demand exceeds supply and buyers are more aggressive than sellers.
Breaking: TEN Holdings, Inc. (NASDAQ:XHLD) Spike Over 100% TodayThe price of TEN Holdings, Inc. (NASDAQ NASDAQ:XHLD ) broke out of a falling wedge spiking over 100% today during Tuesday early market session.
With buying momentum increasing as seen by the RSI at 88, NASDAQ:XHLD might reclaim the $2 resistance in the short to long term.
In another news, TEN Holdings, Inc. (NASDAQ NASDAQ:XHLD ) recently announces a strategic agreement with V-Cube, Inc., its controlling stockholder and a leader in the global virtual events industry in Japan and Singapore.
TEN Holdings and V-Cube are unifying their respective technologies and expertise to deliver advanced communication and event technology tailored for the North American enterprise market, valued at USD 34.39 billion in 2024 (Grand View Research).
About XHLD
TEN Holdings, Inc. provides event planning, production, and broadcasting services in the United States. The company organize virtual, hybrid, and physical events, including conferences, marketing events, product launches, trainings, and investors and shareholder meetings. Its events are enabled by its Xyvid Pro Platform, an internet-based broadcast platform with interactive engagement tools designed to provide web broadcast audiences with a dynamic, interactive, and engaging virtual event experience.

COINBASE (COIN) – Watching for Pullback Entry Around $343Coinbase NASDAQ:COIN has surged nearly +20% since our previous update, powered by strength in the broader crypto sector. With price action now extended, we’re watching for a pullback opportunity around the $343 area — a previous zone of interest where buyers may step back in.
💡 Trade Setup:
Entry Zone: $343 (on pullback confirmation)
Take Profit Targets:
TP1: $360–$390
TP2: $415–$440
Stop Loss: $303 (below key support)

DXY Long-Term big surprise revealed by Gold! Hi Guys,
I've been doing some research on the DXY and Gold charts and I've been reading news headlines
For the past 20 years and trying to link it with both DXY and Gold charts and I've found out
Some interesting facts that literally flipped the market upside down.
So I pointed each even with the corresponding candle and I would love to know what do you guys
Think about this so feel free to comment and share your opinion on what's really going on behind
The scenes.

Red Alert !... ETH got rejected at the topHi guys,
If you zoom out of ETH you'll notice that its moving sideways on the Weekly/Monthly chart
Which can be bullish or bearish at the same time BUT recently we've seen the price gets rejected at the top of the sideways channel on three different monthly candles which is a red alert in my book.
Now I'm not saying that its going down a 100% but not breaking out of the channel is a very bad sign and could mean the signal for a major drop to the lows of the channel.
Not to mention the 4 years cycle of bitcoin is due and all realistic traders are expecting Bitcoin to drop to the previous all time high at 69000$ and if that happens all alt coins will go down too.
Crypto twitter is insanely bullish (very bad sign) and almost all big markets including US stock market and Gold are at all time high and extreamly over valued so don't listen to the greedy social media or the news and listen to reason and common sense here.
Risk management is advised so stay safe out there and let me know what do you guys think my this.

NASDAQ Watching 24,975 for Fresh Bounce in Ongoing UptrendHey Traders,
In tomorrow’s trading session, we are monitoring NAS100 for a buying opportunity around the 24,975 zone. NASDAQ remains in a broader uptrend and is currently undergoing a healthy correction, approaching the key 24,975 support and resistance area that aligns with the ascending trend structure.
If buyers step in at this level, we could see a continuation of the bullish momentum in line with the prevailing trend.
Trade safe,
Joe

Is Nasdaq Set for a Pullback? | Fibonacci Resistance Zone ahead!In this video I map out the idea of the Nasdaq being over extended and on route to approaching a key Fibonacci resistance level 27000 ,
This may set up a potential correction in the week ahead."
This is a counter-trend setup within a larger uptrend, so risk management is key. I'm not calling a top to the entire rally, but rather a healthy pullback to bring in new buyers."
I demonstrate how i see the price action moving forward over the course of the month ahead with valuable insights.
Tools used in this video Standard Fib , Fib Expansion, Fib extension + Anchored vwap and Volume profile and TPO chart

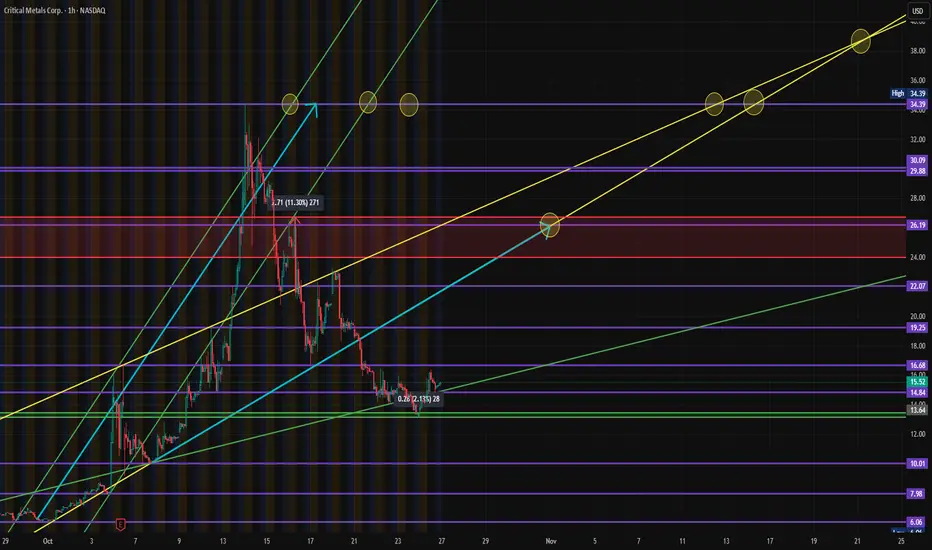
$CRML - Critical Metals - $16.08 Breakout | $26.19 RetestNASDAQ:CRML has been one of the most explosive rare-earth plays of 2025 — rallying from the single digits to a 52-week high of $34.39 before pulling back sharply to consolidate around the $13.64 support zone.
After cooling off from that massive run, price action has now begun compressing between $13.64 and $16.08, with early signs of base-building before another potential leg up.
🧩 Technical Outlook
Strong rally → deep correction → accumulation structure forming.
Support Levels: $13.64 (core zone), $10.01 (strong confluence), and $7.98 (long-term floor).
Resistance Zones: $19.25 → $22.07 → $26.19.
Channel projection shows potential for re-test of $26.19 by November if current momentum continues.
Higher timeframe targets extend to $30.09 and $34.39 in Q1 2026 if the bullish structure holds.
The setup favors accumulation entries below $16.08, with a short-term target to retest $22.07 and potentially $26.19 once momentum returns.
📰 Recent News & Fundamentals
Critical Metals shares have been volatile following major financing announcements:
📉 Announced offering of 18.03 million shares triggered a short-term selloff.
💰 Confirmed $50 million PIPE financing, strengthening capital for expansion.
🌍 Broader rare-earth momentum continues as China tightens export restrictions and JPMorgan initiates new investments into critical mineral supply chains.
Despite the correction, the sector tailwinds remain strong — and NASDAQ:CRML ’s European lithium and rare-earth projects (Tanbreez and Wolfsberg) position it strategically for the energy transition theme dominating the next decade.
📊 Sentiment Snapshot (from Schwab QORE Analytics)
Rating: F (Strongly Underperform) – percentile rank 100
26-week price change: +834%
Beta: 1.14
Sector: Materials / Diversified Metals & Mining
High volatility + weak sentiment ratings often precede large technical reversals — a setup that speculative traders should be watching closely.
💡 My Plan
I’m watching for clean accumulation below $16.08 for a potential re-entry swing trade.
Stop: under $13.50
Targets: $22.07 → $26.19 (swing)
Longer-term projections: $30 → $34 if the bullish trend resumes into 2026.
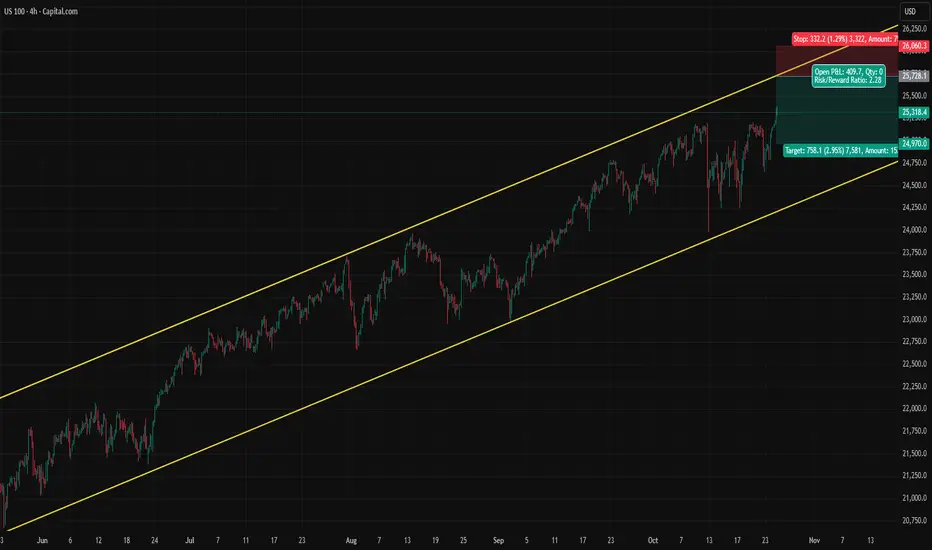
Nasdaq Enjoys CPI, But How Much More?Nasdaq still trending up, enjoying the today's lower than expected CPI data. If it ride towards the upper line of the channel, it likely to get rejected. I don't see any reason for an upside breakout at the moment. Setup is for today and Monday, I will deactivate my order after Monday.
Risk/Reward: 2.28
EUR/USD | Breaks Higher After CPI Data – Next Stop 1.17?By analyzing the EUR/USD chart on the 2-hour timeframe, we can see that after an initial rise, price corrected to 1.15765, then gained strong buying pressure and climbed up to 1.165 so far.
Following today’s CPI report , which came in lower than expected, the euro strengthened and the U .S. dollar weakened .
I expect EUR/USD to continue its upward move, with the next target at 1.16710 . If price breaks above this level, the following targets are 1.16815 and 1.16950.
Please support me with your likes and comments to motivate me to share more analysis with you and share your opinion about the possible trend of this chart with me !
Best Regards , Arman Shaban

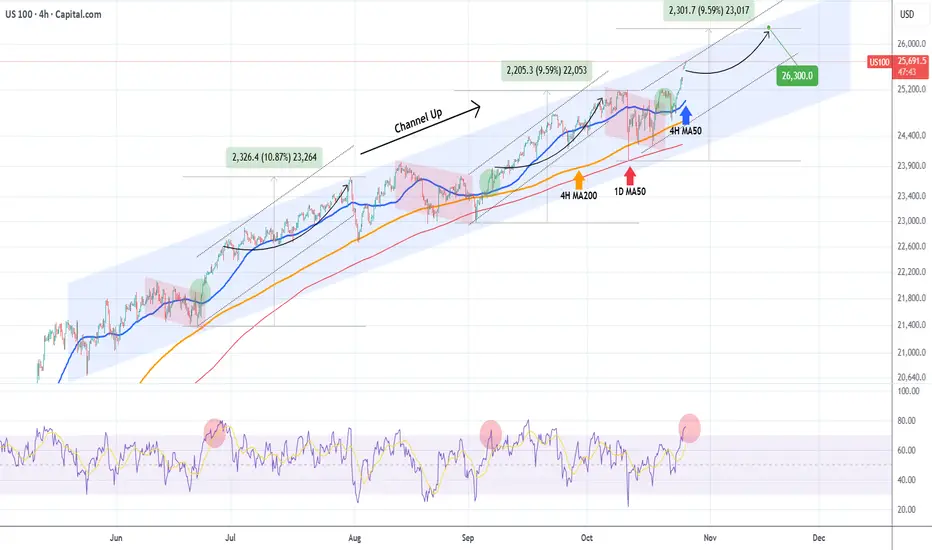
NASDAQ Needs some sideways relief but remains bullish.Nasdaq (NDX) continues to extend the new Bullish Leg of its 5-month Channel Up, having turned the 4H MA50 (blue trend-line) as its short-term Support, in line with both previous Bullish Legs.
We still expect at least a +9.59% rise, targeting 26300, to be completed before the pattern's new Higher High is priced but as the 4H RSI turned overbought (red circle), we expect the price to slow down a little, maybe seeking the 4H MA50 again as it happened in July.
In any event, the long-term trend remains bullish, until the 1D MA50 (red trend-line) breaks.
-------------------------------------------------------------------------------
** Please LIKE 👍, FOLLOW ✅, SHARE 🙌 and COMMENT ✍ if you enjoy this idea! Also share your ideas and charts in the comments section below! This is best way to keep it relevant, support us, keep the content here free and allow the idea to reach as many people as possible. **
-------------------------------------------------------------------------------
💸💸💸💸💸💸
👇 👇 👇 👇 👇 👇