Why Risk Management matters more than WIN RateWhy Risk Management matters more than WIN Rate
Welcome everyone to another educational article.
If you are enjoying these, please make sure to follow for more!
Lets get started.
Definitions:
Risk Management > Is the process of defining:
- What you can afford to lose completely
- The percentage of all your capital, risked per trade
- How losses are controlled, before you take a trade
Risk management allows you to Stay in the game . It protects your capital and account from blowing up, from your emotional ideas.
Win Rate > is the percentage of trades that:
- Hit Take Profit
- Hit Stop Loss
- Hit Break Even
Win rate alone does Not determine profitability. A high Win Rate w/poor risk management can still lose you money.
Straight Into It
Risk management is more important than win rate because defining your risk allows you to take many trades over time.
If you “go all in” on one trade:
- You technically have a 100%- win rate system if it wins
- But it is based on one outcome
This system is flawed because it relies on a single result, not probability.
Trading is not one trade it is hundreds.
Why Defined Risk Wins Over High Win Rate
When you define your risk:
- You control downside
- You survive losing streaks
- You allow probability to play out
A system that wins over:
- 100
- 200
- 300 trades
It is far more reliable than a system based on one trade.
Consistency over time always beats one-off success.
Example: Risk in Practice
Let’s say you have $100.
When people say “ risk 1% ”, they mean:
- Risk $1 per trade
- Not $100
Using leverage (example: 10x):
- Your capital risk is $1
- Your margin exposure becomes $10
This allows you to trade 10% position size while only risking 1%.
If the trade loses:
- You still have $99
- That’s 99 more attempts
That’s how systems survive.
Why This Matters Long-Term
Risk management:
• Reduces emotional pressure
• Prevents revenge trading
• Keeps drawdowns manageable
• Allows confidence to grow naturally
Win rate looks good on paper.
Risk management keeps you alive long enough to profit.
Extra Insight
A trader with:
• 40% win rate
• Strong risk management
Will outperform a trader with:
• 70% win rate
• Poor risk control
Why?
Because the first trader survives long enough for probability to work.
Conclusion
Win rate tells you how often you win.
Risk management determines whether you stay in the game.
One trade proves nothing.
A hundred trades prove everything.
Define your risk .
Respect probability.
Trade for longevity > not ego.
Check out the process of "Understanding Risk Management here" Here:
Nasdaq

#202606 - priceactiontds - weekly update - nasdaqGood Evening and I hope you are well.
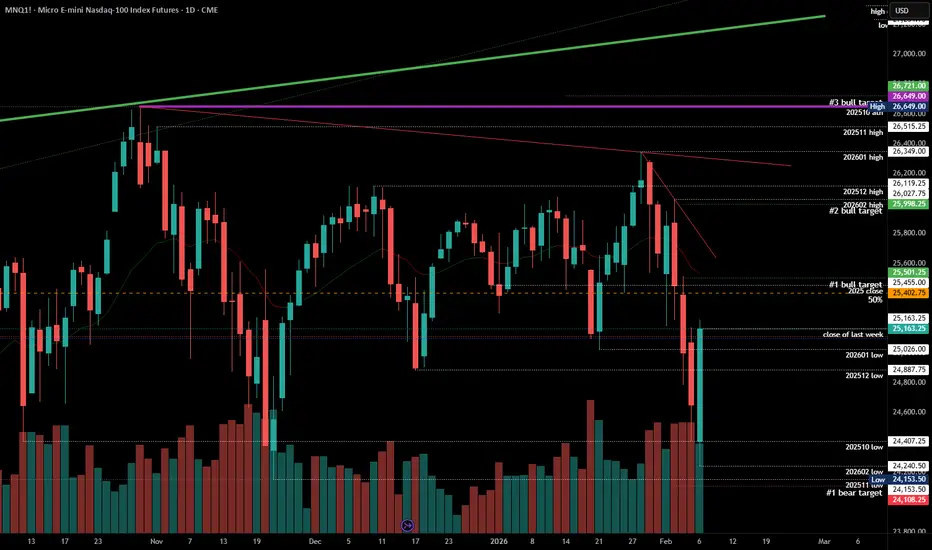
comment: Just have to be bullish about this double bottom below 24300. Same reasoning as for dax. Friday was so strong that I expect bears just gave up. I expect at least 25700 early next week and then we can have a pullback before the market decides if we print new highs or not.
current market cycle: trading range since November but since bears just fail to close consecutively below the weekly 20ema, we are also still in the bull trend
key levels for next week: 25000 - 27000
bull case: Big double bottom with the November low and Friday was strong enough to expect much upside. A measured move up would bring us very close to the January high and that is most likely the most important resistance for next week. The bulls have all the arguments on their side to continue sideways to up. We have not traded below 24000 since September 2025 and every touch or dip below the weekly 20ema is heavily bought. Upside targets in order are 25500, 26000, 26360, 26650, 27000.
Invalidation is below 24153
bear case: Exactly the same as in dax. As a bear you can not hold short here. Only a news-bomb can reverse it. I’d be very surprised if we stay below 26100 next week.
Invalidation is above 26100
short term: Bullish for at least 26000. We could dip down to 24800 again before more upside but I highly doubt that.
medium-long term - Update from 2026-02-08: Neutral over the next months. At least for now. I hope for a bigger down turn but at the moment I can only expect new ath so it’s stupid to look for lower targets than 24000.
NAS100 – Key Decision Zone | Buy & Sell ScenariosPrice is currently approaching a marked supply / reaction zone near 25,000 – 25,050, where market structure suggests a potential decision point. Momentum is recovering from recent lows, but price remains within a broader corrective structure, making both directional scenarios valid.
🔵 Bullish Scenario (Primary Continuation)
A sustained hold above the grey demand-turned-support area with acceptance above 25,050 may confirm bullish continuation. Buyers would likely target the marked liquidity levels progressively:
TP1: 25,415
TP2: 25,922
TP3: 26,220
Structure suggests a potential higher-low formation, and continuation becomes stronger if pullbacks show decreasing selling pressure.
🔴 Bearish Scenario (Rejection From Supply)
Failure to maintain strength inside the zone, especially with bearish rejection wicks or volume increase on selling, may trigger a downside rotation. Invalidation of bullish structure could lead price toward:
TP (Sell): 24,170 support region
This area aligns with previous demand and liquidity resting below recent swing lows.
📊 Technical Notes
RSI is approaching higher levels, indicating short-term momentum strength but also potential for reaction at resistance.
Volume expansion into the zone suggests active participation; confirmation should come from follow-through candles rather than anticipation.
Market remains reactive — wait for confirmation around the marked zone before committing to directional bias.

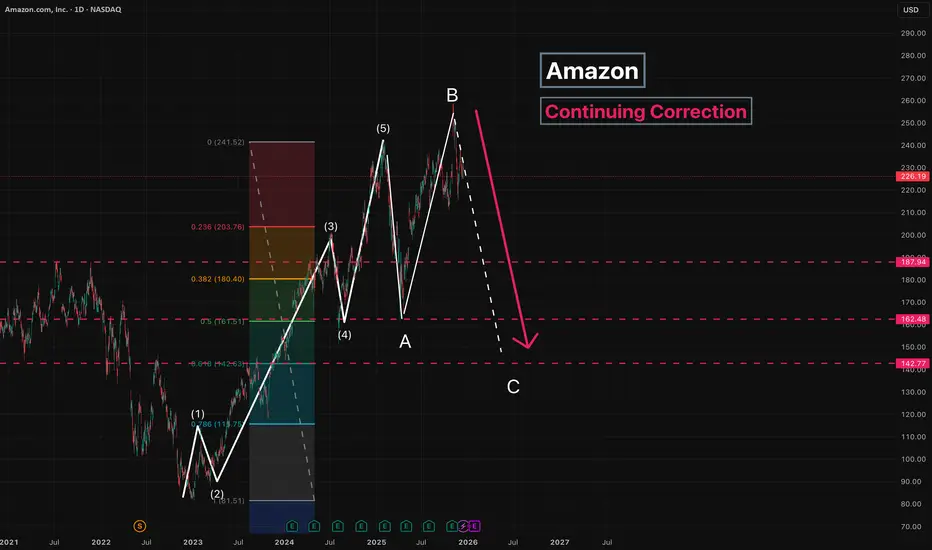
Amazon - Continuing CorrectionThe correction is ongoing, and wave C has started to form.
Since wave B is longer than wave A , wave C is expected to move below the low of wave A .
Main target: 142
Intermediate target: 187
---
Please subscribe and leave a comment.
You’ll get new information faster than anyone else.
---
TTWO - Major CorrectionLet’s continue breaking down the corrective structure in Take-Two Interactive Software.
The peak was set back in January 2021, and the move since then is part of a broader correction.
Wave A finished in November 2022, and Wave B followed.
By October 2025, Wave B ended, a new high was made within the correction, and Wave C has kicked off.
This is an expanded flat correction.
Wave C is a five -wave impulse, which we are now tracking.
Here’s a look at the previous idea:
The start of the impulsive moves was marked correctly.
Current structure:
The move from October 2025 is the main impulsive wave
The move from late December 2025 is Wave 3 within that impulse
Right now, within wave 3 , a local pullback of 8-12% from the current level is possible:
After that, the impulse should continue:
Next comes a subwave correction:
Finally, the main impulse should complete:
The plan assumes 50-60% retracements, but in reality pullbacks can be smaller, around 38% .
Keep in mind: down moves are usually faster than up moves.
Key level to watch: 171
If it holds, the stock could still push higher and make new significant highs.
Conclusion:
Wave C is moving down
We’re navigating between the described corrections and targets.
Key targets:
128
105
Potential move from the current level: 33-46%
---
Subscribe and leave a comment.
You’ll get new ideas faster than anyone else.
---

Quick Trade on PATHTechnical bottom on PATH and Reversal Candle pattern
RSI rebound
This is a TRADE not an INVESTMENT.
Entry 12.6-13
TP @ 15.2
SL @ 11.4

Clear double Top on AMD - Ready Buy LimitsClear double top
Gap always closes
This trade is placed to catch a falling knife
Ready buy limits at 160
TP @ 260

Buy the Dip on Amazon
BUY @ 200-210
Long hold
Still waiting for AMZN to catch up on the AI race, they have such great sticky ecosystem for leveraging AI integration in robotics, automation and IOT.
Not to mention the lacklustre monetization in their existing robotics arm.
On this aspect it is possible for almost full replacement of headcounts in AMZN's fulfilment centers with automation and robotics - hence heavy decrement in recurring manpower costs.
I foresee an amazon Trainium resurgence from Anthropic's collaboration with AWS.
Overall, adding a big bag to this one

Buy AMAZON now!! Huge discount sale for an ecommerce behemoth!
Technical Analysis
- Triple bounce off $101 level with big reaction upwards,
- this region used to be resistance now flipped support.
- Its also the 61.8% retracement level (golden zone for a rebound)
- stochastic RSI was in oversold, now rebounding
Trades:
Short term traders can look for a LONG from current level
For long term traders this is a good region to BUY MORE AMAZON

Easy Buy on Netflix - Breakout of Ascending Channel !Netflix is currently down almost 50% from its all time high in Nov 2021.
Currently traded in an ascending channel since Oct 2022 and briefly broke out above with strong volume to close at 357.42 as of market close.
Now we look for some profit taking and pullback to retest the top of the channel
Buy zone is:
336 - 357
Take profit:
393
Now we have the 50 EMA crossing the 200 EMA, with the 100 EMA close behind. A cross of 100 EMA will signal stronger bullish momentum on Netflix stock, giving us more room for upside.

BUY for NFLXI still believe the WBD is long term accretive for NFLX, major boost in IP from WBD acquisition and stronger moat in streaming services. Cost of acquisition should already be priced in for the one time cash expense
Buy zone @ 75-90
Targets @ 105, 110, 115 or LONG HOLD

ORACALE (ORCL) Rally! Cycle 3 → $400, Eyes on Supercycle $6,000🌀 ORACLE (ORCL) – Elliott Wave Supercycle Analysis | Smart Money & Fibonacci Confluence
🔭 Macro Perspective
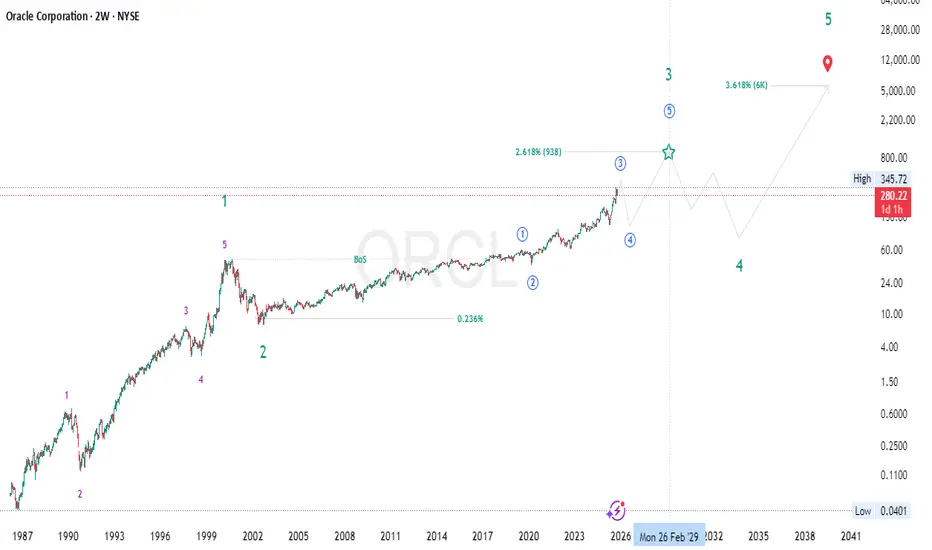
Oracle’s long-term chart (NYSE: ORCL) showcases a powerful Supercycle (III) wave in motion — a multi-decade expansion phase fueled by institutional participation, structural growth, and technological innovation.
The internal Cycle waves (1–5) are clearly defined, with current price action positioned deep within Cycle Wave (3) — the strongest segment of this major bullish leg.
🟢 Supercycle Wave (I) (1987 – 2000)
Elliott Behavior: The first grand impulsive advance, representing Oracle’s rise during the early software and database revolution.
Fibonacci Structure: Wave (3) extended toward the 2.618× of Wave (1), typical of an early institutional growth wave.
SMC Dynamics:
Breaks of structure (BoS) at each impulsive stage.
Liquidity sweeps before rallies — consistent smart money accumulation patterns.
Fundamentals: Explosive earnings growth through enterprise software adoption and global market expansion.
💥 Conclusion: The dot-com peak in 2000 completed Supercycle (I).
🔵 Supercycle Wave (II) (2000 – 2002)
Nature: The sharp, emotion-driven retracement following the tech bubble.
Fibonacci Retracement: Retraced into the 0.236 zone of (I), providing the long-term discount region for accumulation.
SMC Characteristics:
Liquidity grab beneath 1998–1999 structure.
Long accumulation base confirming institutional re-entry.
Fundamentals: Oracle streamlined operations and built the groundwork for enterprise-level solutions.
🧱 Bottom: Wave (II) ended around 2002 — the base of today’s decades-long uptrend.
🟣 Supercycle Wave (III) (2002 – 2030s, ongoing)
This ongoing macro impulsive wave contains five internal Cycle Waves (1–5) .
⚪ Cycle Wave (1) (2002 – 2019)
Elliott Context: A powerful, sustained impulsive leg lasting nearly two decades.
Structure: Clean five-wave advance with strong extensions during 2010–2019.
Fibonacci Note: The move achieved near the 1.618× extension relative to its starting point.
SMC Insight:
Consistent higher highs and higher lows throughout the period.
BoS continuation patterns confirming institutional markup.
Fundamentals: Expansion of Oracle’s business model — cloud transition, data analytics, and enterprise software dominance.
📈 End: Cycle (1) peaked near 2019 , completing the first internal impulsive leg of Supercycle (III).
🔵 Cycle Wave (2) (2019 – 2020)
Nature: A sharp yet shallow correction that coincided with the global market decline (COVID crash).
Fibonacci Retracement: Retraced around the 0.236–0.382 zone of Wave (1).
SMC Dynamics:
Liquidity sweep under 2018–2019 structure.
Fast accumulation pattern — strong re-accumulation footprint.
Fundamentals: Short-term market shock, but Oracle’s fundamentals remained intact and rebounded swiftly.
🧭 Conclusion: Cycle (2) ended in 2020, setting the foundation for the explosive ongoing Cycle (3) rally.
🟢 Cycle Wave (3) (2020 – ~2026, in progress)
Elliott Context: The most powerful internal impulsive wave — currently unfolding.
Target Zone: Projected to complete near $380–$400 , expected around late 2025 to early 2026 .
Fibonacci Extension: The 2.618× extension of Wave (1) perfectly aligns near $400.
SMC & Market Structure:
Continuous BoS and HH–HL formations — clear institutional control.
No macro distribution yet; structure remains intact.
Liquidity inducements near highs suggest ongoing markup phase.
Price Action: Aggressive impulses, shallow retracements, and orderly continuation patterns.
Fundamentals:
Rapid expansion in Cloud Infrastructure (OCI), AI-driven services, and recurring revenue models.
Sustained EPS growth and improved margin performance support wave maturity.
🚀 Expectation: Completion near $400 will likely trigger a Cycle (4) corrective structure before the final impulsive push.
🟠 Cycle Wave (4) (Projected: 2026 – 2028)
Elliott Behavior: A corrective phase — retracing part of the strong Cycle (3) run.
Fibonacci Retracement: Expected correction into the 0.236–0.382 zone of Wave (3), roughly $200–$280.
SMC Insight:
Break of structure (BoS) near top zones to induce liquidity.
Re-accumulation base forming after liquidity sweep below key supports.
Market Psychology: Cooling from euphoria, consolidation, and rebalancing of valuations.
Fundamentals: Period of stabilization after several years of aggressive expansion.
📉 Outlook: Likely forms the structural foundation for the next rally phase (Cycle 5).
🟢 Cycle Wave (5) (Projected: 2028 – early 2030s)
Elliott Context: The final impulsive leg completing Supercycle (III).
Target Zone: Fibonacci 3.618× extension (~$900–$950) of Cycle (1).
SMC Structure:
Final markup phase with strong BoS continuation patterns.
Climax rallies as retail sentiment peaks.
Price Action: Parabolic trend, thin retracements, and expanding volatility.
Fundamentals: Oracle could cement its dominance in global data, AI, and enterprise infrastructure markets.
💎 Completion: Cycle (5) will mark the end of Supercycle (III), leading into the long-term corrective Supercycle (IV).
🔶 Supercycle Wave (IV) (Projected: 2030s – 2040s)
Nature: Major macro correction after decades of expansion.
Fibonacci Depth: Likely retraces into the 0.382–0.5 zone of (III).
SMC Behavior: Distribution → liquidity sweep → re-accumulation.
Market Context: Could align with macroeconomic tightening or sectoral rotation.
📊 Purpose: To reset valuations and build energy for the final Supercycle (V).
🟩 Supercycle Wave (V) (Projected: 2040s – 2050s)
Elliott Context: The final impulsive wave of Oracle’s century-long trend.
Fibonacci Target: 3.618× expansion (~$6,000).
SMC Behavior: Final institutional markup followed by distribution and secular reversal.
Fundamentals: Could coincide with Oracle’s role as a global AI–data infrastructure leader.
🚀 Legacy Wave: The culmination of decades of innovation and expansion.
⚙️ Macro Summary
Accumulation (1980s–1990s) – Smart money foundation.
Expansion (2000s–2020s) – Institutional markup phase.
Distribution (2030s) – Macro correction and rotation.
Re-accumulation (Post-2040s) – Long-term reset for future cycles.
🧠 Technical & Fundamental Alignment
✨ Elliott Structure: Clear impulsive (I–V) sequence with macro rhythm.
✨ Fibonacci Confluence: $400 (2.618× of Wave 1) & $900 (3.618× of Wave 1).
✨ SMC: Institutional control with clean BoS → reaccumulation → continuation.
✨ Price Action: Aggressive bullish order flow with no macro distribution yet.
✨ Fundamentals: Oracle’s AI + Cloud strategy drives sustainable growth.
🌍 Conclusion
Oracle (ORCL) continues to trend within Supercycle (III) — the most powerful long-term wave.
Cycle Wave (3): In progress, targeting $380–$400 by end of 2025 / early 2026.
Cycle Wave (4): Anticipated retracement toward $200–$280 zone.
Cycle Wave (5): Final impulsive run toward $900+ into the early 2030s.
📈 Macro Bias: Long-term bullish — institutional structure intact.
📊 Short-term Outlook: Momentum strong but nearing Cycle 3 completion; prepare for corrective rotation.
💬 Summary: Oracle’s price evolution beautifully mirrors its technological growth story — a near-perfect alignment of Elliott Wave symmetry , Smart Money structure , and fundamental strength . The completion of Cycle 3 near $400 will open the door to an ideal re-entry opportunity for the next macro leg higher.
#ORCL 📈 #Oracle 💼 #ElliottWave 🌊 #WaveAnalysis 🔹 #Supercycle 🚀 #Fibonacci 📊 #SmartMoney 💎 #PriceAction 🕯️ #MarketStructure 🏗️ #LongTermBull 🟢 #StockAnalysis 💹 #TechnicalAnalysis ⚙️ #Investing 💰 #TradingViewIdeas 💡
💬 Respected traders and analysts!
Your insights matter. Share your views, confirmations, or constructive criticism in the comments below. Let’s discuss ORCL’s structural evolution, Elliott Wave setup, and long-term Supercycle potential 🚀📈.
— Team FIBCOS 💎
NASDAQ (US100) – Trading Plan for Today | February 06🔥 NASDAQ (US100) – Trading Plan for Today | February 06
The session started with a bearish open.
Price opened below the key level at 24,686,
while the key level itself is located below the Value Area.
This structure confirms a short-biased intraday context.
Additional cluster context:
Intraday plan
Primary scenario (short):
– short positions remain the priority.
Downside target:
– daily short zone.
Alternative scenario:
– longs will be considered only after acceptance above the daily long zone,
– in that case, the target shifts toward the long reversal zone at 25,069.
As long as price remains below 24,686,
bearish bias remains valid.
This is not financial advice. Risk management is required.

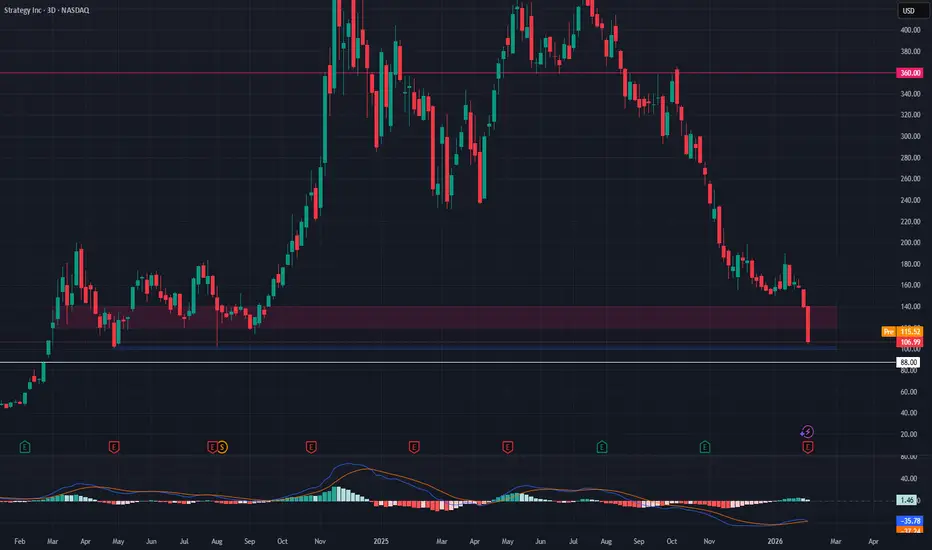
MSFT - High-Risk Reaction Trade at HTF SupportNASDAQ:MSFT is now down nearly 80% from its all-time high, approaching a major higher time frame (HTF) support zone. This is not a trend reversal play — it's a reaction trade at a critical level where a bounce is possible if sentiment stabilizes. The risk is high, but so is the short-term reward potential if the level holds.
📌 Trade Setup:
Entry Zone: $100 – $102
Take Profit: $120 – $140
Stop Loss: $88.00
This trade relies on a tight risk management strategy, given the strong downtrend. We’re looking for a bounce, not a reversal — if support cracks, we’re out.
XAU/USD | NWOG retest (READ THE CAPTION)Gold went as low as 4655 last night after going through Feb 3rd NDOG before making it back up and is now being traded at 4858, inside the Feb 2nd NWOG. If it holds above the Consequent Encroachment of the NWOG, then I expect it to go and retest the NWOG high.
Targets: 4877, 4890, 4905 and 4920.
If it fails: 4844, 4830, 4815 and 4800.

Palantir - Going DownFrom April to October 2025, a fifth wave to the upside formed.
After that, the stock entered a corrective phase.
According to the plan, we expect a retracement toward the start of Wave 5 .
Given the fast price action and the large number of minor corrections, we will focus only on the major, higher-timeframe targets.
Proceed with caution - a pullback is expected even from the current level.
Key targets:
115 - or slightly lower; a corrective bounce (upward move) is expected here as part of wave 3 of the impulse
83
63
The potential move from the current level is 34-50% .
---
Subscribe and leave a comment.
You’ll get new ideas faster than anyone else.
---

Is Tesla entering a distribution phase before a potential move?Could Tesla be in a distribution phase before heading south? 300 is a critical support—lose it, and 130 comes into play.

#EURUSD , Time to Fly?📊 Morning Market Brief | London Session Prep
🔎 Instrument Focus: #EURUSD
⚠️ Risk Environment: High
📈 Technical Overview:
Not a Quality setup at all but with a valid structure we can have it as QuickScalp
🚀 Trading Plan:
• Need Valid momentum Structure Close
• LTF ENTRY NEEDED ‼️
• Just and Only for QuickScalp
🧠 Stay updated with real time news and macro events, visit 👉 @News_Ash_TheTrader_Bot
** Please LIKE 👍, FOLLOW ✅, SHARE 🙌 and COMMENT ✍ if you enjoy this idea! Also share your ideas and charts in the comments section below! This is best way to keep it relevant, support us, keep the content here free and allow the idea to reach as many people as possible. **
#Ash_TheTrader #Forex #EURUSD #MarketInsight #PriceAction #TradingPlan #RiskManagement #LondonSession #Scalping #Futures #NQ #Gold

Tesla - Electric Car Rolling LowerWe continue the downside move described in several previous posts.
We are drawing a corrective wave of the larger move.
Inside the corrective wave, four impulse sub-waves have already formed, and we are now forming the fifth sub-wave.
Key levels:
408
393
368
The most probable completion zone appears to be between 393-368 , which corresponds to roughly 50-60% of the primary move.
The downside potential from current levels is estimated at 2-12% .
---
Please subscribe and leave a comment!
You’ll get new information faster than anyone else.
---

AMD — Everything Looks BadSince October 2025, AMD stock has been correcting.
Waves A and B have formed, and it appears that Wave C has begun to develop.
The correction type is flat .
Wave C is forming as a five -wave impulse.
Key targets:
218 — local correction
200 — the most likely end of the impulse, located in the 50–60% range of the larger Wave 5
189
The potential move from the current level is 15–20%.
We assume that the stock may move lower after the initial targets are reached.
---
Subscribe and leave a comment.
You’ll get new ideas faster than anyone else.
---

FAKEOUT IDEA ON NASDAQWhile the world screams crash, do you not think its the perfect time to load up ?
Nasdaq repeats this pattern
Bullish divergence is present

Nasdaq Centerline Target at 24'220NQ has host everything what is called support.
My target is the 24120 at the Cetnerline.
On a complete flush, further lower targets would be the white Centerline around 23'500.
Time until it hit's the 24220?
I have no cristal bowl. But for each day it takes, I'll move the target even lower, attached to the Centerline.
Since I play this with Options, I don't have a hard Stop/Loss, just risking what my risk-management allowes me in my account.
!! Trade small - It could snap back anytime !!
Stay save
Emilio

Microsoft - Finishing the OwlWe consider the move from April 2025 to July 2025 as a completed five -wave impulse.
From August 2025 to the present, price has been in a corrective phase.
Starting in October 2025, the correction has been developing through zigzag structures.
We expect one more impulse to complete the correction - either as a larger zigzag or a double zigzag. The exact form is not critical for the overall scenario.
Intermediate levels with potential pullbacks:
436 - current level
428
416
Main target:
Move toward the 400 area
Estimated downside potential from current levels:
Approximately 10%
---
Please subscribe and leave a comment!
You’ll get new information faster than anyone else.
---
