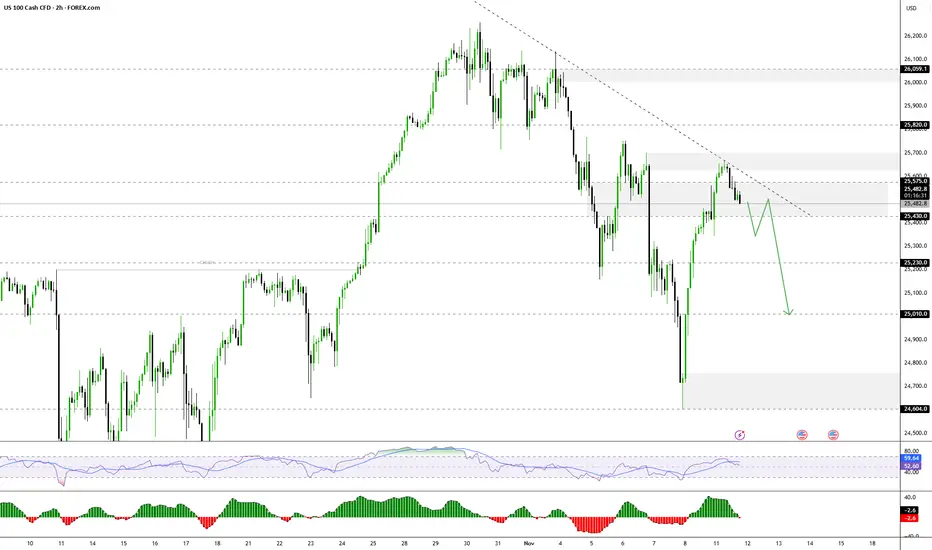
Nasdaq Potential for Further CorrectionThe NASDAQ index currently appears to be in a short-term correction, with the price likely to retest 25430 from 25570 before further movement.
- Above 25430–25575: Bullish continuation towards 25700 → 25820 → 25960.
- Below 25430: Bearish momentum is likely towards 25230 → 25010.
Nasdaq100
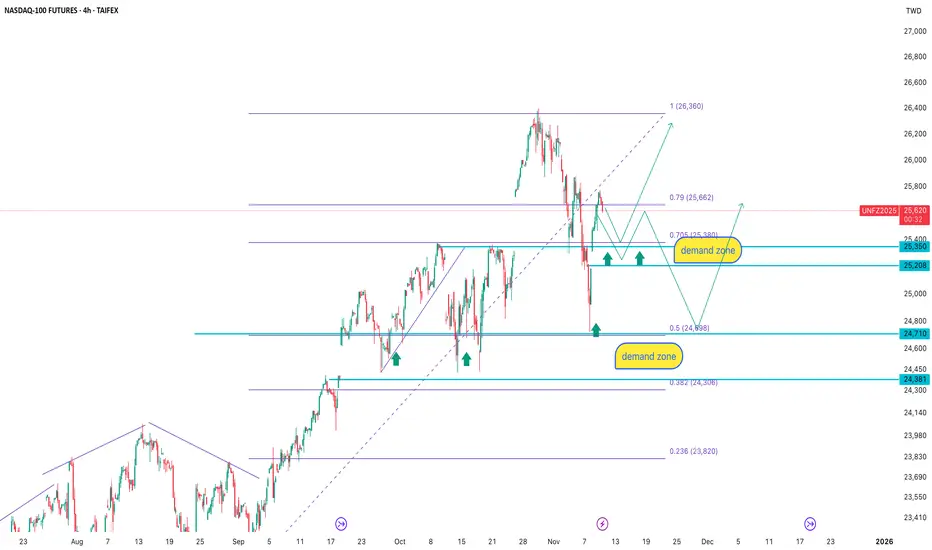
NASDAQ-100 4H: demand is not gone, only waiting for the priceAfter the recent upward impulse, the price retraced into the key demand zone at 25 350–25 208, an area that has repeatedly triggered buying reactions in the past. T
he latest correction pushed the price into the 0.79–0.705 Fibonacci range, which frequently acts as a retest zone before continuation.
Below that lies an even stronger demand zone at 24 710–24 381, aligning with the 0.5 Fibonacci level and previous volume accumulation.
The trading logic here is simple: don’t chase the move, let the price come to demand and wait for confirmation.
As long as the market structure holds, the primary scenario remains bullish from demand zones with a target toward 26 360 and potentially higher.
Fundamentally, NASDAQ remains supported by expectations of softer Fed policy, strong tech capital inflows, and continued investment in AI, cloud, and data-center infrastructure. Smart money accumulates on corrections, not on peaks.
When price falls into demand, it’s not fear — it’s opportunity.
Market Focus on QQQ — Bullish Setup Taking Shape!🎯 QQQ ($INVESCO NASDAQ-100) Bullish Swing Trade Setup
The Layered Entry "Thief" Strategy | Profit Playbook 💰
📈 MARKET OUTLOOK
The QQQ (INVESCO QQQ TRUST) is positioned for a bullish swing trade setup. 🚀 This technical analysis focuses on strategic multi-layer entry execution with defined risk/reward parameters suitable for intermediate swing traders.
🎪 ENTRY STRATEGY: "LAYERED THIEF" METHOD
This isn't your typical entry—we're using smart limit order layering 🎯 to accumulate positions at key support zones. Think of it as a professional scale-in approach!
📍 Limit Order Entry Layers:
Layer 1: $605.00 ⭐
Layer 2: $610.00 ⭐
Layer 3: $615.00 ⭐
Layer 4: $620.00 ⭐
💡 Pro Tip: Feel free to add additional layers ($625, $630, etc.) based on your risk tolerance and account size. The thief's advantage is patience and positioning!
Entry Triggers: Volume confirmation + Support zone bounce + Institutional accumulation signals 📊
🛑 STOP LOSS (Risk Management)
⚠️ THIEF SL: $590.00
📢 DISCLAIMER: This stop loss is a suggestion only. You are responsible for setting your own risk parameters based on your trading capital, risk tolerance, and market conditions. Trade at your own risk! 🎲
🎊 PROFIT TARGETS (Exit Strategy)
PRIMARY TARGET: $650.00 ✅
SECONDARY RESISTANCE: $660.00 ⚠️
Note: The $660 zone presents strong technical resistance combined with overbought conditions and potential reversal traps. We recommend taking profits at $650 and letting a small portion run if momentum confirms. Smart money moves!
📢 DISCLAIMER: Target levels are suggestions based on technical analysis. Your profit-taking strategy should align with your personal risk/reward ratio. Final exit decisions rest with you! 🎯
🔗 CORRELATED PAIRS TO MONITOR
Keep an eye on these related assets for confirmation signals:
🔴 QQQ Constituents & Index Correlation:
NASDAQ:AAPL (Apple Inc.) — Tech sector heavyweight; if AAPL breaks support, QQQ may follow 📱
NASDAQ:MSFT (Microsoft Corp.) — AI & cloud leader; typically leads QQQ moves upward 🤖
NASDAQ:NVDA (NVIDIA Corp.) — Semiconductor bellwether; massive correlation to tech rallies 💻
NASDAQ:TSLA (Tesla Inc.) — Growth driver; watch for momentum continuation signals ⚡
NASDAQ:GOOGL (Alphabet Inc.) — Large-cap tech anchor; supports QQQ uptrend confirmation 🔍
📊 Macro-Level Pairs:
NASDAQ:NDX (NASDAQ-100 Index) — Direct parent index; should mirror QQQ closely 📈
AMEX:SPY (S&P 500 ETF) — Broader market health check; risk-on environment confirmation ⭐
AMEX:IWM (Russell 2000 Small-Cap) — Risk sentiment gauge; divergence = caution ⚠️
TVC:DXY (US Dollar Index) — Inverse correlation; strong dollar = headwind for tech 💵
Key Correlation Points: Watch for tech sector strength continuation and macro risk-on sentiment. If NDX confirms, QQQ breakout is highly probable! 🚀
💡 STRATEGY BREAKDOWN
✅ Bullish Bias with patience-based accumulation
✅ Defined Risk at the $590 level
✅ Layered Entry for optimal position sizing
✅ Technical Confluence at resistance zones
✅ Risk/Reward Potential = Approx 1:2.5 ratio
🎓 TECHNICAL VALIDATION CHECKLIST
✅ Support zone identification at $605-620 range
✅ Volume analysis at entry levels
✅ RSI divergence confirmation
✅ Moving average alignment (200 SMA positioning)
✅ Institutional order flow patterns
✅ Market structure (Higher Highs/Higher Lows)
✨ If you find value in my analysis, a 👍 and 🚀 boost is much appreciated — it helps me share more setups with the community!
#QQQ #SwingTrade #TechETF #NASDAQ100 #TradingStrategy #ThiefStrategy #LayeredEntry #ProfitPlaybook #Bullish #TechnicalAnalysis #ETFTrading #RiskManagement #ActiveTrading

$NVO Short Setup | EMA Wall Stops Bulls, Downside Active🎯 NVO Bearish Breakdown: 200 EMA Rejection Setup 🐻
📊 Asset Overview
Novo Nordisk (NVO) - NYSE
Type: Swing/Day Trade Opportunity
Bias: Bearish Reversal Confirmed ⚠️
🔍 Technical Analysis
The bulls just got rejected harder than a bad pickup line at the 200 EMA! 📉 We're seeing strong bearish momentum building up with heavy downside pressure taking control. The market structure screams reversal, and bears are flexing their dominance.
Key Technical Factors:
🚫 200 Exponential Moving Average acting as dynamic resistance
📉 Bearish momentum accelerating with high selling pressure
🔄 Clear market structure reversal pattern forming
🐻 Bears in full control of price action
💰 Trade Setup - "The Thief Strategy"
🎯 Entry Strategy
Layering Method - Multiple limit orders for optimal positioning:
Layer 1: $53.00
Layer 2: $52.00
Layer 3: $51.00
Feel free to add more layers based on your risk appetite and account size!
🛑 Stop Loss
Thief SL: $56.00
⚠️ Risk Disclaimer: This is MY stop loss level. You're the captain of your own ship - adjust based on your risk tolerance and trading plan. Trade at your own risk!
🎯 Target Zone
Primary Target: $44.00
📍 Why $44? Strong support confluence + oversold conditions + potential bull trap zone. Smart money takes profits where the crowd panics!
⚠️ Profit Taking Note: This is MY target. You make your money, you take your money. Don't be greedy - secure those gains when YOUR plan says so!
🔗 Related Pairs to Watch
Keep your eyes on these correlated assets for confirmation:
📈 Pharma/Healthcare Sector:
NYSE:LLY (Eli Lilly) - Direct competitor in diabetes/obesity space
NASDAQ:SNY (Sanofi) - European pharma correlation
AMEX:XLV (Healthcare ETF) - Sector-wide momentum gauge
💵 Currency Impact:
TVC:DXY (US Dollar Index) - Strong dollar = pressure on international stocks
$EUR/USD - Danish Krone correlation (Denmark-based company)
💊 Related Healthcare Plays:
NYSE:JNJ (Johnson & Johnson) - Large-cap healthcare sentiment
NYSE:PFE (Pfizer) - Big pharma correlation
Watch for divergences or confirmations across these pairs to validate the bearish thesis!
📝 Key Points Summary
✅ 200 EMA rejection = institutional selling zone
✅ Bearish market structure confirmed
✅ Multiple entry layers = better average price
✅ Strong support target at $44 = ideal exit zone
✅ Risk management is KING 👑
⚡ The Thief's Edge
This "layering strategy" lets you build positions gradually while managing risk like a pro. Instead of going all-in at one price, you spread your entries to capture the best average. It's not about timing the perfect entry - it's about stacking the odds in your favor! 🎲
🎭 The Thief Strategy: A playful nickname for layered limit order entries. Trade responsibly and within your means.
✨ If you find value in my analysis, a 👍 and 🚀 boost is much appreciated — it helps me share more setups with the community!
#NVO #NovoNordisk #BearishSetup #SwingTrading #DayTrading #TechnicalAnalysis #StockMarket #NYSE #ThiefStrategy #LayeringStrategy #PharmaStocks #200EMA #BearishReversal #TradingIdeas #PriceAction #RiskManagement #Healthcare #BiopharmaTrade

SOFI Technologies — Strong 200SMA Support Sparks Swing Potential🚀 SOFI TECH STACK: The Fintech Heist - Layer Entry Swing Trade 📊💰
🎯 Executive Summary
Yo traders! 👋 Time to stack those profits like you're robbing Fort Knox! 💎 SoFi Technologies (NASDAQ: SOFI) is flashing a BULLISH CONFIRMATION signal pinned to the 200-day Simple Moving Average (SMA). This setup screams "BUY ME" for savvy swing traders! The fintech giant just crushed Q3 earnings with 36% YoY revenue growth and added 905,000 new members — that's 🔥 momentum, baby!
Current Price: $28.21 | 52-Week High: $32.57 | Market Cap: $34.02B ✅
📍 Technical Setup Breakdown
🎪 Bullish Thesis Confirmed (The Good News)
The 200-period SMA is acting like a SECURITY WALL 🛡️ supporting our bullish narrative. SOFI is respecting this key moving average on the daily chart, signaling institutional accumulation and strong bottom-forming behavior. With strong earnings tailwinds and expanding non-lending revenue (now 56% of total revenue!), this fintech is ready for liftoff! 🚀
💰 Entry Strategy: "Thief Layering" - Multiple Limit Orders 🎲
The "Thief Stacking" approach = Superior Risk Management! Instead of going all-in like a rookie, we deploy capital in tranches:
Recommended Layer Entry Zones:
🥇 Layer 1 (Buy Limit): $27.00 ← First wave of accumulation
🥈 Layer 2 (Buy Limit): $28.00 ← Secondary strength test
🥉 Layer 3 (Buy Limit): $29.00 ← Building momentum zone
💎 Layer 4 (Buy Limit): $30.00 ← Premium breakout entry (ATH proximity awareness!)
Strategy Win: This layering method scales your position while averaging down on dips — mathematically sound, emotionally smart! 📈 You can add/modify additional layers based on your risk tolerance and account size.
🛑 Stop Loss: The "Escape Route" 🏃♂️
Hard Stop Loss @ $25.00 ⚠️
This level represents ~11% downside risk from current levels and sits below major support structures. If SOFI breaks this zone with volume, the thesis is invalidated and we exit to fight another day. Remember: Protecting capital = Being alive to trade tomorrow! 💪
Disclaimer: This is YOUR trade setup. Risk management is personal — adjust your SL based on YOUR position size and account heat.
🎯 Profit Targets: "Police Barricade" Resistance Escape 🚨
Target: $37.00 📍
After crushing earnings, SOFI faces multiple headwinds at higher prices:
🚧 Overbought Confluence Zone: RSI approaching overbought territory + Fib resistance overhead
📊 Technical Resistance: Historical resistance cluster around $35-37 range
⚡ Momentum Trap Warning: Extended moves often reverse at psychological levels
Multi-Profit Take Strategy:
TP1 @ $32.50: Take 30% profits — Lock in the W! 🔐
TP2 @ $35.00: Take another 40% — Secure the bag! 💵
TP3 @ $37.00: Trail 30% with breakeven stop — Let winners run! 🎯
Pro Tip: Don't get greedy! The "Police Barricade" awaits those who overstay their welcome!
🌐 Correlated Pairs to Monitor (Market Context)
Keep your eyes on these relationships — they'll tell you if SOFI is moving on individual strength or sector momentum:
🔸 NASDAQ:UPST (Upstart Holdings) — 📈 Fintech peer correlate. Broader lending sector strength signals = SOFI momentum tailwind!
🔸 NASDAQ:COIN (Coinbase) — 🏦 Digital finance ecosystem player. Tech-forward consumer adoption trends directly impact fintech adoption rates.
🔸 SET:SQ (Block Inc) — 💳 Payments ecosystem leader. Fintech ecosystem health barometer — if SQ is strong, SOFI rides the wave!
🔸 NASDAQ:QQQ (Nasdaq-100) — 🔗 Tech sector correlate. Market risk appetite indicator — if QQQ tanks, watch for tech sector contagion signals!
🔸 NASDAQ:TLT (20+ Treasury ETF) — 🔀 Inverse relationship alert. If rates rise (TLT falls), fintech lending margins expand = bullish for SOFI profits! 📈 If rates fall hard, margin compression = caution flag! 🚨
Key Correlation Insight: Monitor these pairs in real-time during SOFI entry execution — they'll tell you if this is individual strength or sector-wide momentum! 🎯
📋 Trading Rules (Thief Code of Conduct) 🎭
✅ Entry ONLY when price touches your pre-set buy limit zones
✅ Size DOWN if fundamentals deteriorate (earnings miss, regulatory headwinds)
✅ Move stops to breakeven once TP1 is hit — Never give back free money!
✅ Take profits AT resistance — Fighting the market = broke traders
✅ Walk away if SOFI closes below $25.00 — Live to trade another day!
🔥 Why This Setup SLAPS Right Now 📱
✨ Q3 Earnings Crush: 36% revenue growth + profitability milestone achieved
🏦 Fintech Secular Trend: Younger generations ditching traditional banks for digital solutions
📈 Non-Lending Growth: 57% YoY expansion in SoFi Money, Invest, and Credit Card products
💰 Analyst Optimism: 6 of 11 analysts recommend BUY | Target range: $12-$38
🎯 Technical + Fundamental Alignment: The chart AND the fundamentals say "BUY ME"
✨ Gratitude Note
✨ If you find value in my analysis, a 👍 and 🚀 boost is much appreciated — it helps me share more setups with the community!
#SOFI #SoFiTechnologies #SwingTrade #Fintech #TradingSetup #NASDAQ #BullishSetup #TechnicalAnalysis #Daytrader #TradingIdeas #StockMarket #Crypto #FinanceGains #TradingCommunity #Bullish #EntryStrategy #RiskManagement #TP1 #SL #TradingWithBias

Nasdaq 100 Rebounds as Traders Anticipate End of the US ShutdownNasdaq 100 Rebounds as Traders Anticipate End of the US Shutdown
As the chart shows, the Nasdaq 100 index has started the week on a positive note amid growing expectations that the longest government shutdown in US history may soon come to an end.
According to Reuters, a bill has been introduced in the Senate proposing amendments to extend government funding until 30 January. The news acted as a bullish catalyst for equity markets. Still, the question remains – is the risk truly behind us?
Technical Analysis of the Nasdaq 100
Analysing the hourly chart of the Nasdaq 100 on 4 November, we:
→ Drew an ascending channel;
→ Noted signs of momentum exhaustion, as mentioned in our previous headline.
Since then, price action has evolved as follows:
→ The lower boundary of the channel provided support (1), prompting a brief rebound;
→ The 25,770 level acted as resistance (2) on two occasions, strengthening the bears’ confidence to push for a downside breakout — which ultimately succeeded.
The index’s subsequent movements have now more clearly outlined the formation of a descending channel (shown in red).
From the demand-side perspective:
→ After a false bearish breakout below 24,680 (showing characteristics of a Liquidity Grab pattern), the market staged an aggressive rally from point B;
→ Today’s session opened with a bullish gap, and the price has moved above the red median line.
From the supply-side perspective:
→ The 25,500 level, where sellers gained control during the previous channel breakout, may now act as resistance;
→ If the A→B move is viewed as an impulse, today’s rally appears to be a corrective rebound consistent with Fibonacci proportions — suggesting that downward momentum could resume within the red channel.
This article represents the opinion of the Companies operating under the FXOpen brand only. It is not to be construed as an offer, solicitation, or recommendation with respect to products and services provided by the Companies operating under the FXOpen brand, nor is it to be considered financial advice.

META Pullback or Power Move? Technical Structure Decides🎯 META PLATFORMS INC. (NASDAQ) | THE THIEF'S PROFIT PLAYBOOK 💰
Bullish Swing Trade Setup | Supertrend + Triangular Moving Average Pullback
📊 SETUP OVERVIEW
This analysis presents a disciplined swing trading strategy on META (NASDAQ: Meta Platforms Inc.) leveraging proven technical indicators combined with strategic entry layering methodology.
Current Market Context: 🔍
Current Price: ~$625.24 (as of Nov 9, 2025)
RSI Status: Oversold Territory (<30) ⚠️
52-Week High: $796.25 | 52-Week Low: $479.80
Analyst Target: $824.02 (+32.54% potential upside) 📈
Sentiment: 44 Analysts = "Strong Buy" Rating ✅
🎬 ENTRY STRATEGY: THE LAYERING APPROACH
Rather than risking a single entry, this "Thief" methodology utilizes multiple limit order layers for optimal risk-adjusted position building:
Primary Entry Layers (Building Position Gradually):
Layer 1️⃣: $590 | Entry volume allocation: 25%
Layer 2️⃣: $600 | Entry volume allocation: 25%
Layer 3️⃣: $620 | Entry volume allocation: 25%
Layer 4️⃣: $630 | Entry volume allocation: 15%
Layer 5️⃣: $640 | Entry volume allocation: 10%
💡 Strategy Rationale: Layering captures value through market dips while maintaining capital preservation. Adjust layer counts/prices based on your risk tolerance and account size.
🛑 RISK MANAGEMENT
Stop Loss Level: $560 🛑
Represents approximately -10.4% from current price
Protects against breakdown of support structure
Triggered if key technical support fails
⚡ IMPORTANT DISCLAIMER: Stop loss placement is a personal decision based on your risk appetite. The 560 level is suggested only—manage YOUR risk YOUR way.
🎁 PROFIT TARGET
Primary Target: $730 🚀
Represents +16.8% upside potential from current levels
Aligns with resistance confluence + technical overbought signals
Incorporates trap avoidance in highly contested resistance zones
🎯 Exit Strategy Note: Take profits strategically as price approaches target. Don't get greedy—serious resistance + market structure at these levels. The $730 zone is crowded; exit positions intelligently.
⚡ DISCLAIMER: Target selection is your own. Book profits when comfortable—risk management requires personal decision-making, not blind following.
🔗 RELATED PAIRS TO WATCH (TECH SECTOR CORRELATION)
Monitor these correlated assets for confirmation signals:
📱 NASDAQ:GOOGL (Alphabet Inc.) - Tech sector bellwether; typically leads META moves in AI narrative
Correlation: Strong positive | If GOOGL struggles, META upside may be capped
Watch: Positive correlation breakouts suggest sector momentum
💻 NASDAQ:NVDA (NVIDIA Corp.) - AI chip leader; META's infrastructure partner
Correlation: Strong positive | NVDA strength = confidence in AI capex spending
Watch: NVDA drops could signal META weakness despite fundamentals
🤖 NASDAQ:MSFT (Microsoft Corp.) - Competing AI ecosystem player
Correlation: Moderate positive | Sector rotation indicator
Watch: MSFT outperformance = potential META underperformance
📊 NASDAQ:QQQ (Nasdaq-100 ETF) - Tech sector aggregate
Correlation: Very strong | META weighted ~4.7% in QQQ
Watch: If QQQ breaks down, META faces headwinds regardless of company-specific factors
🌐 NASDAQ:SMH (Semiconductors ETF) - Supply chain health indicator
Correlation: Moderate positive | AI infrastructure demand gauge
Watch: SMH weakness signals potential capex disappointment
📈 TECHNICAL ANALYSIS FRAMEWORK
✅ Supertrend Confirmation: Bullish alignment detected—uptrend structure intact
✅ Triangular Moving Average (TMA) Pullback: Price respecting key moving average zones, setting up continuation
✅ Oversold RSI: Current market conditions suggest reversal potential
✅ Support Structure: $560 level acts as psychological + technical floor
🎓 WHY THIS SETUP WORKS
Entry Discipline: Layering reduces emotional decision-making; mechanical execution improves psychology
Risk Control: Multiple entries allow tighter overall stop losses while maintaining position exposure
Technical Confirmation: Supertrend + TMA alignment = higher probability setups
Sector Tailwinds: META's $600B AI investment announcement provides fundamental support
Oversold Bounce Potential: RSI <30 historically precedes relief rallies in strong companies
⚠️ RISK FACTORS & CONSIDERATIONS
🔴 Key Risks:
Meta's aggressive capex spending concerns some investors—watch for guidance revisions
Regulatory pressure on AI/advertising practices could derail momentum
Macro headwinds (interest rates, economic data) always threaten growth narratives
Market structure at $730 is HEAVY—resistance may be tougher than expected
Position sizing matters: don't over-leverage this trade
💼 Trade Management Checkpoints:
Scale in via layering rather than going all-in
Monitor daily closes near stop loss; don't let winners turn into losers
Consider taking partial profits as price approaches resistance zones
Watch related pairs ( NASDAQ:QQQ , NASDAQ:NVDA ) for confirmation/divergence
💡 PRO TIPS FOR THIEF TRADERS
🔓 Lock in Partial Gains: At $670 level, consider closing 40% of position to secure profits
🔓 Trail Your Stop: Once price establishes above $650, move stop to breakeven to protect capital
🔓 Watch Earnings Calendar: Next catalyst could accelerate move—prepare position accordingly
🔓 Timeframe Matters: This is swing trade—target 2-4 week holding period
🔓 Keep Thesis Tight: Market conditions change—be prepared to exit if setup breaks
📌 FINAL NOTES
This analysis is provided for educational & entertainment purposes only. ✨
Every trader must make independent decisions regarding position sizing, entry levels, exit targets, and risk management. What works for one trader's account may not work for another. Test strategies on smaller positions first; respect your stops; manage your risk.
Remember: The best trade isn't always the one that makes the most money—it's the one that lets you live to trade another day.
📢 SUPPORT THE ANALYSIS
✨ If you find value in this analysis, a 👍 and 🚀 boost is much appreciated — it helps me share more setups with the community!

Nasdaq - The most important structure!💰Nasdaq ( TVC:NDQ ) perfectly respects structure:
🔎Analysis summary:
Over the course of the past couple of months, the Nasdaq has been rallying an expected +50%. Still, until the Nasdaq will retest the upper channel resistance trendline, this rally won't be over. Therefore, we can still see a rally of another +10% in the very near future.
📝Levels to watch:
$25,000 and $30,000
SwingTraderPhil
SwingTrading.Simplified. | Investing.Simplified. | #LONGTERMVISION

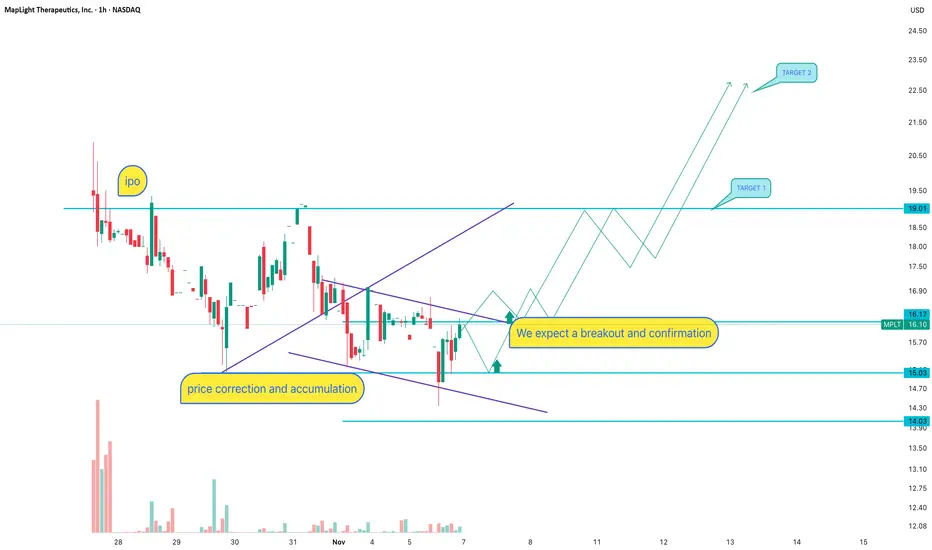
MPLT: Is the IPO working according to a scenarioAfter the IPO, the stock is forming a falling wedge — a classic post-listing accumulation pattern. Price is consolidating between the 15.03 support level and the accumulation zone. We see a trendline breakout attempt and price trying to hold above. The key resistance is 19.01, aligning with the previous consolidation range. Lowering volume indicates seller exhaustion. Scenario: breakout above 16.20 and confirmation gives a path toward target 1 at 19.01, with a potential impulse toward 22.50 (target 2). Entry only after breakout + retest. Without a retest, the risk of a fake breakout increases.
MPLT is a biotech company newly listed on NASDAQ. Post-IPO stocks often go through correction and accumulation while the market defines fair value. FDA updates or clinical trial results can act as catalysts — biotech names tend to move aggressively on news. If institutional interest increases, the trend may accelerate quickly.
If the breakout confirms — the rocket won’t wait for you to fasten your seatbelt. Let price show direction instead of forcing an entry inside noise.
US100 Will Hit Resistance Soon!
HI,Traders !
#US100 keeps growing
And the price will soon
Hit a horizontal resistance
Of 25817.8 from where
A local bearish correction
Is to be expected !
Comment and subscribe to help us grow !

Nasdaq Fails to Return to Record HighsOver the past six trading sessions, the Nasdaq index has begun to show a notable bearish correction of more than 2.6% in the short term, reinforcing a downward bias that remains active at this stage. So far, the selling pressure has persisted as the market grows increasingly concerned about the performance of several companies linked to artificial intelligence, which have maintained significant valuations without yet reporting profits strong enough to justify those price levels. This situation has started to raise warning signals and trigger a short-term decline in confidence, which, if sustained, could become a key driver of stronger selling pressure in Nasdaq movements over the coming sessions.
Uptrend Still Holding
Despite recent corrections, the Nasdaq index has managed to preserve a steady upward trendline since around April 14 of this year, and so far, there has not been a strong enough sell-off to cause a meaningful break of this trend in the short term. However, if the current selling pressure continues, it could increase the risk of weakening the buying trendline, which has recently entered a phase of consolidation or pause over the past few sessions.
RSI
The RSI indicator line remains oscillating close to the 50 level, suggesting a technical balance between buying and selling strength over the average impulses of the last 14 trading sessions. As long as this behavior persists, the market may enter a more pronounced phase of indecision in the short term, reflecting the absence of a clear directional bias in price movements.
MACD
The MACD indicator, meanwhile, has started to show a neutral pattern, as its histogram continues to approach the zero line. This indicates indecision in the strength of short-term moving averages and could be signaling the formation of a more significant technical neutrality, where the market seeks an equilibrium point before defining a new directional move.
Key Levels to Watch:
26,000 points – Main resistance: Corresponds to the recent record highs and stands as the most important bullish barrier to watch. Movements that manage to hold above this level could confirm a stronger buying bias, potentially allowing the uptrend to continue on the chart.
25,115 points – Near support: This zone coincides with the most recent price retracements and could act as a technical barrier against potential short-term downward corrections.
23,800 points – Critical support: This level corresponds to the 23.6% Fibonacci retracement on the chart. Bearish movements that reach and break below this area could put the current trendline at risk and generate a stronger selling bias in the short term.
Written by Julian Pineda, CFA – Market Analyst

Nasdaq NAS100 Bulls Regain Control: What I’m Watching Next📈 On the 4-hour NASDAQ chart, we can clearly see a break in structure to the upside, signaling strong bullish momentum entering the market. 🟩 The buyers are showing strength, and I’ll be looking to capitalize on this momentum — but only if we see a confirmed break of the current swing high, followed by a retracement into the retest zone. 🔁
However, patience is key. ⏳ I’ll only look to engage if today’s New York session data release aligns with and supports the bullish bias. Fundamentals and technicals must work together before I take a position.
As mentioned in the video, if the anticipated price action fails to materialize, we’ll simply abandon this setup and move on — staying disciplined is crucial. 🚫
⚠️ Disclaimer: This analysis is for educational purposes only and not financial advice.

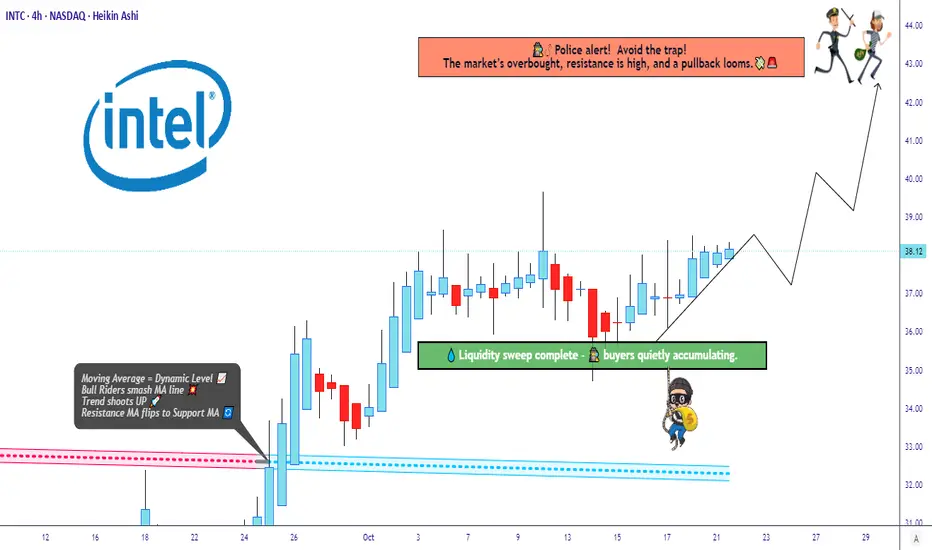
“Intel’s Bullish Structure Building Power for a Breakout Move!”🔥 INTC “Intel Corporation” – The Thief’s Profit Playbook 🕶️💰 (Swing/Day Trade Setup)
⚔️ Plan Overview – Bullish Setup with Thief Precision
The Thief Strategy is in play here — a smart layering entry method designed to steal optimal positions from impatient traders. 🕵️♂️
Our mission: Load, Layer, Loot, and Leave with Profits.
🎯 Entry Plan (Layering Method)
We’re layering multiple buy limits (thief-style) to catch value dips:
Buy Limit Layers: 35.00 💵 → 36.00 💵 → 37.00 💵
(⚙️ You can expand your layers based on your risk tolerance and style — thieves adapt fast.)
💡 Why Layer? Because a pro thief never rushes a vault — we break in step-by-step. This builds position strength while keeping entry efficiency.
🛡️ Stop Loss (Thief’s Escape Hatch)
📉 Stop Loss @34.00
💬 “Dear Ladies & Gentlemen (Thief OG’s) — I’m not recommending you set my SL. You’re the boss of your vault. Manage your own risk, grab the bag, and disappear in profits like a shadow.” 🌑💼
🚀 Target Zone (Profit Extraction Level)
🎯 Main Target: @43.00
📛 Police Barricade @44.00 — strong resistance zone + overbought region + potential bull trap.
🧠 Play it smart — escape clean with gains at 43.00 before the blue lights flash. 🚨
💬 “Dear Ladies & Gentlemen (Thief OG’s) — not recommending you follow my TP blindly. Make your own move, take your profit, and vanish like a ghost.” 👻💸
🧩 Technical Breakdown
Intel (INTC) forming a strong base accumulation near the $35–37 range.
Volume Profile shows liquidity pockets aligning with the layering zones.
RSI hovering mid-levels → room for upside before overbought conditions hit near $43–44.
EMA Confluence: Price reclaiming short-term EMA — early trend reversal signals in motion.
Fundamental Boost: Intel’s AI chip roadmap and cost-optimization headlines add bullish narrative momentum. ⚙️📈
🌍 Related Pairs to Watch (Correlation & Market Sync)
💠 NASDAQ:NVDA – Leader in AI semis; momentum correlation ~0.78 with INTC.
💠 NASDAQ:AMD – Similar sector swing potential; can mirror INTC lag-moves.
💠 NASDAQ:SMH (VanEck Semiconductor ETF) – Sector strength indicator. A breakout above resistance supports INTC’s upside.
💠 NASDAQ:QQQ / NASDAQ:NDX – Tech-heavy indices; bullish bias strengthens chip sector sentiment.
🧭 Correlation Tip: If NVDA or QQQ rallies strongly while INTC consolidates — that’s your thief’s golden signal to layer your entries quietly before the breakout sparks. ⚡
⚙️ Risk Management Wisdom
Never go all-in; layer your risk like a pro.
Keep your SL tight but mind flexible.
Respect zones — police don’t like thieves hanging around too long. 😎
✨ “If you find value in my analysis, a 👍 and 🚀 boost is much appreciated — it helps me share more setups with the community!”
📜 Disclaimer: This is a Thief-Style Trading Strategy shared for educational & fun purposes only. Not financial advice. Trade wisely — stay stealthy. 🕶️
#INTC #Intel #StockMarket #SwingTrade #DayTrading #ThiefStrategy #LayeredEntries #TechnicalAnalysis #NASDAQ #StocksToWatch #AIStocks #TradingViewCommunity #TradingViewEditorsPick #Semiconductors #NVDA #AMD #QQQ #ProfitPlaybook
SMH ETF Power Move Incoming – ATR Confirms Bullish Momentum!🎯 SMH Semiconductor Heist: Bulls Loading Up! 💎🚀
📊 Asset Analysis
VanEck Semiconductor ETF (SMH) - The chip sector's flagship ETF is showing serious strength after bouncing off the ATR (Average True Range) support zone. Bulls are flexing their muscles, and momentum is building for an upside breakout. Time to plan your entry like a pro! 🧠💰
🔥 Trade Setup: The "Layered Thief" Entry Strategy
Bias: BULLISH 🐂
Strategy: Multi-layered limit order entries (maximize your position while managing risk)
🎯 Entry Zones (Layer Your Orders):
Deploy multiple buy limit orders across these price levels to build your position strategically:
Layer 1: $328
Layer 2: $332
Layer 3: $336
Layer 4: $340
Note: You can add more layers based on your capital allocation and risk tolerance. The goal is to average into the position as price consolidates before the breakout.
🛑 Risk Management
Stop Loss: $324
This level invalidates the bullish setup if breached. The ATR support zone should hold — if it doesn't, we're outta here!
⚠️ Risk Disclosure: This stop loss level is based on my analysis. However, YOU are the captain of your own ship! Adjust your risk parameters according to your account size and risk appetite. Trade smart, not reckless! 🧠
🎯 Target Zones
Primary Target: $364 (Take Profits Here!) 💰
Maximum Target: $368 (Resistance Zone/Overbought Alert) ⚠️
At $368, we're approaching a major resistance level where profit-taking, overbought conditions, and potential bull traps converge. It's the "police barricade" 🚨 — smart thieves know when to escape with the loot! Secure your gains before hitting this ceiling.
⚠️ Profit-Taking Disclosure: These are MY target levels based on technical analysis. Your profit targets should align with YOUR trading plan and risk-reward preferences. Take money when YOU feel comfortable — it's your capital, your rules! 💼
🔗 Correlated Assets to Watch
Keep an eye on these related tickers for confirmation and broader market context:
NASDAQ:SOXX - iShares Semiconductor ETF (direct sector peer)
NASDAQ:NVDA - NVIDIA (semiconductor heavyweight, major SMH component)
NASDAQ:AMD - Advanced Micro Devices (chip sector bellwether)
NYSE:TSM - Taiwan Semiconductor (global chip manufacturing leader)
NASDAQ:AVGO - Broadcom (diversified semiconductor play)
NASDAQ:QQQM / QQQ - Nasdaq 100 ETFs (tech sector correlation)
📈 Why it matters: SMH trades in sync with these assets. If they're showing strength, it confirms the bullish thesis. If they're weak, proceed with extra caution!
📈 Technical Confluence
✅ ATR support zone holding strong
✅ Bulls regaining control after retracement
✅ Volume accumulation at support levels
✅ Risk-reward ratio favors the bulls (SL: $324 → Target: $364 = solid R:R)
The technical stars are aligning for a bullish continuation move! 🌟
🎓 Trading Wisdom
This setup combines patience (layered entries), discipline (defined stop loss), and realistic expectations (conservative profit targets). The semiconductor sector is volatile but rewarding when you trade with a plan! 💼📊
✨ If you find value in my analysis, a 👍 and 🚀 boost is much appreciated — it helps me share more setups with the community!
⚠️ Disclaimer
This analysis represents the "Thief Style Trading Strategy" — a playful approach to technical analysis meant for educational and entertainment purposes only. This is NOT financial advice. Trading involves substantial risk of loss. Always conduct your own research, manage your risk appropriately, and never trade with money you can't afford to lose. Past performance does not guarantee future results. Trade at your own risk! 🎲
#SMH #Semiconductors #SwingTrading #DayTrading #TechnicalAnalysis #NVDA #AMD #ChipStocks #TradingSetup #StockMarket #BullishSetup #LayeredEntry #RiskManagement #TradingStrategy #VanEckETF #TechStocks #MarketAnalysis #TradingIdeas #PriceAction

NAS100 Forecast: A Fresh Bullish Impulse Toward New HighsThe NAS100 index is currently moving within a classic Elliott Wave structure. After completing wave (3), the market entered a correction phase that formed wave (4). This correction appears to have ended in the highlighted support zone, where buyers stepped in strongly. The five-wave pattern before wave (4) confirms a solid bullish trend. Now, the index seems to be preparing for the final upward move wave (5). This wave often represents the last push of a rally before a larger correction starts. As long as the price stays above the recent support near 24,400 , the next targets could be seen around 25,200–25,600 . In simple terms, the market is expected to continue its uptrend after a short pullback, following the typical Elliott Wave sequence of five upward waves and three corrective ones.

NAS100 | Bearish Momentum Extends The Nasdaq 100 fell about 2.1% (~500 points) as projected, maintaining a bearish outlook while technology stocks continued to weigh on market sentiment.
Below 25,700: Bearish continuation towards 25,340 → 25,230 → 25,000.
Above 25,700: Short-term recovery towards 25,820 → 26,170.

Nasdaq 100 Analysis: Early November Movements Raise ConcernsNasdaq 100 Analysis: Early November Movements Raise Concerns
As the chart shows, the Nasdaq 100 index gained around 6% in October, supported by several key factors:
→ The meeting between US President Donald Trump and Chinese leader Xi Jinping, which helped ease tensions in trade relations between the world’s two largest economies.
→ A 0.25% rate cut by the Federal Reserve.
→ Positive earnings from major tech companies, including a strong report from Alphabet (GOOGL).
However, the market’s behaviour in early November is cause for concern — on the morning of 4 November, the stock index fell to its lowest level in a week. Bearish sentiment is being fuelled by:
→ uncertainty over the timing of the end of the government shutdown;
→ a weaker-than-expected ISM Manufacturing PMI report, which may reflect the impact of Trump’s tariffs on US industry.
Technical Analysis of the Nasdaq 100 Chart
Analysing the hourly chart of the Nasdaq 100 on 30 October, we:
→ confirmed the relevance of the upward channel (shown in blue), noting that the upper boundary was showing signs of resistance;
→ drew a steeper trajectory consisting of three orange lines;
→ suggested a profit-taking scenario, in which bears would attempt to push the Nasdaq 100 index down towards the median line of the blue channel.
This scenario has since materialised, as:
→ the median line has repeatedly acted as support (highlighted in blue);
→ the breakout level of the orange lines at 26,120 has turned into a resistance zone.
At present, the Nasdaq 100 index is trading in the lower half of the channel, indicating that the bullish momentum from late October has faded. Bulls might find support near the gap area, reinforced by the lower boundary of the blue channel.
This article represents the opinion of the Companies operating under the FXOpen brand only. It is not to be construed as an offer, solicitation, or recommendation with respect to products and services provided by the Companies operating under the FXOpen brand, nor is it to be considered financial advice.

How to Trade NASDAQ NAS100 Retracements Into An Imbalance🚀 NASDAQ NAS100 Analysis – Watching for a Bullish Opportunity 📈
I'm currently focused on the Nasdaq NAS100. On the weekly timeframe, it remains in a strong bullish trend 💹. Recently, however, we've seen a sharp and aggressive retracement. Given that the market was overextended, this pullback is healthy and expected, as price seeks to tap liquidity pools and rebalance ⚖️.
Zooming into the 4-hour timeframe, we can clearly identify a bullish imbalance 🔹. This area serves as my key point of interest for a potential move lower. The ideal scenario is for price to hold above the imbalance low and then break structure bullishly 🔼.
Key conditions for a high-probability long trade:
Price must not break below the imbalance low 🚫⬇️
Price must establish higher highs and higher lows to confirm bullish momentum 🔝
If these conditions align, I will be looking for a long entry opportunity. ⚠️ Not financial advice – this is purely market analysis for educational purposes.

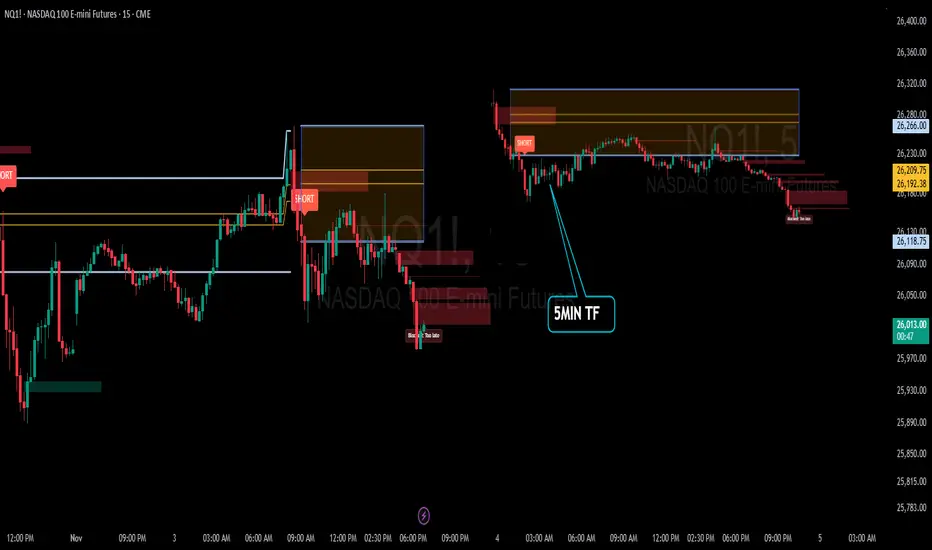
Recap: ORB Pro in Action | “Discipline > Direction”Date: November 3rd 2025
Ticker: QQQ / NQ1! (5-min TF)
Strategy: ORB Pro + Golden Pocket Retest + Volume Filter
Focus: Trend confirmation & controlled execution
🧭 Market Context
The morning opened sideways inside the ORB range — no clean conviction early on.
Around mid-morning, sellers gained control as lower highs formed beneath the EMA band and the Golden Pocket retest (0.5/0.618) failed with volume confirmation.
That break produced the clean short setup of the day, perfectly aligned with the higher-timeframe (HTF) downtrend.
🧠 Trade Review
Early Entries: Entered pre-confirmation and took initial heat.
Mid-Morning Setup: All filters aligned — EMA, volume, HTF direction. This was the textbook short that delivered follow-through.
Late Session Attempts: Momentum faded after lunch, with signals correctly blocked as “Too Late.”
Result: Several small wins offset by early losses, closing the day + $7.34 realized P/L after fees.
📊 Performance Snapshot
Metric Value
Win Rate ≈ 42 %
Best Trade + $287.94
Largest Loss – $189.05
Net Result + $7.34 (Realized)
Setup Accuracy High — execution mixed
📈 Chart Breakdown
The 5-minute chart highlighted a short trigger around 26 260 – 26 280, with smooth continuation into ORB extensions.
The ORB Pro filter marked “Blocked / Too Late” after the move — confirming that the system logic protected capital from late chases.
💡 Key Takeaways
Patience > Prediction — early entries rarely pay off.
Protect Green — partial profit lock once 1 R:R is reached.
System Strength — ORB Pro continues to validate structure when filters align.
🧘♂️ Reflection
“The system nailed the move — I jumped early. Still finished green, proving that execution discipline is the real edge. Tomorrow’s goal: one clean setup, one confident hold, and protect the profit.”
🧩 Next Steps
✅ Wait for full confirmation before entry
✅ Hold until 1:2 R:R min
✅ Avoid re-entries once HTF zone is tapped
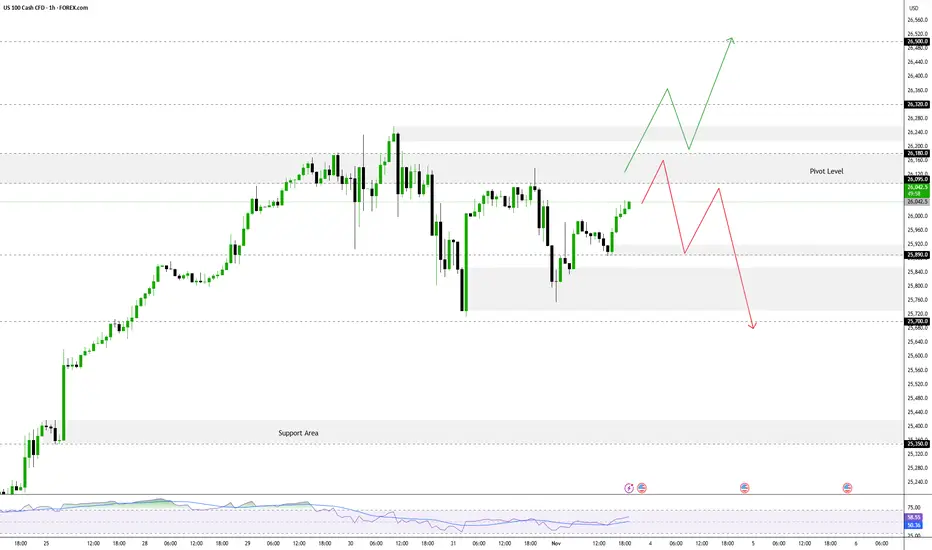
NASDAQ Testing Pivot Zone, Awaiting Breakout The FOREXCOM:NAS100 is currently testing a key zone called the Pivot Zone (a direction-determining area). The short-term trend will be determined by whether the price manages to stay below or break above this zone.
Pivot Zone: 26,095 – 26,180
As long as the price trades below this zone, short-term momentum remains bearish (tending to fall).
➡️ Bearish Scenario
If the price remains below 26,180, the negative bias will continue, with the following main targets:
- Target 1: 25,890
- Target 2: 25,700
- Target 3: 25,340
⬆️ Bullish Scenario
If a breakout and confirmation occurs above 26,180, this could signal the start of a new bullish trend, with the following targets:
- Target 1: 26,500
- Target 2: 26,850
USNAS100 remains bearish below 26,180, but a confirmed break above this level could signal the start of a new bullish leg.
NASDAQ100 HIGH PROBABILITY SETUP SOON!!!🚨 NAS100 HIGH PROBABILITY SELL/BUY SETUP 🚨
* Here We Can See Clearly The Next Potential Moves For US100 Coming Hours/Days.
* Keep Your Eyes Close On Your Trading Positions.
* Happy PIP Hunting Traders.
FXKILLA.

NASDAQ 100 (NQ1!): Bullish! Buy This Dip!Welcome back to the Weekly Forex Forecast for the week of Nov. 3 - 7th.
In this video, we will analyze the following FX market: NASDAQ (NQ1!) NAS100
The NASDAQ reached all time highs last week, then started a pullback, landing in a +FVG.
As the +FVG continues to hold, look for valid buy setups to form.
Sells are not valid, my friends. Go with the trend!
Enjoy!
May profits be upon you.
Leave any questions or comments in the comment section.
I appreciate any feedback from my viewers!
Like and/or subscribe if you want more accurate analysis.
Thank you so much!
Disclaimer:
I do not provide personal investment advice and I am not a qualified licensed investment advisor.
All information found here, including any ideas, opinions, views, predictions, forecasts, commentaries, suggestions, expressed or implied herein, are for informational, entertainment or educational purposes only and should not be construed as personal investment advice. While the information provided is believed to be accurate, it may include errors or inaccuracies.
I will not and cannot be held liable for any actions you take as a result of anything you read here.
Conduct your own due diligence, or consult a licensed financial advisor or broker before making any and all investment decisions. Any investments, trades, speculations, or decisions made on the basis of any information found on this channel, expressed or implied herein, are committed at your own risk, financial or otherwise.

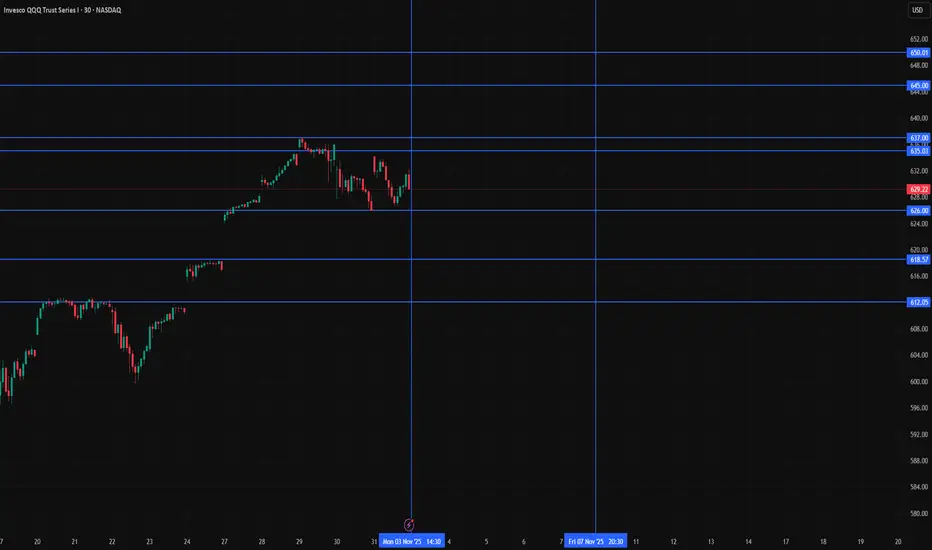
QQQ Weekly Map 3–7 Nov 2025Context
QQQ finished the week near the highs after a steady October climb. Buyers keep absorbing every shallow pullback. This week sits on two hinges. First, jobs and services data that nudge yields and implied vol. Second, a small cluster of tech earnings that can rotate leadership inside semis and handsets. The plan is simple. Let the market prove strength above the record band or let it pull back into patient demand. You will trade the reaction, not the forecast.
Chart setup
Use a one hour chart. Add 20 and 50 EMAs, a daily VWAP with bands, and the previous week high and low. Keep plots at global scope and turn lookahead off. Display VIX on a small separate pane for bias only.
Levels that matter
• 637.01 is the record high and the top of the current band
• 635 to 637 is the breakout ridge where wicks happen first and real holds happen later
• 629 is the Friday close reference for gap work on Monday
• 626 is last week’s first shelf where buyers defended cleanly
• 620 is a round shelf with memory from October
• 612 is the mean reversion area that often aligns with short term moving averages
• 597 is the bigger trend check where the intermediate crew steps in
How to read the week
Imagine a door at 637. When price opens that door and stays inside the new room for a while, trend traders have permission. If price knocks and gets rejected, range traders take the other side. If price steps down into 620 to 612 while volatility stays tame, that is where you seek bounces with tight risk. Your confirms are simple. VIX under the upper teens is friendly. Yields not jumping is friendly. If either flips, you slow down.
Three rules only
• Rule 1. Momentum only above the ridge. If cash breaks and holds above 637 for at least thirty minutes, take a starter. First target 645, stretch 650. Invalidate on a clean loss and thirty minute close back inside 635.
• Rule 2. Buy the dip into 620 to 612 only if volatility stays calm. Enter in the 620 to 612 pocket when VIX stays below your upper guardrail. Manage a first target 620 to 626 and trail. Invalidate on a decisive thirty minute close under 609 to 610.
• Rule 3. Risk first below 597. If the week forces a daily close below 597, treat it as a trend health check. Reduce gross and net and wait for a reclaim before trying to be a hero.
Why this works
One instrument. One band at the highs. One pocket for mean reversion. You are not predicting the data. You are pricing the reaction at the lines the market already respects. Breakout failures happen and that is fine because your hold filter removes most traps. Dips fail too and that is fine because your volatility guardrail removes the worst ones.
Intraday guide
• Morning plan. If we gap up into the ridge, let the first thrust exhaust and demand the hold. If we gap down toward 626, let the opening range print and only act after the first pullback.
• Midday plan. If price is inside 629 to 635 around lunch, expect chop. Trades there are optional.
• Afternoon plan. If the day is trending, trail behind a five minute reclaim of your entry line.
Risk and heat
Set maximum portfolio heat per idea at one half of one percent. Scale entries in thirds. Respect your stop even when it feels unfair. A string of small scratches is the tuition for the one clean runner that pays for the week.
Earnings and calendar awareness
AMD and Qualcomm after the close on Tuesday and Wednesday can swing semis and handsets. Shopify and Airbnb bookend consumer tone. The first week of the month carries ADP, services PMIs, ISM services, and payrolls. Do not guess the print. Trade the reaction at the levels on your chart. If VIX jumps before data, size down and wait for the dust to settle.
Cross checks
• If the ten year sits near recent levels or drifts lower, multiples breathe and the 637 break has better odds
• If VIX pins below the upper teens, dips are easier to buy
• If one of these flips, you slow down and treat the day like a range
Reminder
Education and analytics only. No advice. No guarantees. Process beats prediction.