Nasdaq - Clearly heading to $30.000!🎉Nasdaq ( TVC:NDQ ) points much higher:
🔎Analysis summary:
Yes, we witnessed a short term correction over the past couple of days. But no, this does not mean that the bullrun is now entirely over. In fact, looking at the longer term rising channel pattern, the Nasdaq can still rally higher until it will retest the upper trendline.
📝Levels to watch:
$25.000, $30.000
SwingTraderPhil
SwingTrading.Simplified. | Investing.Simplified. | #LONGTERMVISION
Ndx!

NASDAQ Did the 1D MA50 just save the day??Nasdaq (NDX) suffered a historically strong daily sell-off on Friday following President Trump's tariff threats and touched (and closed on) its 1D MA50 (blue trend-line).
Last time it hit that trend-line was on September 02 and that was a technical Higher Low on the 5-month Channel Up. Friday's Low was also very close to the bottom of this pattern. At the same time the 1D RSI hit and rebounded on its Lower Lows Support trend-line.
With the market rebounding and opening considerably higher today, it is more likely technically that we have started the pattern's new Bullish Leg. With the last two such sequences rising by at least +11.00%, we expect a new similar uptrend, which as long as the 1D MA50 holds, could hit at least 26000 within a 40 day horizon.
-------------------------------------------------------------------------------
** Please LIKE 👍, FOLLOW ✅, SHARE 🙌 and COMMENT ✍ if you enjoy this idea! Also share your ideas and charts in the comments section below! This is best way to keep it relevant, support us, keep the content here free and allow the idea to reach as many people as possible. **
-------------------------------------------------------------------------------
💸💸💸💸💸💸
👇 👇 👇 👇 👇 👇

$MSTR Swing Trade Setup: Layered Short Entries on Breakout📉 MSTR "STRATEGY INC" STOCK – Bearish Thief Plan (Swing/Scalp Setup)
⚡ Trade Setup (Bearish Pending Order Plan)
Asset: NASDAQ:MSTR (MicroStrategy Inc.)
Plan: Bearish (waiting for support breakout confirmation).
Entry Zone:
Pending breakout entry @ 320.00 ⚡
Layered “Thief” Strategy (scaling entries):
Sell Limit Layers: 340.00 / 330.00 / 320.00
You may add or adjust layers based on your own risk tolerance.
🔔 Set TradingView alerts at breakout levels to track price action.
Stop Loss (Thief Style):
Protective SL @ 360.00 (after breakout confirmation).
Adjust per your strategy & risk management.
Target Zone (Exit):
Police barricade support @ 290.00
Note: Take profit is discretionary — escape with profits at your own chosen level 🚪💰.
🔑 Why This Plan? (Thief Strategy Context)
The Thief Plan = using multiple layered limit entries after a breakout for better risk/reward.
Scaling entries gives flexibility while reducing FOMO and chasing.
Exit early at support barricades or oversold traps.
📊 MicroStrategy (MSTR) Market Data Report
As of September 7, 2025
1. Retail & Institutional Sentiment 🤝
Retail: Mixed / cautious (crypto exposure volatility).
Institutional: Neutral → slightly bearish (Bitcoin correlation + regulatory risk).
Estimated Sentiment: 55% Neutral / 30% Bearish / 15% Bullish.
2. Fear & Greed Index 😨😋
Current level: Neutral ~50/100
Suggests balanced emotions → no extreme greed or fear.
3. Fundamental & Macro Scores 📈📉
Fundamental ~60/100: MSTR tied to Bitcoin trends, highly volatile.
Macro ~55/100: Pressures include crypto regulation, tech volatility, interest rates.
Bitcoin remains the key driver.
4. Market Outlook 🐂🐻
Bull Case: BTC rally → MSTR boost, institutional adoption helps.
Bear Case: Regulatory clampdowns, BTC volatility → downside pressure.
Overall: Neutral → Slightly Bearish (short-term caution).
🚀 Key Takeaways
NASDAQ:MSTR moves in sync with Bitcoin → monitor BTC charts closely.
Sentiment is not strongly bullish → short setups have edge here.
Thief layering strategy aligns with volatility.
Always respect SL & manage risk 🔐.
🔗 Related Pairs to Watch
BITSTAMP:BTCUSD
NASDAQ:COIN (Coinbase)
NASDAQ:RIOT (Riot Platforms)
NASDAQ:MARA (Marathon Digital)
SP:SPX / NASDAQ:NDX (macro impact on tech/crypto plays)
✨ “If you find value in my analysis, a 👍 and 🚀 boost is much appreciated — it helps me share more setups with the community!”
#MSTR #MicroStrategy #Stocks #SwingTrade #Scalping #BearishSetup #CryptoStocks #LayeredStrategy #ThiefPlan #BitcoinCorrelation #TradingViewIdea

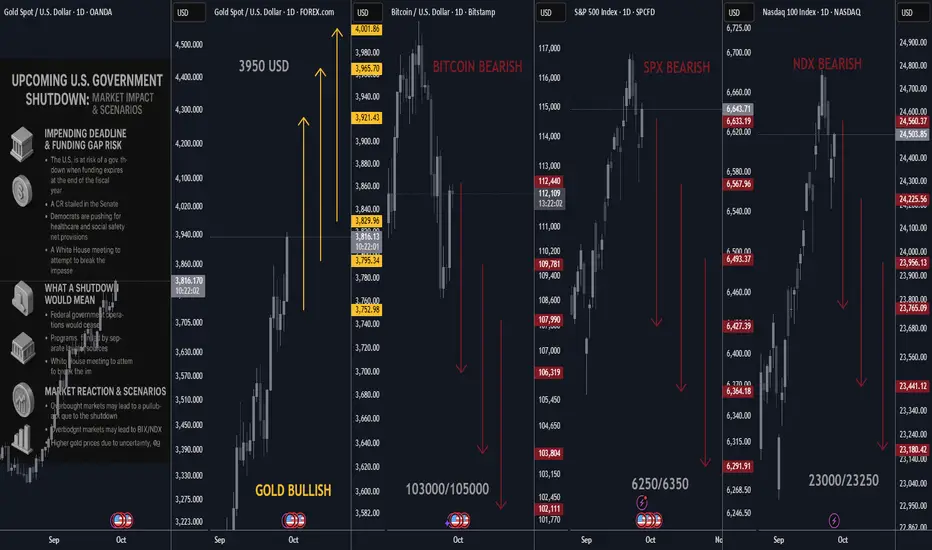
US govt Shutdown Impact on GOLD/BTC/SPX/NDX Overview📊 Scenario analysis
Assumed probabilities: 10-day (35%) / 20-day (40%) / 30-day (25%). These skew toward 20–30d expectation while allowing for a compromise CR late next week.
🗓️ 1) 10-day shutdown (quick CR by ~Oct 10)
• 🔑 Catalysts: market wobble + travel/FAA headlines + IPO freeze optics force a deal; leadership meeting produces a clean CR.
• 📉 SPX/NDX: -3% to -5% drawdown from pre-shutdown highs, then sharp relief. Mega-cap quality outperforms; small-caps lag on SBA loan pause.
• 💻 Bitcoin: -3% to -8% (high beta to equities, liquidity cautious); quick snapback if the deal lands and SEC footprint stays light.
• 🟡 Gold: +1% to +3%; fades a bit on resolution as real-rate anxiety reasserts. History shows shutdowns aren’t a reliable gold rocket on their own.
🗓️ 2) 20-day shutdown (through ~Oct 20) — “policy fog trade”
• 🔑 Catalysts: prolonged policy riders; BEA/Census blackout delays GDP/retail sales; SEC skeletal staff extends IPO drought. Fed guidance leans on forecasts, not fresh data.
• 📉 SPX/NDX: -5% to -8%. Factor rotation: low-vol/defensive > cyclicals; brokers/ECM-sensitive names soft; travel/airlines weak on FAA/TSA constraints.
• 💻 Bitcoin: -8% to -15% or flat-to-up if “crypto vs. Washington” narrative picks up while enforcement is thin — mixed precedent. This is the most two-sided asset here.
• 🟡 Gold: +3% to +6% as uncertainty premia build and central-bank-buying narrative stays intact. Stretching to $3,900–3,950 bullion target likely needs an added shock (ratings rhetoric, geopolitical flare).
🗓️ 3) 30-day shutdown (into late Oct) — “risk-off with rating overtones”
• 🔑 Catalysts: political stalemate; louder warnings about governance; issuance continues but optics around fiscal sustainability bite.
• 📉 SPX/NDX: -7% to -12%; HY spreads widen; VIX spikes; defensives/quality lead.
• 💻 Bitcoin: -15% to -25% on de-risking and liquidity run-down unless regulatory paralysis creates a “wild west” window and ETF inflows offset — low probability but non-zero.
• 🟡 Gold: +5% to +10%. A test of new cycle highs is plausible; hitting ~$3,900 quickly would likely require a ratings/FX scare, not just a shutdown.
________________________________________
🧭 What’s different this time
• 📉 Data blackout = policy uncertainty: Delays to GDP/retail sales/trade stats complicate Fed read-throughs — markets price fatter uncertainty premia.
• 📜 Regulatory throttle: SEC/CFTC “skeletal staff” → IPO drought and slower filings (headwind to brokers/ECM), even as EDGAR stays up.
• ✈️ Real-economy micro-pain points: FAA hiring/training halted → travel frictions; SBA lending paused → small-cap cash flow stress.
• ⚠️ Ratings optics: After Moody’s downgrade, governance headlines cut deeper than in prior shutdowns.
________________________________________
🤹 Contrarian angles
1. 🪙 “Bad data is no data” rally: If key prints are delayed, the market extrapolates a dovish Fed trajectory → curve bull-steepening and equities rally on rates, overpowering shutdown angst.
2. 💻 Crypto resilience: A lighter-touch SEC during a lapse can reduce headline risk; BTC has rallied during a shutdown before, though not consistently.
3. 🟡 Gold stall: If real yields back up on supply/duration worries rather than down on growth fear, gold can underperform despite the shutdown — history shows no clean positive beta.
4. 📈 Buy-the-resolution pop: Equities’ median post-shutdown performance is positive at 3–6 months — setting up a tactical sell the rumor / buy the cease-fire template.
________________________________________
💡 Trades & risk management tactical, 2–6 weeks
📉 Equities (SPX/NDX)
• 🛡️ Hedge now, monetize spikes: 4–6 week put spreads on SPX/NDX (≈25Δ/10Δ) sized for a -6–8% path; roll down if we breach the first support zone. Consider VIX 1–2M calls as convex tail protection.
• 🔄 Pairs/tilts: Underweight ECM-sensitive brokers; overweight staples/health-care utilities; short airlines vs. travel alternatives until FAA constraints clear.
💻 Bitcoin
• 🛡️ De-gear & collar: Reduce leverage; implement collars (sell 10–15Δ OTM calls to finance 20–25Δ puts). If we gap lower into -10% territory quickly, look to sell downside skew and pivot to short-dated call spreads into resolution.
🟡 Gold
• 📈 Own upside, respect mean-reversion: Use GLD call spreads (1–2M) targeting +4–8% with limited theta. $3,900–$3,950 bullion target is a stretch on shutdown alone; size for base-case +3–6% unless a ratings/geopolitical catalyst emerges.
📉 Small-caps / credit
• 🛑 IWM vs. QQQ underweight (SBA bottlenecks); keep HY credit hedged via CDX HY or HYG puts into Day 15+.
________________________________________
🔍 Levels & signposts to watch
• 🏛️ Policy tape: Any Senate movement on a “clean” CR; signs of healthcare rider compromise.
• 📅 Data calendar: Official notices on jobs/CPI/GDP timing (BLS/BEA/Census). A confirmed delay → more policy fog premium.
• ✈️ Micro stress: FAA/TSA updates; SEC operating status for registrations; SBA loan queue.
• ⚠️ Ratings rhetoric: Any agency commentary tying shutdown length to governance risk.
________________________________________
📝 Bottom line
• 📉 Base path: A -5–8% equity drawdown with gold +3–6% and BTC -8–15% is the modal 2–4 week outcome if we run ~20 days.
• ⚠️ Tail path: At 30 days, governance optics + data blackout can push SPX/NDX -7–12%, BTC -15–25%, gold +5–10%.
• 🔄 Contrarian risk: A quick CR or a “no data → dovish” impulse squeezes shorts — be ready to pivot to a buy-the-resolution stance.
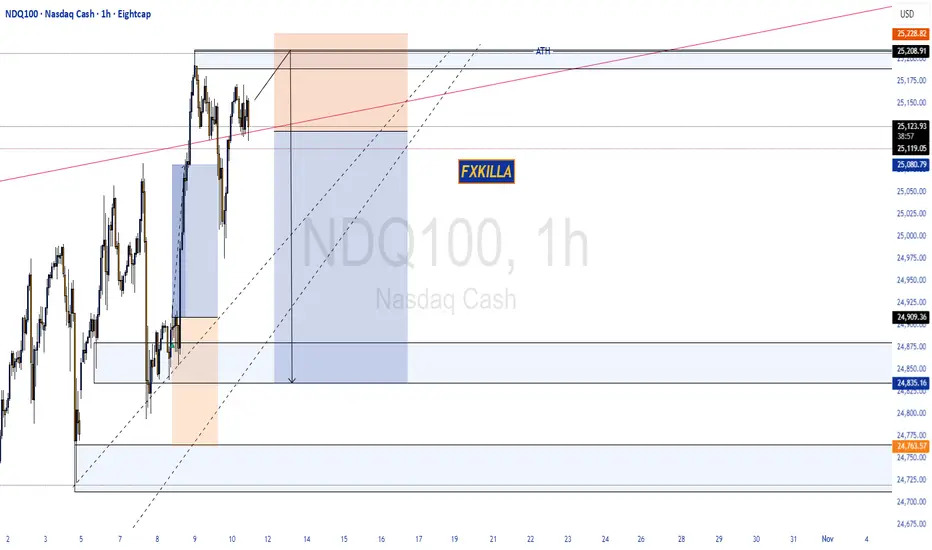
NASDAQ100 HIGH PROBABILITY SETUP SOON!!!🚨 NAS100 HIGH PROBABILITY SELL SETUP 🚨
* Here We Can See Clearly The Next Potential Move For US100 Coming Hours/Days.
* Keep Your Eyes Close On Your Trading Positions.
* Happy PIP Hunting Traders.
FXKILLA.
8 oct pushing uplooking for a long
entry in blue
target in green
stop in red.
all details are explained in the video.
Have fun
Elektra

NAS100 Analysis: Trend, VWAP, Three-Drive Pattern, and Fibonacci📹 In this video, we take a detailed look at the NASDAQ/NAS100, which is currently in a strong bullish trend 📈. While the momentum is impressive, price may now be overextended, so caution is important ⚠️.
🔎 I share how I incorporate the VWAP, three-drive patterns, and the Fibonacci retracement tool to help plan high-probability trades 🎯.
📊 We also cover trend analysis, price action, and market structure, giving you a full breakdown of how these indicators work together to identify potential setups 🚀.
⚠️ Disclaimer: This content is for educational purposes only and not financial advice. Always trade responsibly and manage your risk.

Is the Nasdaq a Bubble? A Technical Correction Is PossibleCME_MINI:NQ1!
Here’s a breakdown of the current Nasdaq correction scenarios based on the Nasdaq Futures (NQ1!) chart.
Every time I reached the top of the channel, an adjustment came out.
Based on the monthly chart, it has closed positively for six consecutive months since the tariff reduction, and it is judged to have entered the overbought zone by breaking through the upper Bollinger Band.
While a Santa Rally could still occur in Q4, we expect a short-term correction within one to two weeks.
Your follow and boost would mean a lot. 🚀
I am Korean and I used Google Translate.

7 oct looks short to melooking at the market today.
usa players have shown great strenght to short the markert.
so as seen on the video .
entry in blue 25248
target in 25028
stop in red 25291
have fun
Elektra

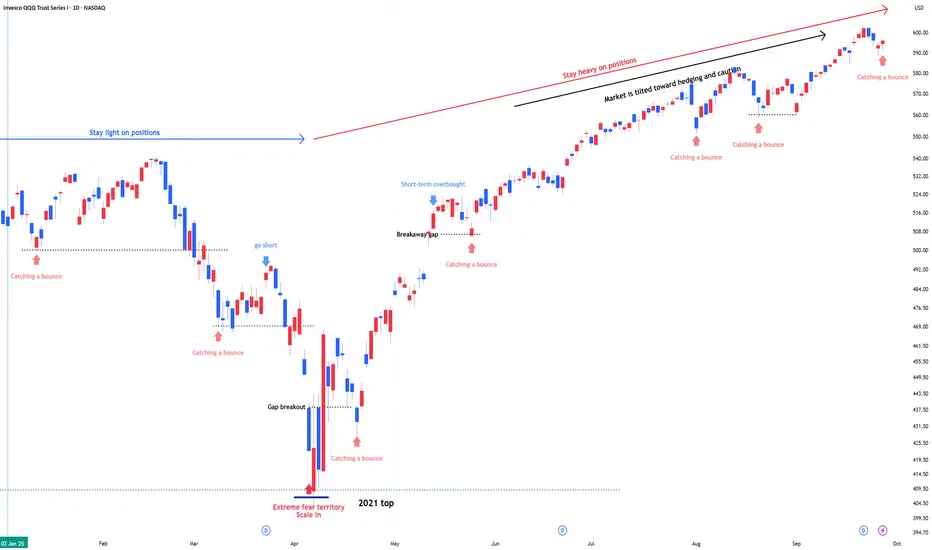
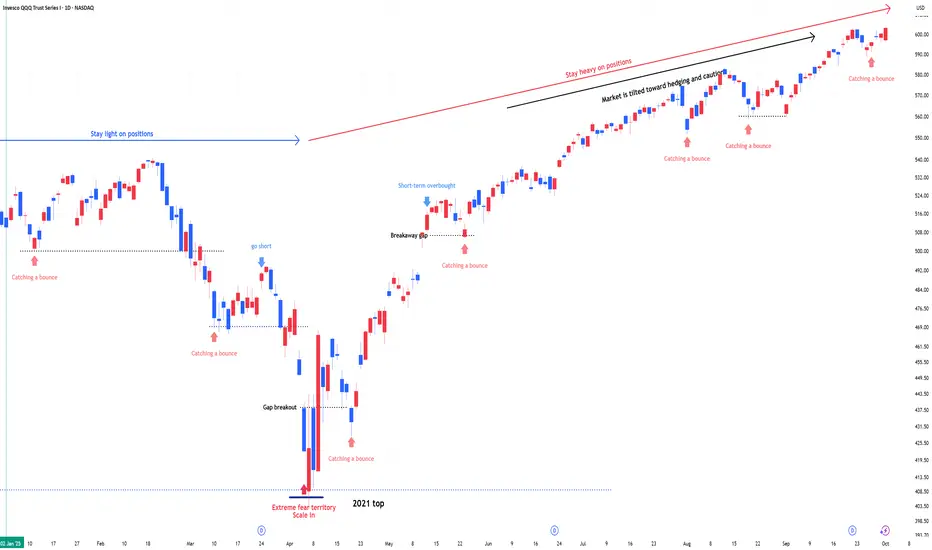
QQQ : Stay heavy on positionsQQQ : Stay heavy on positions (QLD, TQQQ)
Entering a risk-on, high-volatility zone.
In stay light on positions zones, I hold QQQ and reduce exposure.
In stay heavy on positions zones, I increase allocation using a mix of QLD and TQQQ.
** This analysis is based solely on the quantification of crowd psychology.
It does not incorporate price action, trading volume, or macroeconomic indicators.
SPY : Stay heavy on positionsSPY : Stay heavy on positions (2x leverage)
Entering a risk-on, high-volatility zone.
In stay light on positions zones, I hold SPY(+QQQ) and reduce exposure.
In stay heavy on positions zones, I increase allocation using a mix of SSO(+QLD) and TQQQ.
** This analysis is based solely on the quantification of crowd psychology.
It does not incorporate price action, trading volume, or macroeconomic indicators.

NASDAQ Channel Up found support and aims for 25600.Nasdaq (NDX) has been trading within a Channel Up since the August 28 High and on Friday it tested its 1H MA100 (green trend-line) again and rebounded. That has been a bullish continuation signal within this pattern every time a 1H MA50/ 100 takes place.
On the previous Bullish Leg that confirmed the upside continuation all the way to the 2.382 Fibonacci extension before a 1H MA50/ 100 Bearish Cross and new Low.
As a result, the current short-term Target on Nasdaq is 25600.
-------------------------------------------------------------------------------
** Please LIKE 👍, FOLLOW ✅, SHARE 🙌 and COMMENT ✍ if you enjoy this idea! Also share your ideas and charts in the comments section below! This is best way to keep it relevant, support us, keep the content here free and allow the idea to reach as many people as possible. **
-------------------------------------------------------------------------------
💸💸💸💸💸💸
👇 👇 👇 👇 👇 👇

Will AMD recover and catch up with NVDA? updated/Revised Outlook🔸Hello traders, today let's review 2days/candle price chart for AMD.
Price contained within bullish channel since 2021, however currently
pullback/correction in progress.
🔸65% correction in progress, based on previous swings expected to complete at/near 88/90 USD in Q1 2025. Until then it's recommended to stay out.
🔸Once we bottom out near 90 USD in Q1 2025, expecting bullish swing 265% gains off the lows, so projected high is 310/320 USD.
🔸Recommended strategy bulls: Bulls wait for correction to complete at/near 85 usd in Q1 2025 and get ready to BUY/HOLD. Bullish impulse / reversal off the lows price target based on measured move projection is 310/320 USD. patience required, do not expect miracle/overnight gains in this market. good luck!
🎁Please hit the like button and
🎁Leave a comment to support our team!
RISK DISCLAIMER:
Trading Futures , Forex, CFDs and Stocks involves a risk of loss.
Please consider carefully if such trading is appropriate for you.
Past performance is not indicative of future results.
Always limit your leverage and use tight stop loss.

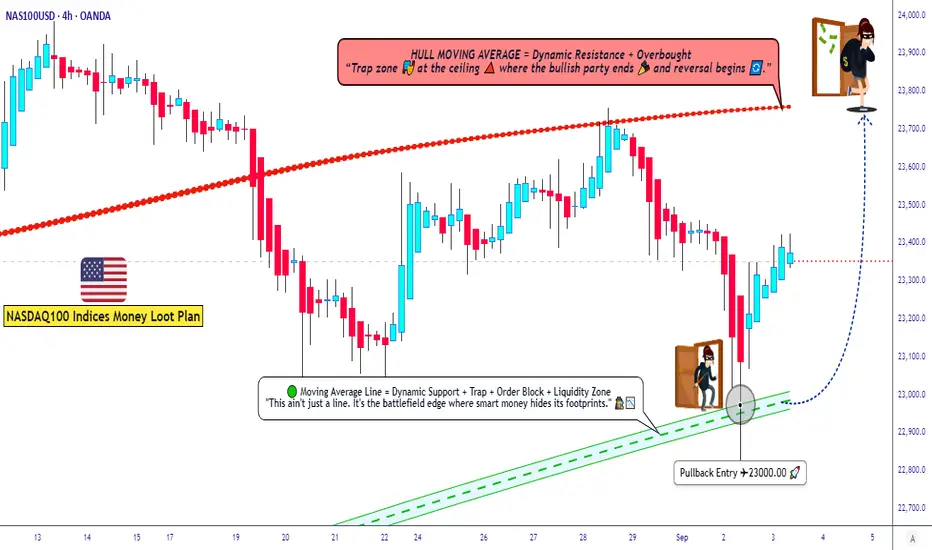
US100 Trading Plan ¦ Layering Strategy + Macro Sentiment Drivers🚀 NASDAQ100 / US100 Index – Thief Money Heist Plan 🎭
📌 Plan: Bullish Swing / Scalping Setup
Dear Ladies & Gentlemen (Thief OG’s), here’s the heist-style breakdown for US100 🔑:
🏴☠️ Entry Style (Thief Layering Strategy)
Using layered limit orders for flexibility & precision:
• 23200.0
• 23250.0
• 23300.0
• 23350.0
(You may increase limit layers based on your strategy & risk appetite)
📉 Moving Average Pullback Entry Plan
• Buy entries on pullbacks to the Fibo level 382 Triangular Moving average zone.
• Look for bullish candles confirming the bounce from these MAs.
• This offers better risk-to-reward by catching momentum on retracements instead of chasing highs.
❓ Why This Works?
• Moving averages often act as dynamic support/resistance in trending markets.
• Institutional traders & algos track them heavily, making them high-probability zones.
• Combining with layering entries = higher flexibility + reduced risk of mistimed single entry.
🛡️ Stop Loss (Protect the Vault)
• Thief SL: @23000.0
• Reminder: Adjust your SL based on your own strategy & risk tolerance.
🎯 Target (Escape Zone)
• Overbought + Trap Zone ahead!
• Escape target: @23750.0
• Note: Don’t rely only on my TP — secure profits at your own pace and risk.
📊 US100 Index CFD Real-Time Data Sep 03
📈 Daily Change: +133.47 (+0.57%)
📅 Monthly Performance: +0.76%
📆 Yearly Performance: +23.48%
😰😊 Fear & Greed Index
📊 Current Reading: 53/100 (Neutral)
🧐 Interpretation: Market sentiment is balanced, showing neither extreme fear nor greed. Investors are cautious but not panicked.
🧠 Retail vs. Institutional Sentiment
👥 Retail Traders: Moderately bullish (55% Long, 45% Short)
🏦 Institutional Traders: Slightly cautious (50% Long, 50% Short)
🔑 Key Drivers: Mixed signals from manufacturing data and upcoming labor market reports.
📉📈 Fundamental & Macro Score
📊 Macro Score: 6/10
Manufacturing PMI (48.7) still in contraction but improving.
Labor market data (JOLTS) awaited for clarity.
⚡ Volatility Score: 5/10 (Moderate)
VIX near average levels, indicating stable expectations.
💧 Liquidity Score: 7/10
Strong volume and breadth in large-cap tech stocks.
🐂🐻 Overall Market Outlook
✅ Bullish (Long): 60%
Supported by strong yearly gains and resilience in big tech.
⚠️ Bearish (Short): 40%
Concerns over manufacturing contraction and inflation pressures.
💡 Key Takeaways
📈 US100 is trending mildly positive today (+0.57%).
😐 Sentiment is neutral—no extreme fear or greed.
📊 Macro data hints at cautious optimism but watch for upcoming labor reports.
🐂 Overall bias leans slightly bullish for long-term holders.
📊 Related Pairs to Watch
FOREXCOM:SPX500
TVC:DJI
TVC:VIX
NASDAQ:NDX
FX:USDOLLAR
✨ “If you find value in my analysis, a 👍 and 🚀 boost is much appreciated — it helps me share more setups with the community!”
#NASDAQ100 #US100 #NDX #SPX500 #DJI #TradingView #SwingTrade #ScalpTrading #LayeringStrategy #MarketAnalysis
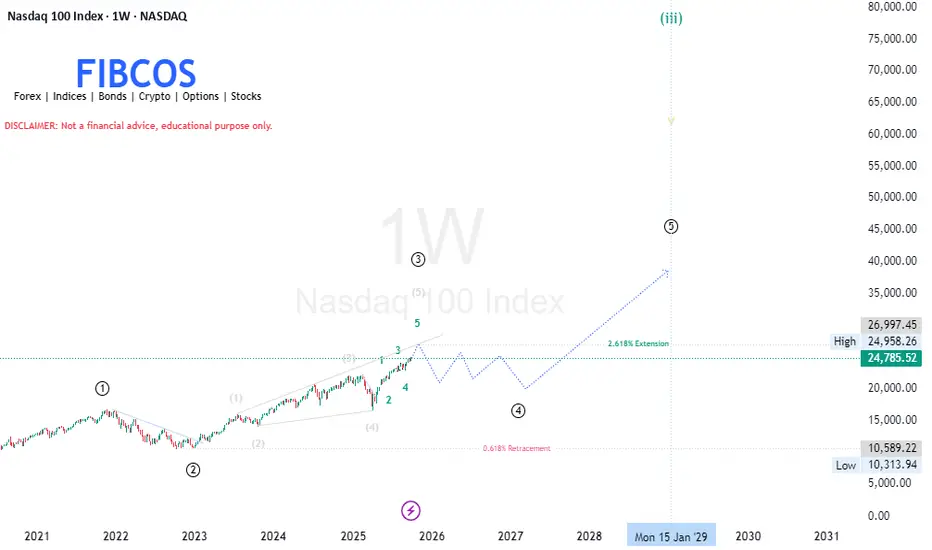
NASDAQ 100 (1W) – Elliott Wave + Smart Money Analysis by FIBCOSThe index (NASDAQ) continues its macro impulsive structure, now expanding through Wave (3) — targeting the 2.618 Fibonacci extension near 26,997( 27K ).
Smart Money is driving this leg with clear bullish order flow, creating multiple Fair Value Gaps and Breaks of Structure along the way.
After this expansion, we expect a Wave (4) correction between 22,000–17,500, where institutional demand zones await for re-accumulation before the next macro bullish leg (Wave 5) toward 35,000–38,000.
📊 Confluence Highlights:
Wave (3) → 2.618 extension (target zone: 26.9K–27K)
Wave (4) → 0.382–0.618 retracement (zone: 22K–18K)
Wave (5) → 1.618 projection (target zone: 35K–38K)
🧠 Elliott Wave Theory Interpretation
① Wave (1) — The Initial Expansion (2020–2021)
Early bullish impulse following pandemic recovery.
Represents Smart Money accumulation followed by a breakout.
Retail participation remains limited; institutional footprints dominate.
② Wave (2) — Corrective Pullback (2022–2023)
Sharp decline toward the 0.618 Fibonacci retracement zone.
This phase was a liquidity grab — Smart Money re-entering after shaking out weak hands.
Price formed a higher low , maintaining long-term bullish structure.
③ Wave (3) — The Power Leg (2023–2026)
The strongest and most extended wave — aligned perfectly with the 2.618 Fibonacci extension (~26,997 zone).
Confirms institutional markup phase , where:
Retail short sellers are trapped.
Fair Value Gaps (FVGs) are created during impulsive moves.
Continuous Break of Structure (BOS) validates bullish order flow.
Smaller degree sub-waves (1–5) visible inside, confirming internal impulse rhythm.
④ Wave (4) — The Upcoming Correction (2026–2027)
Expected macro re-accumulation zone , likely between 22,000 – 17,500 .
Market may enter a sideways complex correction (W–X–Y)/(W-X-Y-X-Z) pattern.
This is the Smart Money re-accumulation phase — liquidity collection before the next macro expansion.
Demand zones: previous unmitigated order blocks around 20,000–18,000 area.
⑤ Wave (5) — The Final Expansion (2028–2029)
After consolidation, the index may aim for new all-time highs toward 35,000–38,000 range.
This represents a distribution phase , where Smart Money offloads positions near cycle tops.
Expect divergence in momentum indicators , hinting at the end of the 5-wave structure.
---
💡 Smart Money Concept (SMC) Confluence
Concept | Observation | Implication
Liquidity Sweep - Below 2022–2023 lows (Smart Money accumulation confirmation)
Order Blocks - 22,000–18,000 zone {Institutional demand zone for Wave (4)}
Fair Value Gaps (FVGs) During Wave (3) impulsive rise {Will likely get mitigated during Wave (4)}
Break of Structure (BOS ) Continuous bullish BOS confirms institutional intent
Premium/Discount Zones Current price at premium (above equilibrium) Ideal region for institutional profit-taking
🧭 Smart Money Flow:
Accumulation → Expansion → Re-accumulation → Final Distribution
---
📐 Fibonacci Confluence Levels
Wave (3) → 2.618× extension of Wave (1–2) → ~26,997 (expected macro resistance).
Wave (4) → retracement likely between 0.382–0.618 → 22,000–17,500 zone.
Wave (5) → projected 1.618× of Wave (1–3) → 35,000–38,000 .
---
🧭 Market Outlook Summary
Timeframe | Bias | Expectation
Short-Term (2025–2026) 📈 Bullish Continuation toward 26,900–27,000
Medium-Term (2026–2027) ⚠ Corrective Re-accumulation phase, smart money reloads
Long-Term (2028–2029) 🚀 Bullish Wave (5) macro expansion toward 35K–38K
---
🔖 FIBCOS Summary
> NASDAQ 100 Weekly Chart (Elliott + SMC)
Currently expanding through a powerful Wave (3) toward the 2.618 Fibonacci extension (~27K).
After completion, a macro correction (Wave 4) is expected, providing the next Smart Money accumulation zone between 22K–18K before the final Wave 5 expansion toward new highs beyond 35K.
📘 Disclaimer: Not financial advice. Educational purpose only.
#FIBCOS #NASDAQ100 #ElliottWave #SmartMoneyConcept #MarketAnalysis #MarketCycle #Fibonacci
$NDX $SPX $BTC All Close at Weekly ATHPretty cool to see ₿itcoin, S&P 500 and Nasdaq all close the week at new ATH 🥳
And now we have $325B about to be dumped into the US economy in FY26Q1 along with more rate cuts on the way.
Next time you speak to a bear, reply with FU HIGHER 🚀

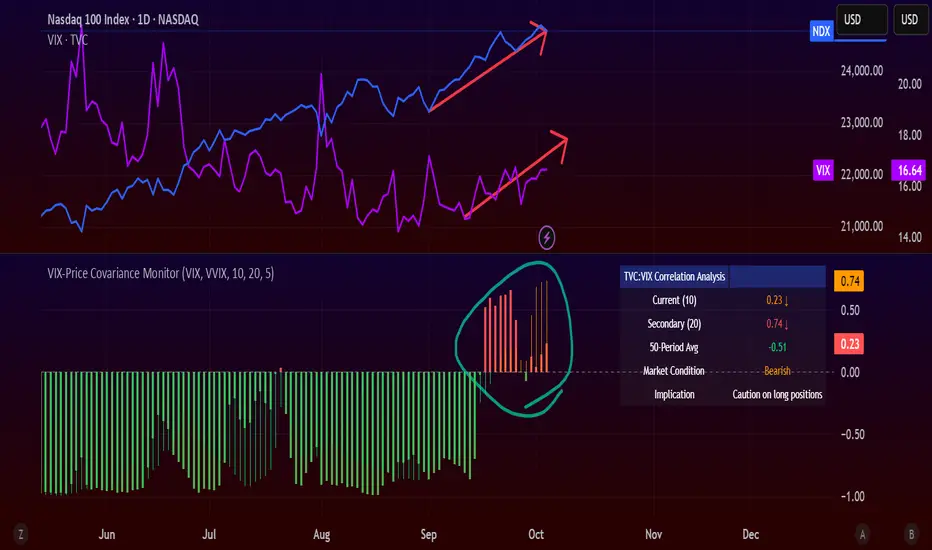
ALERT: VIX-NDX COVARIANCE HITS DANGER ZONEA few days ago, my custom VIX–Price Covariance Monitor started flashing red... and it hasn’t cooled off since.
Here’s what that means 👇
- The TVC:VIX (volatility index) and NASDAQ:NDX (Nasdaq 100) are now moving in the same direction.
That’s not normal.
Usually, when stocks rise, volatility falls.
But when both start climbing together — it means something under the surface is fracturing.
Half the times this correlation flips positive, the market corrects or worse, it crashes.
I’m not panic‑selling, but I’m definitely not buying either for now.
No new longs unless it’s a screaming opportunity.
In the meantime? Stacking cash and sitting tight.
This is time to play close attention to the market,
QQQ : Stay heavy on positionsQQQ : Stay heavy on positions (QLD, TQQQ)
Entering a risk-on, high-volatility zone.
In stay light on positions zones, I hold QQQ and reduce exposure.
In stay heavy on positions zones, I increase allocation using a mix of QLD and TQQQ.
** This analysis is based solely on the quantification of crowd psychology.
It does not incorporate price action, trading volume, or macroeconomic indicators.
30 sept DOWN NASDAQshort in nasdaq.
looking at weaknes in daily.
entry in blue
stop in red.
target in green.
have fun
all details of the trade are explained on the video
Electra 33

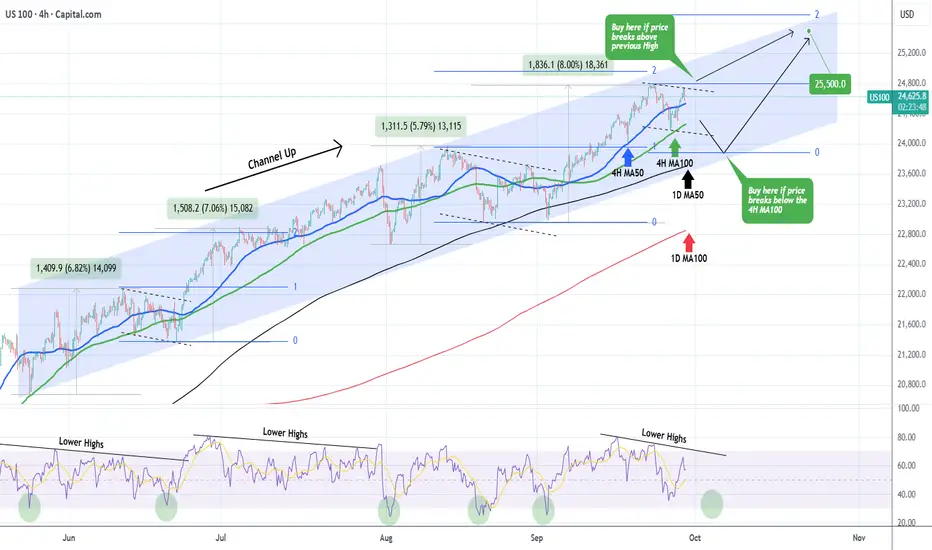
NASDAQ in no action zone. Buy break-out or pull-back.Nasdaq (NDX) has been trading within a 4-month Channel Up and its most recent low has been on its 4H MA100 (green trend-line) 2 days ago.
As long as it holds, it maintains the short-term bullish trend but a confirmed buy signal would be after the price breaks above its previous 24800 High.
Until it does, it might be within a technical Bearish Leg similar to late August's and mid June's that both broke below the 4H MA100 before bottoming on the Higher Lows trend-line of the Channel Up and rebounded. The 4H RSI Lower Highs structure shows that we might be on such a pull-back sequence, which turns into a buy below 33.00 (RSI).
As a result, we will either wait for a 24800 break-out or a 1D MA50 (black trend-line) pull-back before initiating a buy again. In both cases, our Target is 25500 (just below the 2.0 Fibonacci extension).
-------------------------------------------------------------------------------
** Please LIKE 👍, FOLLOW ✅, SHARE 🙌 and COMMENT ✍ if you enjoy this idea! Also share your ideas and charts in the comments section below! This is best way to keep it relevant, support us, keep the content here free and allow the idea to reach as many people as possible. **
-------------------------------------------------------------------------------
💸💸💸💸💸💸
👇 👇 👇 👇 👇 👇
SPY trend Broken? Use this Long / Short StrategyLast week was a choppy sell off in the markets.
We did see the bulls defend price later into the week by bouncing the main indices very nicely.
We discuss the simple support / resistance where you should be watching.
Using the daily 7MA as resistance can be shorted however if we recapture and close above, then the markets remain a long to new highs.
The trend of higher lows is still in tact signaling bullish strength... can we search for a new higher high?

September 2025 Market Summary Gold and ForexProjectSyndicate Market Summary September 2025
📊 MTD performance
🟡 GOLD (XAUUSD): 3,759.65 | +286.65 (+8.31%)
💶 EURUSD: 1.1702 | +16 pips (+0.14%)
💷 GBPUSD: 1.3392 | −112 pips (−0.83%)
💴 USDJPY: 149.19 | +211 pips (+1.43%)
📈 SPX: 6,637.97 | +236.46 (+3.69%)
📈 NDX: 24,503.57 | +1,483.10 (+6.44%)
________________________________________
🗞 September overview
• 🇺🇸 The Fed cut 25 bps on September 17 and flagged the possibility of further cuts this year, reinforcing a softer USD bias and boosting gold demand.
• 🇪🇺 The ECB held rates on September 11, though left the door open for easing later.
• 🇬🇧 The Bank of England held rates and slowed quantitative tightening on September 18.
• 🇯🇵 The BoJ maintained a “hawkish hold” on September 19, started unwinding ETF/REIT holdings, and signaled possible rate risks into October — supporting JPY on abrupt USD strength.
• 🟡 Gold made a fresh intramonth high near ~$3,790, before settling slightly lower.
• Stronger U.S. economic data mid-month (jobs, yields) briefly undercut rate cut expectations, leading to a temporary gold dip, but the momentum has largely resumed.
• Tariff announcements and trade-policy uncertainty added safe-haven tailwinds to gold.
________________________________________
🟡 Gold Market Overview – September 2025
✨ Key Highlights & Drivers
• All-time high revisit: Spot gold pushed toward $3,790 mid-month on renewed enthusiasm for Fed easing and weaker USD.
• Volatility around economic surprises: Upside surprises in US data (jobs, GDP) triggered brief USD strength that pressured gold, but the downside was limited.
• Fed narrative remains gold’s ally: The dovish pivot (25 bps cut + future cuts flagged) continues to lend structural support to gold.
• ETF & institutional flows: Inflows into gold ETFs have reaffirmed investor appetite for safe-haven exposure.
• Risk / geopolitical spillovers: Oil price jitters, trade frictions, and general macro uncertainty underpin demand for non-correlated assets.
• Technical posture: After surging, gold has found interim support in the region of ~$3,650–3,700, with resistance clustering near $3,800. A sustained break above the latter could open targets toward $3,900+.
📊 Performance Recap
Gold has posted one of its strongest monthly performances of 2025, currently up ~8.7 % MTD.
Stronger parts of the rally were clustered around rate cut confirmation and safe-haven demand spikes.
🔍 Risks & Watch-Outs
• A surprise resurgence in U.S. economic strength (inflation, jobs) could push rate markets back toward dovish skepticism, pressuring gold.
• A re-strengthening USD (driven by rates or yield spreads) will be headwind for dollar‐priced gold.
• Central bank actions: further buying or selling by official sectors could tilt balance.
• Technical overextension: short-term pullbacks or consolidations are plausible given the sharp run-up.
________________________________________
💱 FX Landscape – September 2025
• EURUSD: The pair remains stuck under ~1.1700, recovering modestly from USD spikes but lacking strong directional conviction.
• GBPUSD: Under pressure through the month, sliding toward 1.3350 as sterling weakens on yield differentials and global risk dynamics.
• USDJPY: Strength in yields and risk dynamics have nudged USDJPY higher, though BoJ vigilance and intervention risk temper runaway moves.
Broader theme: while risk sentiment supports carry / USD strength, central bank policy cycles and macro surprises are injecting volatility and preventing runaway trends.
________________________________________
📝 Summary & Key Takeaways
✅ What Worked in September
• Gold leveraged dovish central bank messaging and USD softness to consistently outperform across risk regimes.
• Positioning toward safe havens paid off in a month marked by macro surprises and geopolitical noise.
• FX markets remained choppy, with no clear trending momentum — caution was rewarded.
⚠️ What to Watch Going Forward
• U.S. data flow — especially inflation, jobs, and PCE — could reshape Fed expectations and thus gold/FX direction.
• USD momentum — a reversal in dollar strength could compress gold gains; sustained USD weakness could accelerate the bull run.
• Intervention / central banks — any surprises from BoJ, PBoC, or central banks stepping into gold or FX markets could upend positioning.
• Technical zones — if gold can break and hold above $3,800, it may open new leg toward $3,900+; failure may invite a pullback toward $3,650–3,700.

QQQ : Stay heavy on positionsQQQ : Stay heavy on positions (QLD, TQQQ)
Entering a risk-on, high-volatility zone.
A signal for catching a bounce has emerged.
In stay light on positions zones, I hold QQQ and reduce exposure.
In stay heavy on positions zones, I increase allocation using a mix of QLD and TQQQ.
** This analysis is based solely on the quantification of crowd psychology.
It does not incorporate price action, trading volume, or macroeconomic indicators.