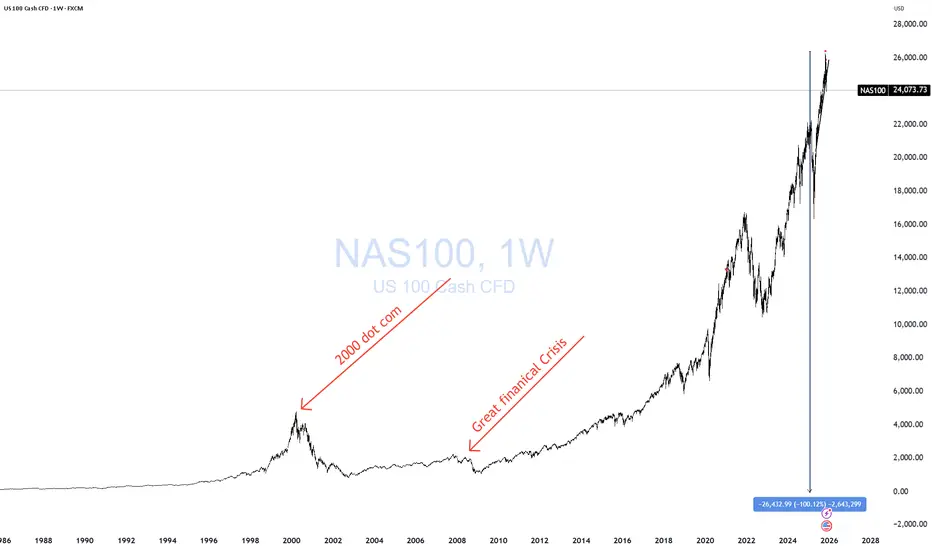
NDX - 92% From ZeroI want you to always remember one thing:
Wherever the price goes, it’s always 100% from zero.
That’s why every now and then you need to take the chart off log and look at it with fresh eyes.
Occam’s razor.
I keep hearing the PERMA-BULL crowd screaming that “the bears are calling this an AI bubble,” and in the same breath whining that the pullback is “overdone” or “extreme.”
Really?
The S&P is down 5%, and they’re already crying about the bears?
SMH.
It’s all strawman nonsense. Don’t fall for it.
Take it off log…
Remember everything is 100% from zero…
Use your basic, instinctive judgment…
And then ask yourself what your eyes are telling you when you look at this chart.
That’s the truth — not the narratives.
THANK YOU for getting me to 5,000 followers! 🙏🔥
Let’s keep climbing.
If you enjoy the work:
👉 Boost
👉 Follow
👉 Drop a solid comment
Let’s push it to 6,000 and keep building a community grounded in truth, not hype.
Ndx!
How to Identify Stocks Uptrends and Downtrends to Gain a TradingHow to Identify Stocks Uptrends and Downtrends to Gain a Trading Edge and understand the psychology behind the patterns

US100NASDAQ ( US - 100 )
- Completed " 12345 " Impulsive Waves
- Break of Structure
- Demand Zone
- RSI - Divergence
- Order Block

NAS100 Bullish Structure Break with Key Fibonacci Level in PlayThe NAS100 is now showing clear signs of strength, with a solid bullish move and a confirmed break of structure on the 4-hour timeframe 🚀. With this shift, the focus turns to how price behaves on the pullback.
The main level of interest is the 61.8% Fibonacci retracement of the current swing. A buy setup becomes valid only if price retraces and holds above the 61.8 level 🔥. Holding above this zone would indicate a shallow pullback — a strong sign that buyers are stepping in aggressively and maintaining control.
If price respects the 61.8 and then breaks structure to the upside again, that’s the confirmation needed to look for long opportunities 📊.
However, if price breaks below the 61.8 level, the idea is invalidated and should be abandoned. A deeper retracement may signal weakness, although it could also be a smart-money liquidity run before a continuation — either way, the priority is to see momentum hold above 61.8 to keep the bullish narrative intact ⚠️.
Not financial advice.

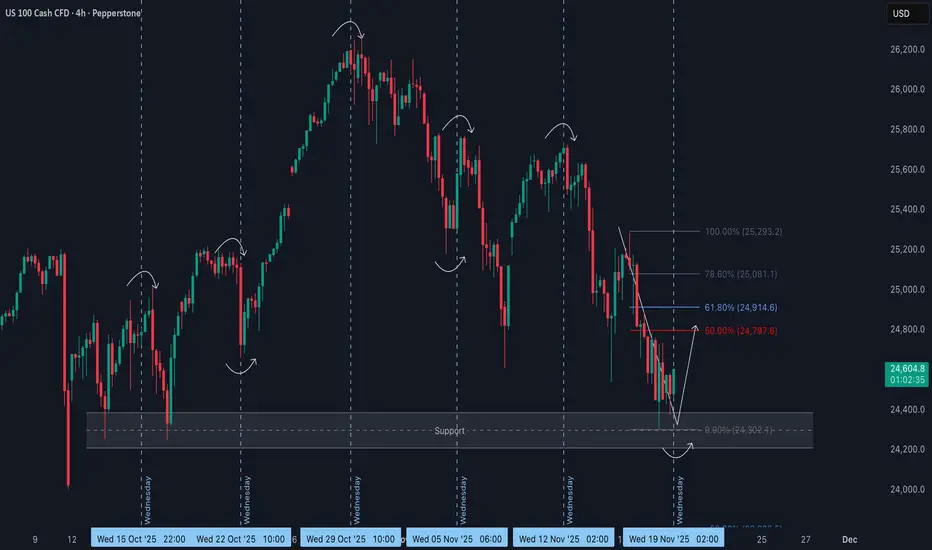
NAS100 Wednesday Reversal Potential from Key SupportOver the past several weeks, the NAS100 has shown a clear tendency for aggressive mid-week reversals, with Wednesdays repeatedly triggering sharp shifts in direction 🔄. This pattern suggests a strong time-based element in the algorithmic delivery of price, rather than random fluctuation.
🗓️ Each Wednesday has produced a notable reaction, whether through a liquidity grab, a stop run, or a full intraday reversal. With today being Wednesday once again, the timing aligns perfectly with the type of behaviour the market has been delivering consistently.
📉 The current decline has brought price directly into a well-defined high-timeframe support region. This area has a history of accumulation and typically holds a large amount of resting liquidity underneath it. The repeated wicks into this zone resemble classic Wyckoff spring behaviour 📦 — a sweep of sell-side liquidity followed by a potential response from larger players.
📐 The most recent bearish leg is noticeably overextended and has not offered a proper retracement since breaking lower. This leaves inefficiencies behind and increases the likelihood of a move back toward equilibrium.
🔄 Given the confluence of mid-week timing, the tap into higher-timeframe support, the liquidity sweep, and the extended nature of the current downswing, the expectation is for at least a corrective move back into equilibrium 📈.
A bullish break of short-term structure on the lower timeframes would strengthen this bias and open the door for a retracement into the premium levels listed above.
⚠️ Not financial advice. This is simply a technical outlook and my opinion.
NASDAQ Can the 1D MA50 give one more rally??Nasdaq (NDX) has been trading within a 6-month Channel Up and Friday saw the price breaking below its 1D MA50 (blue trend-line) and the pattern, but managed to close back above it for the 2nd time in a week (blue circles).
This resembles the September 02 break, which eventually also closed above it and initiated a +9.59% Bullish Leg. With the 1D RSI also testing a similar Support Zone with September's, we expect the index to initiate the new Bullish Leg, as long as it continues to close its daily candles above the 1D MA50.
Our Target is 26900 (+9.59%).
---
** Please LIKE 👍, FOLLOW ✅, SHARE 🙌 and COMMENT ✍ if you enjoy this idea! Also share your ideas and charts in the comments section below! This is best way to keep it relevant, support us, keep the content here free and allow the idea to reach as many people as possible. **
---
💸💸💸💸💸💸
👇 👇 👇 👇 👇 👇

NAS100 Trade Plan: Counter-Trend Opportunity Into Friday CloseI’m currently watching the NASDAQ NAS100 📊 and looking for a potential setup as we head into the Friday close. The market has pushed into the weekly low, and I’m anticipating the possibility of a retracement, which could offer a counter-trend opportunity during the New York session. 🚀📉📈 All details are broken down clearly in the video — this is not financial advice. ⚠️

$QQQ: Doubtful Low The QQQ is currently showing a lower high and a lower low, indicating a likely corrective Zig Zag pattern, with wave C only slightly longer than wave A. The 1x1 Extension is positioned at 586. Last Friday's promising bounce was halted at the horizontal resistance level of 613.
The RSI has reached the same area where previous bounces occurred during the rally from the April low. The bulls need to demonstrate that last Friday's low can serve as a springboard for a recovery.

NASDAQ NAS100 Under Pressure – Watching for a Break of StructureThe NASDAQ is currently showing signs of weakness on the 4-hour chart. Sellers are gradually stepping in, and we can see US100 bearish momentum starting to take control. The market is under pressure, and price action is hinting at potential continuation to the downside.
I’ll be watching closely for a NAS100 break below the current range low — if price retests that level and fails to reclaim it, that would confirm a bearish market structure shift 🔻. Such a setup could provide a high-probability short opportunity as momentum accelerates to the downside.
⚠️ This is not financial advice — purely for educational and analytical purposes.

December 2025 is Hurst's 9 Years Cycle!Margin of Error "Adjusted" on the chart:
9 Years, 4.5 Years and 18 Months !
1: September 2025 is our early trough
2: 2027 is our late trough
3: Or we are having one right now !

Nike by April 2025 we should have break out or breakdown !101 Trend lines analysis. By April we should could/might reach the Red line in which we will have a break out to a new ATH in the next years or so or a break down to the 40ish/50ish region.!

Nike's 1984 Vs 2000 Major Trend lines The 1984 Major and historical Trend line is already broken with 3 candles below, technially
this is a valid and confirmed breakdown.
The 2000 Major and historical Trend line is hanging by $5 give or take $66 -+ is the support for the TL.

QQQ : Stay heavy on positionsQQQ : Stay heavy on positions (QLD, TQQQ)
Risk-on Phase 1, high-volatility zone
Risk-on Phase 2, high-volatility zone.
Critical Sensitivity Zone
In stay light on positions zones, I hold QQQ and reduce exposure.
In stay heavy on positions zones, I increase allocation using a mix of QLD and TQQQ.
** This analysis is based solely on the quantification of crowd psychology.
It does not incorporate price action, trading volume, or macroeconomic indicators.

SPY : Stay heavy on positionsSPY : Stay heavy on positions (2x leverage)
Risk-on Phase 1, high-volatility zone
Risk-on Phase 2, high-volatility zone.
Critical Sensitivity Zone
In stay light on positions zones, I hold SPY(+QQQ) and reduce exposure.
In stay heavy on positions zones, I increase allocation using a mix of SSO(+QLD) and TQQQ.
** This analysis is based solely on the quantification of crowd psychology.
It does not incorporate price action, trading volume, or macroeconomic indicators.

NASDAQ Excellent rebound on the 1D MA50. Bullish.Nasdaq (NDX) has been trading within a 6-month Channel Up and last Friday made another 1D MA50 (blue trend-line) test exactly at the bottom (Higher Lows trend-line) of the pattern, and rebounded.
This has market the last two bottoms of the Channel Up and kickstarted the Bullish Legs, which have both been at +9.59%. As you realize, this it technically the pattern's strongest Support and most optimal buy entry for the medium-term.
We expect at least another +9.59% rally on the emerging Bullish Leg, targeting 26950.
-------------------------------------------------------------------------------
** Please LIKE 👍, FOLLOW ✅, SHARE 🙌 and COMMENT ✍ if you enjoy this idea! Also share your ideas and charts in the comments section below! This is best way to keep it relevant, support us, keep the content here free and allow the idea to reach as many people as possible. **
-------------------------------------------------------------------------------
💸💸💸💸💸💸
👇 👇 👇 👇 👇 👇

META Pullback or Power Move? Technical Structure Decides🎯 META PLATFORMS INC. (NASDAQ) | THE THIEF'S PROFIT PLAYBOOK 💰
Bullish Swing Trade Setup | Supertrend + Triangular Moving Average Pullback
📊 SETUP OVERVIEW
This analysis presents a disciplined swing trading strategy on META (NASDAQ: Meta Platforms Inc.) leveraging proven technical indicators combined with strategic entry layering methodology.
Current Market Context: 🔍
Current Price: ~$625.24 (as of Nov 9, 2025)
RSI Status: Oversold Territory (<30) ⚠️
52-Week High: $796.25 | 52-Week Low: $479.80
Analyst Target: $824.02 (+32.54% potential upside) 📈
Sentiment: 44 Analysts = "Strong Buy" Rating ✅
🎬 ENTRY STRATEGY: THE LAYERING APPROACH
Rather than risking a single entry, this "Thief" methodology utilizes multiple limit order layers for optimal risk-adjusted position building:
Primary Entry Layers (Building Position Gradually):
Layer 1️⃣: $590 | Entry volume allocation: 25%
Layer 2️⃣: $600 | Entry volume allocation: 25%
Layer 3️⃣: $620 | Entry volume allocation: 25%
Layer 4️⃣: $630 | Entry volume allocation: 15%
Layer 5️⃣: $640 | Entry volume allocation: 10%
💡 Strategy Rationale: Layering captures value through market dips while maintaining capital preservation. Adjust layer counts/prices based on your risk tolerance and account size.
🛑 RISK MANAGEMENT
Stop Loss Level: $560 🛑
Represents approximately -10.4% from current price
Protects against breakdown of support structure
Triggered if key technical support fails
⚡ IMPORTANT DISCLAIMER: Stop loss placement is a personal decision based on your risk appetite. The 560 level is suggested only—manage YOUR risk YOUR way.
🎁 PROFIT TARGET
Primary Target: $730 🚀
Represents +16.8% upside potential from current levels
Aligns with resistance confluence + technical overbought signals
Incorporates trap avoidance in highly contested resistance zones
🎯 Exit Strategy Note: Take profits strategically as price approaches target. Don't get greedy—serious resistance + market structure at these levels. The $730 zone is crowded; exit positions intelligently.
⚡ DISCLAIMER: Target selection is your own. Book profits when comfortable—risk management requires personal decision-making, not blind following.
🔗 RELATED PAIRS TO WATCH (TECH SECTOR CORRELATION)
Monitor these correlated assets for confirmation signals:
📱 NASDAQ:GOOGL (Alphabet Inc.) - Tech sector bellwether; typically leads META moves in AI narrative
Correlation: Strong positive | If GOOGL struggles, META upside may be capped
Watch: Positive correlation breakouts suggest sector momentum
💻 NASDAQ:NVDA (NVIDIA Corp.) - AI chip leader; META's infrastructure partner
Correlation: Strong positive | NVDA strength = confidence in AI capex spending
Watch: NVDA drops could signal META weakness despite fundamentals
🤖 NASDAQ:MSFT (Microsoft Corp.) - Competing AI ecosystem player
Correlation: Moderate positive | Sector rotation indicator
Watch: MSFT outperformance = potential META underperformance
📊 NASDAQ:QQQ (Nasdaq-100 ETF) - Tech sector aggregate
Correlation: Very strong | META weighted ~4.7% in QQQ
Watch: If QQQ breaks down, META faces headwinds regardless of company-specific factors
🌐 NASDAQ:SMH (Semiconductors ETF) - Supply chain health indicator
Correlation: Moderate positive | AI infrastructure demand gauge
Watch: SMH weakness signals potential capex disappointment
📈 TECHNICAL ANALYSIS FRAMEWORK
✅ Supertrend Confirmation: Bullish alignment detected—uptrend structure intact
✅ Triangular Moving Average (TMA) Pullback: Price respecting key moving average zones, setting up continuation
✅ Oversold RSI: Current market conditions suggest reversal potential
✅ Support Structure: $560 level acts as psychological + technical floor
🎓 WHY THIS SETUP WORKS
Entry Discipline: Layering reduces emotional decision-making; mechanical execution improves psychology
Risk Control: Multiple entries allow tighter overall stop losses while maintaining position exposure
Technical Confirmation: Supertrend + TMA alignment = higher probability setups
Sector Tailwinds: META's $600B AI investment announcement provides fundamental support
Oversold Bounce Potential: RSI <30 historically precedes relief rallies in strong companies
⚠️ RISK FACTORS & CONSIDERATIONS
🔴 Key Risks:
Meta's aggressive capex spending concerns some investors—watch for guidance revisions
Regulatory pressure on AI/advertising practices could derail momentum
Macro headwinds (interest rates, economic data) always threaten growth narratives
Market structure at $730 is HEAVY—resistance may be tougher than expected
Position sizing matters: don't over-leverage this trade
💼 Trade Management Checkpoints:
Scale in via layering rather than going all-in
Monitor daily closes near stop loss; don't let winners turn into losers
Consider taking partial profits as price approaches resistance zones
Watch related pairs ( NASDAQ:QQQ , NASDAQ:NVDA ) for confirmation/divergence
💡 PRO TIPS FOR THIEF TRADERS
🔓 Lock in Partial Gains: At $670 level, consider closing 40% of position to secure profits
🔓 Trail Your Stop: Once price establishes above $650, move stop to breakeven to protect capital
🔓 Watch Earnings Calendar: Next catalyst could accelerate move—prepare position accordingly
🔓 Timeframe Matters: This is swing trade—target 2-4 week holding period
🔓 Keep Thesis Tight: Market conditions change—be prepared to exit if setup breaks
📌 FINAL NOTES
This analysis is provided for educational & entertainment purposes only. ✨
Every trader must make independent decisions regarding position sizing, entry levels, exit targets, and risk management. What works for one trader's account may not work for another. Test strategies on smaller positions first; respect your stops; manage your risk.
Remember: The best trade isn't always the one that makes the most money—it's the one that lets you live to trade another day.
📢 SUPPORT THE ANALYSIS
✨ If you find value in this analysis, a 👍 and 🚀 boost is much appreciated — it helps me share more setups with the community!

Nasdaq Battle between correction & innovationNASDAQ 100 (NDX)
Nasdaq 100 Index (NDX) currently sits at a crucial inflection point, defined by the overwhelming dominance of the technology sector's structural growth against a backdrop of increasing macroeconomic and technical vulnerability. After a historic rally driven by Artificial Intelligence (AI) euphoria, the market is undergoing a necessary and sharp correction, testing key support levels established during the latest bullish surge.
The Durable Foundation: AI, Earnings, and Profitability
The core bullish case for the NDX remains robust, fundamentally driven by the "Magnificent Seven" and the pervasive, non-negotiable surge in AI infrastructure spending. Unlike the speculative rallies of previous cycles, today's leaders are characterized by deep profitability, substantial cash flow, and diverse revenue streams.
Recent corporate earnings reaffirm this strength, with the technology sector posting strong double digit growth. This profitability suggests that investment in AI is being funded through internal cash flow, making the rally more sustainable than the debt fuelled expansion seen two decades ago. The long term trajectory is further supported by an accommodative Federal Reserve pivot, which is now in rate cutting mode a supportive contrast to the tightening cycle that ended the 2000 rally. The secular trend of technological innovation is accelerating, transforming AI from a growth narrative into an essential business imperative.
Macroeconomic and Sentiment Headwinds
Despite underlying corporate strength, recent market action signals a decisive sentiment shift rooted in macro uncertainty and high valuations. The index has experienced its steepest weekly decline since March, indicating heavy profit taking and a collective "reality check" among traders.
Several factors are contributing to this sentiment reversal:
1. Concentration Risk: The sheer weight of the largest components now represents an extraordinary percentage of the overall market capitalization, making the NDX acutely sensitive to volatility in just a few key names.
2. Labor Market Cooling: Data showing a significant spike in job cuts (particularly in the tech and warehousing sectors) has unsettled investors, suggesting that economic cooling is accelerating faster than anticipated.
3. Consumer Confidence: A sharp drop in consumer sentiment reflects heightened anxiety related to economic uncertainty and political instability, which historically dampens forward looking market optimism.
4. Valuation Concerns: While not at 2000 extremes, valuations remain elevated, shifting the market’s focus entirely from multiple expansion to demanding flawless execution and continuous earnings growth.
Technical Outlook: The Critical 25,000 Support Test
From a technical perspective, the NDX has been in a clear, rising trend channel over the medium to long term, confirming a persistent buy the dip mentality. However, the recent sell off has introduced significant short term caution.
The index is currently testing a non negotiable support zone around 25,000. This level is psychologically important and corresponds to a previous major breakout point. A decisive breakdown below this support could trigger a cascading sell off as automated stop loss orders are activated, potentially paving the way toward the next major supports at 24,500 and, more critically, 23,980.
Key Technical Levels:
• Immediate Support: 25,000
• Secondary Supports: 24,500, then 23,980
• Immediate Resistance: 25,200, followed by 25,500 and 25,700
Conclusion: Navigating the Volatility
Nasdaq 100 remains an index of unparalleled innovation and long term potential, yet its short term path is fraught with risk. The outlook hinges on the NDX's ability to hold the critical 25,000 support level. A bounce from this zone would confirm the resilience of the dip buyers and maintain the medium term bullish structure. Failure to hold this level, however, would signal a deeper technical correction is underway, shifting the focus to the lower support zones as the market cleanses its excessive exuberance. Traders should remain nimble, respecting the clear shift in short term momentum while maintaining conviction in the long term, secular growth of the technology giants.

Did You Buy The Dip? Heres What we bought!Today the SPX had an incredible morning selloff - met with and even more incredible rally.
The markets were in turmoil today up until the bulls stepped in and made a red to green reversal.
Days like today often create the biggest portfolio gains when you can buy stock at depressed levels.
We accumulated 6 position longs today.
Massive technicals were tested and defended today.

Nasdaq - The most important structure!💰Nasdaq ( TVC:NDQ ) perfectly respects structure:
🔎Analysis summary:
Over the course of the past couple of months, the Nasdaq has been rallying an expected +50%. Still, until the Nasdaq will retest the upper channel resistance trendline, this rally won't be over. Therefore, we can still see a rally of another +10% in the very near future.
📝Levels to watch:
$25,000 and $30,000
SwingTraderPhil
SwingTrading.Simplified. | Investing.Simplified. | #LONGTERMVISION

Nasdaq NAS100 Bulls Regain Control: What I’m Watching Next📈 On the 4-hour NASDAQ chart, we can clearly see a break in structure to the upside, signaling strong bullish momentum entering the market. 🟩 The buyers are showing strength, and I’ll be looking to capitalize on this momentum — but only if we see a confirmed break of the current swing high, followed by a retracement into the retest zone. 🔁
However, patience is key. ⏳ I’ll only look to engage if today’s New York session data release aligns with and supports the bullish bias. Fundamentals and technicals must work together before I take a position.
As mentioned in the video, if the anticipated price action fails to materialize, we’ll simply abandon this setup and move on — staying disciplined is crucial. 🚫
⚠️ Disclaimer: This analysis is for educational purposes only and not financial advice.

QQQ : Stay heavy on positionsQQQ : Stay heavy on positions (QLD, TQQQ)
Entering a risk-on, high-volatility zone.
A signal for catching a bounce has emerged.
In stay light on positions zones, I hold QQQ and reduce exposure.
In stay heavy on positions zones, I increase allocation using a mix of QLD and TQQQ.
** This analysis is based solely on the quantification of crowd psychology.
It does not incorporate price action, trading volume, or macroeconomic indicators.

SPY : Stay heavy on positionsSPY : Stay heavy on positions (2x leverage)
Entering a risk-on, high-volatility zone.
A signal for catching a bounce has emerged.
In stay light on positions zones, I hold SPY(+QQQ) and reduce exposure.
In stay heavy on positions zones, I increase allocation using a mix of SSO(+QLD) and TQQQ.
** This analysis is based solely on the quantification of crowd psychology.
It does not incorporate price action, trading volume, or macroeconomic indicators.

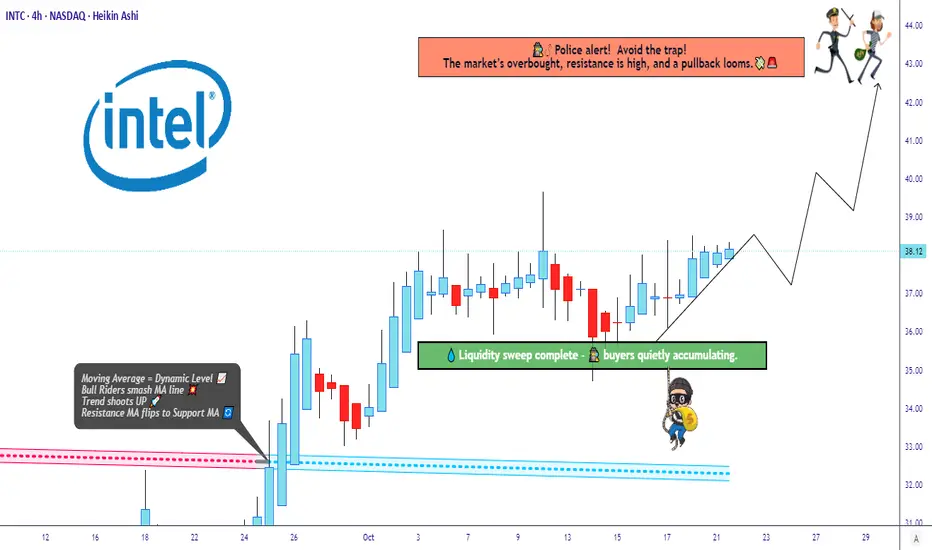
“Intel’s Bullish Structure Building Power for a Breakout Move!”🔥 INTC “Intel Corporation” – The Thief’s Profit Playbook 🕶️💰 (Swing/Day Trade Setup)
⚔️ Plan Overview – Bullish Setup with Thief Precision
The Thief Strategy is in play here — a smart layering entry method designed to steal optimal positions from impatient traders. 🕵️♂️
Our mission: Load, Layer, Loot, and Leave with Profits.
🎯 Entry Plan (Layering Method)
We’re layering multiple buy limits (thief-style) to catch value dips:
Buy Limit Layers: 35.00 💵 → 36.00 💵 → 37.00 💵
(⚙️ You can expand your layers based on your risk tolerance and style — thieves adapt fast.)
💡 Why Layer? Because a pro thief never rushes a vault — we break in step-by-step. This builds position strength while keeping entry efficiency.
🛡️ Stop Loss (Thief’s Escape Hatch)
📉 Stop Loss @34.00
💬 “Dear Ladies & Gentlemen (Thief OG’s) — I’m not recommending you set my SL. You’re the boss of your vault. Manage your own risk, grab the bag, and disappear in profits like a shadow.” 🌑💼
🚀 Target Zone (Profit Extraction Level)
🎯 Main Target: @43.00
📛 Police Barricade @44.00 — strong resistance zone + overbought region + potential bull trap.
🧠 Play it smart — escape clean with gains at 43.00 before the blue lights flash. 🚨
💬 “Dear Ladies & Gentlemen (Thief OG’s) — not recommending you follow my TP blindly. Make your own move, take your profit, and vanish like a ghost.” 👻💸
🧩 Technical Breakdown
Intel (INTC) forming a strong base accumulation near the $35–37 range.
Volume Profile shows liquidity pockets aligning with the layering zones.
RSI hovering mid-levels → room for upside before overbought conditions hit near $43–44.
EMA Confluence: Price reclaiming short-term EMA — early trend reversal signals in motion.
Fundamental Boost: Intel’s AI chip roadmap and cost-optimization headlines add bullish narrative momentum. ⚙️📈
🌍 Related Pairs to Watch (Correlation & Market Sync)
💠 NASDAQ:NVDA – Leader in AI semis; momentum correlation ~0.78 with INTC.
💠 NASDAQ:AMD – Similar sector swing potential; can mirror INTC lag-moves.
💠 NASDAQ:SMH (VanEck Semiconductor ETF) – Sector strength indicator. A breakout above resistance supports INTC’s upside.
💠 NASDAQ:QQQ / NASDAQ:NDX – Tech-heavy indices; bullish bias strengthens chip sector sentiment.
🧭 Correlation Tip: If NVDA or QQQ rallies strongly while INTC consolidates — that’s your thief’s golden signal to layer your entries quietly before the breakout sparks. ⚡
⚙️ Risk Management Wisdom
Never go all-in; layer your risk like a pro.
Keep your SL tight but mind flexible.
Respect zones — police don’t like thieves hanging around too long. 😎
✨ “If you find value in my analysis, a 👍 and 🚀 boost is much appreciated — it helps me share more setups with the community!”
📜 Disclaimer: This is a Thief-Style Trading Strategy shared for educational & fun purposes only. Not financial advice. Trade wisely — stay stealthy. 🕶️
#INTC #Intel #StockMarket #SwingTrade #DayTrading #ThiefStrategy #LayeredEntries #TechnicalAnalysis #NASDAQ #StocksToWatch #AIStocks #TradingViewCommunity #TradingViewEditorsPick #Semiconductors #NVDA #AMD #QQQ #ProfitPlaybook