S&P500 How Expensive Is It?The Average Wage Earner Needs To Work166.5 Hours To Buy One Share Of The S&P500
If this chart does not drive the point home. Nothing will.
Sometimes simple common sense is more powerful than all the fancy analysis one can buy or think of to create.
Price is what you pay, and value is what you get! Remember that my friends.
DANGER IS SCREAMING AT YOU!
NASDAQ 100 CFD

NASDAQ Three conditions met for strong BUYNasdaq is trading inside a Channel Up in 2025 and today the price reached its bottom.
At the same time it marginally crossed under the MA100 (1d), making today's low the best technical buy opportunity since January 27th.
Trading Plan:
1. Buy on the current market price.
Targets:
1. 22370 (+6.92% rise like the previous two bullish waves).
Tips:
1. The RSI (4h) got oversold on the same level as the Jan 27th low. Overall, an oversold RSI on Nasdaq's last 6 month price action, has been a great buy opportunity.
Please like, follow and comment!!

Nasdaq market analysis: 25-Feb-2025Let’s dive into today's Nasdaq market analysis. Share insights, and potentially spot opportunities for good pips.

NASDAQ 4 more months before next correction.Nasdaq (NDX) has been rising non-stop with the 1W MA50 (blue trend-line) as its Support since it first broke above it in March 13 2023, following the 2022 Inflation Crisis Bear Cycle.
This continuous period of growth has been built on a prolonger Bearish Divergence based on the 1W RSI, which has been on Lower Highs since June 05 2023. It is not the first time in recent history that the index has seen this pattern, as in the last 10 years we have had 2 periods of similar growth.
The 2014 - 2015 phase came to a sudden end in the first week of January 2016 after having marginally topped above the 4.0 Fibonacci extension. The 1W RSI Bearish Divergence eventually kicked in and the price dipped below the 1W MA100 (green trend-line), while an RSI below 40.00 formed the bottom.
Similarly, the 2018 - 2019 phase got hammered in early February 2020 after topping very close to the 4.0 Fib ext, again sharply declining below the 1W MA100, finding support exactly on the 1W MA200 (orange trend-line). We need to point out that this was a (technically) exaggerated price collapse though due to the COVID lockdowns.
As mentioned above, we are facing again an RSI Bearish Divergence and if the price action follows the previous two periods that both, amazingly enough, lasted for 742 days (106 weeks) from the first RSI High, we should be expecting a technical peak around June 23 2025 (exactly 4 months from now) near a 4.0 Fibonacci extension at 23500.
-------------------------------------------------------------------------------
** Please LIKE 👍, FOLLOW ✅, SHARE 🙌 and COMMENT ✍ if you enjoy this idea! Also share your ideas and charts in the comments section below! This is best way to keep it relevant, support us, keep the content here free and allow the idea to reach as many people as possible. **
-------------------------------------------------------------------------------
Disclosure: I am part of Trade Nation's Influencer program and receive a monthly fee for using their TradingView charts in my analysis.
💸💸💸💸💸💸
👇 👇 👇 👇 👇 👇

Nasdaq market analysis: 24-Feb-2025Let’s dive into today's Nasdaq market analysis. Share insights, and potentially spot opportunities for good pips.

NASDAQ Approaching the ultimate 4hour MA200 buy entryNasdaq / US100 is trading inside a Channel Up, which is currently on a pullback.
This correction is approaching the pattern's bottom which happens to be on the 4hour MA200. The last two such contacts have been buy opportunities.
Also the 4hour RSI is oversold at 30.00 and the last two times it was on this level, they were again buy opportunities.
Buy and target the upper Resistance at 22230.
Follow us, like the idea and leave a comment below!!

NASDAQ: Opening selloff is a buy opportunity.Nasdaq remains bullish on its 1D technical outlook (RSI = 60.351, MACD = 161.240, ADX = 29.408) despite today's selling early into the session. This indicates that relative to the bullish long term trend, this correction is a buy opportunity, especially as the index hit its 4H MA50. This happens to be at the bottom of the 20day Channel Up, a pattern potentially identical to the December 10th low of the Channel Up. We are long, expecting a new +3.80% rise (TP = 22,700).
## If you like our free content follow our profile to get more daily ideas. ##
## Comments and likes are greatly appreciated. ##

NASDAQ The 3 Phase of its Bull Cycle.Nasdaq (NDX) had a strong closing last week, rallying aggressively after cementing the 4H MA50 (blue trend-line) as Support. As the market will stay closed today on Washington's Holiday, it is a good opportunity to take the time and look at the bigger picture.
Nasdaq's whole Bull Cycle so far since the late 2022 market bottom, can be categorized into 3 separate Phases of Growth. Right now we are naturally on the 3rd and as you see, compared to the previous Phases, we are on the 2nd accumulation of the Phase. This has led on a strong rally of at least +22% that completed each Phase.
Each Phase has two such accumulations and the 2nd is what makes the Channel Up peak and then correct back to the 1D MA200 (red trend-line). Since the final accumulation rally of Phase 1 has been +25.78% and the one of Phase 2 +22.13%, we may have a -3.50% decrease rate between each Phase rally. Assuming this to be the case this time around too, we may be looking for a +18.60% rally at 24000 to complete Phase 3.
-------------------------------------------------------------------------------
** Please LIKE 👍, FOLLOW ✅, SHARE 🙌 and COMMENT ✍ if you enjoy this idea! Also share your ideas and charts in the comments section below! This is best way to keep it relevant, support us, keep the content here free and allow the idea to reach as many people as possible. **
-------------------------------------------------------------------------------
💸💸💸💸💸💸
👇 👇 👇 👇 👇 👇

NASDAQ Massive Resistance breakout targeting 23000.Nasdaq / US100 is trading inside a Channel Up, which is testing today its Resistance, the previous higher high of the pattern.
When this took place duringt the previous bullish wave, the price stayed supported by the 1day MA50 and reached the 1.618 Fibonacci extension.
Buy and target 23000.
Follow us, like the idea and leave a comment below!!

Looking for TEM at $68I'm hoping to get into Tempus. Looking for $68 maybe it'll hit post earnings. Might have missed the bus, but just wanted to share that's my entry if it hits.
Good luck!

Nasdaq market analysis: 13-Feb-2025Good morning, traders! Welcome to today's Nasdaq market analysis. Compare my price action insights with your own charts and enhance your trading skills.

NASDAQ: Ready to break out of consolidation and aim for 24,600Nasdaq is neutral on its 1D technical outlook (RSI = 54.119, MACD = 45.480, ADX = 25.617) as it is trading sideways for the last 2 months. The 2 year Channel Up is intact and such consolidation patterns have broken out aggressively in the past to the new HH. As long as the 1W MA50 is supporting, the long term bullish trend will stay intact and we can aim for a total of +43% price increase (TP = 24,600) from the last HL, a -4% drop rate from the last one.
See how our prior idea has worked out:
## If you like our free content follow our profile to get more daily ideas. ##
## Comments and likes are greatly appreciated. ##

Nasdaq trading insights: 12-Feb-2025Nasdaq trading insights: Not signals, but informative zones to aid your decision-making. Please note: These zones are not trading advice. Use them as a starting point for your own analysis.

Nasdaq market analysis: 11-Feb-2025Good morning. Welcome to today's Nasdaq market analysis and educational insights for price action traders.

NASDAQ repeating the 2021 and 2019 rallies.Nasdaq (NDX) is about to complete a Cup and Handle (C&H) pattern. The whole sequence since the August 22 2024 High appears to be very similar with the price action that preceded the 2021 and 2019 C&H patterns.
As you can see, both of those pattern had an identical trend towards them and equally rally after them, which targeted the 2.618 Fibonacci extension.
If the current C&H is completed on the 4H MA200 (orange trend-line), it is reasonable to expect to continue to repeat those past patterns. As long as the 20600 Low doesn't break, we expect a June rally to 24650 at least.
-------------------------------------------------------------------------------
** Please LIKE 👍, FOLLOW ✅, SHARE 🙌 and COMMENT ✍ if you enjoy this idea! Also share your ideas and charts in the comments section below! This is best way to keep it relevant, support us, keep the content here free and allow the idea to reach as many people as possible. **
-------------------------------------------------------------------------------
💸💸💸💸💸💸
👇 👇 👇 👇 👇 👇

Nasdaq Industrial Bull Run Getting Ready!Basically we're just over the previous highs consolidating for the next big move up.
Industrials include retailers like Amazon and Costco and Electric vehicle companies Tesla and Rivian.
Good luck and stay bullish!

SPX WEEKLY PRICE ACTION 10TH FEB 2025This is the price action of SPX at its very best & exclusively for viewers on trading view.
I have discussed in depth price action of SPX and if you have any doubts feel free to leave a message or your comments below.

Risks are Bubbling in the Nasdaq-100The Nasdaq-100 has led this cycle, driven by U.S. economic resilience and an unprecedented investment surge in artificial intelligence and cloud infrastructure.
However, risks are emerging from overvaluation, excessive AI spending that has yet to translate into revenue, and geopolitical uncertainties tied to the Trump administration.
With the Nasdaq-100 trading below its all-time high and lacking sufficient catalysts for a breakout, a near-term correction could occur if these risks materialize. Investors may consider a short position to capitalize on this potential downturn.
AI Spending and Overvaluation Risks
The "Magnificent Seven"—Apple, Microsoft, Nvidia, Amazon, Alphabet, Meta, and Tesla—have dominated market sentiment, collectively accounting for approximately 63% of the Nasdaq-100's total market cap. This highlights the rally's extreme concentration.
Much of the momentum has been driven by high expectations for rapid growth in artificial intelligence, further amplifying the market's reliance on these key players.
The broader backdrop has also been supportive: US economic growth continues to surprise to the upside, with growth expected at 2.3% for the year, while corporate earnings—even more so for tech—are likely to rise 7-14%, as per multiple analyst outlooks.
However, recent earnings reports have injected caution into AI enthusiasm. Alphabet missed revenue forecasts, sending its stock down 7.3%, while AMD dropped 6.3% after weak data-center sales. Amazon's AWS posted $28.79B in revenue, just shy of the $28.84B estimate, raising concerns over AI over-spending.
Despite this, AI capex remains aggressive. Meta reaffirmed its $60-65B 2025 capex plan, despite $17B in Metaverse losses last year. Microsoft defended its Azure and OpenAI bets, while Alphabet, despite AI competition pressures , is committing $75B to AI infrastructure in 2025.
With ambitions and excitement all around, the market’s reaction toward these companies, in light of underwhelming earnings and efficient competition from China, has not been so forgiving.
Cracks are forming, and a more cautious approach to Nasdaq-100 exposure may be warranted.
Valuations are stretched, with the index’s forward P/E ratio at 34 , up from 28 in 2023. While the AI boom, particularly in consumer adoption, took off in early 2023, the market is now pricing in near-flawless execution—yet investors have yet to fully grapple with the rising costs, intensifying competition, and looming regulatory scrutiny.
Risks remain in some of the largest Nasdaq-100 stocks, particularly Nvidia and Tesla. Nvidia’s price-to-earnings (P/E) ratio of 50.7 raises concerns about its ability to sustain past explosive growth. Similarly, Tesla, with a P/E ratio of 183.6, faces headwinds from a slowdown in the EV industry, making its valuation increasingly vulnerable.
Political and Trade Uncertainty
Donald Trump’s return to the White House has generated significant energy and excitement. However, the extremity of his policies could create new trade uncertainties, particularly for companies dependent on Chinese supply chains and international revenue.
Since his inauguration, Trump has announced a series of tariffs against major trading partners. The risk of retaliatory measures raises the possibility of a full-blown trade war. His aggressive stance on trade could introduce sudden and unpredictable market volatility.
The previous trade war saw tariffs disrupt global tech supply chains and put pressure on corporate margins. For instance, in 2018-2019 Nasdaq-100 volatility spiked and tech earnings growth slowed.
If history repeats itself, the overextended valuations of Nasdaq-100 could probably get a reality check, particularly if these firms start guiding for higher costs in upcoming earnings calls.
Technicals Point to Upcoming Resistance
The moving averages for the Nasdaq-100 reflect a bullish sentiment owing to the strong rally for the past several months.
However, the ATH level of 22,100 has proven strong resistance with prices testing this level multiple times over the past few months. A strong catalyst may be required to pass this level.
During previous corrections, price has reached between the 50-day and 100-day simple moving average (SMA).
Momentum indicators suggest that a short-term downward trend may be imminent.
Periodic movements in the index suggest a downturn is imminent and prices may reach as far as the S1 pivot point at 20,700.
Options Signal Growing Bearish Sentiment
Options positioning on E-mini Nasdaq-100 futures and Micro E-mini Nasdaq-100 futures signals a bearish sentiment. OI and volume put/call ratio for both E-mini NQ and Micro E-mini NQ are greater than 1 suggesting higher put positioning than call. There is a particualrly high concentration of puts at the March expiry.
Source: CME QuikStrike
Hypothetical Trade Setup
Given the frothing risk factors impacting the Nasdaq-100, risk of a sharp decline is high. Elevated valuations, escalating trade tensions, and slowing AI rally, all risk a correction in the index.
This decline may materialize in the next 2–3 weeks, aligning with critical macroeconomic events, including Federal Reserve announcements, inflation data releases, and upcoming corporate earnings reports.
With a correction likely, investors can express this view using a short position in Micro E-mini Nasdaq 100 (MNQ) futures expiring in March (MNQH2025). Each contract requires initial margin of USD 2,303 as of 10/Feb and provides exposure to USD 2 x Nasdaq index (~43,400).
Investors can also use the standard E-mini NQ futures to express the same bearish view with larger notional sizes.
Entry: 21,700
Target: 21,200
Stop Loss: 22,100
Profit at Target: USD 1000 ((21,700-21,200) x 2)
Loss at Stop: USD 800 ((21,700-22,100) x 2)
Reward to Risk: 1.25x
CME Group lists a raft of products covering a range of asset classes more accessible while also enabling granular hedging for portfolio managers.
Portfolio managers can learn more on how to access these micro products by visiting CME Micro Products page on CME portal to discover micro-sized contracts to gain macro exposures.
TradingView has launched The Leap trading competition starting today. New and upcoming traders can hone and refine their trading skills, test their trading strategies, and feel the thrill of futures trading with a vibrant global community through this paper trading competition sponsored by CME Group using virtual money and real time prices. Click here to learn more.
MARKET DATA
CME Real-time Market Data helps identify trading set-ups and express market views better. If you have futures in your trading portfolio, you can check out on CME Group data plans available that suit your trading needs tradingview.com/cme .
DISCLAIMER
This case study is for educational purposes only and does not constitute investment recommendations or advice. Nor are they used to promote any specific products, or services.
Trading or investment ideas cited here are for illustration only, as an integral part of a case study to demonstrate the fundamental concepts in risk management or trading under the market scenarios being discussed. Please read the FULL DISCLAIMER the link to which is provided in our profile description.

NASDAQ ShortBased on the previous analysis, I am still bearish biased and my entry might be based around the 4H Order / Breaker lock at around 21730.
If it respects it, then we will be on a bearish run. If not, we might look for a buy setup towards the All Time High

Nasdaq market analysis: 10-Feb-2025Good morning Dear Traders! Join me for the first Nasdaq market analysis for the week. Share your charts, ask questions, and let's discuss trading strategies.

NASDAQ Triangle rejected at the top. Bearish until broken.Nasdaq is trading inside a Triangle pattern, which rejected the price on its top today.
As long as it holds, it is more likely to see a decline towards the 0.786 like both prior bearish legs.
A cross above the Triangle though, will be a bullish break out targeting the 2.0 Fibonacci extension.
Trading Plan:
1. Sell on the current market price.
2. Buy if the price crosses above the top of the Triangle.
Targets:
1. 21050 (Fib 0.786).
2. 22900 (Fib 2.0 extension).
Tips:
1. The RSI (4h) is testing its Rising Support trendline. A break confirms the bearish signal. A rebound, raises the chances of a Triangle break out.
Please like, follow and comment!!

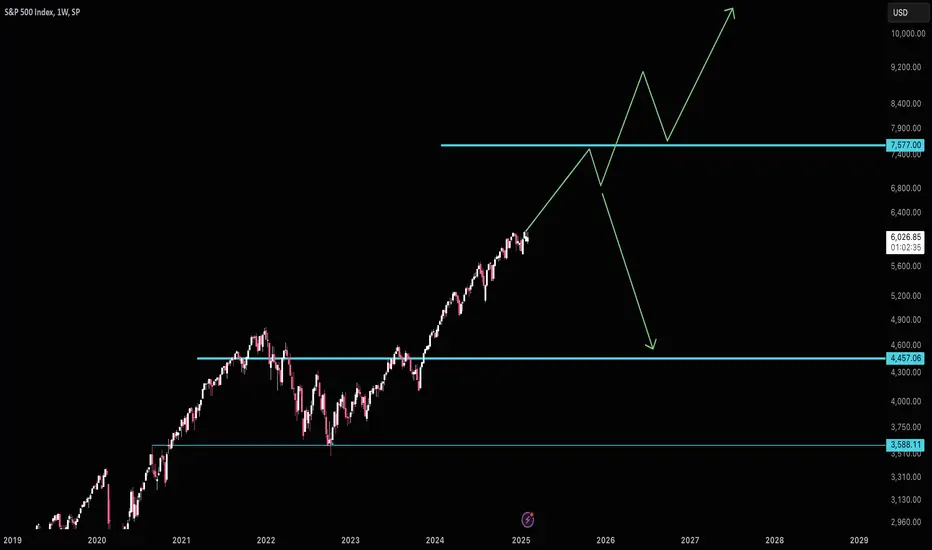
S&P500 still has room to run to 7580S&P500 resistance is likely up near 7580. Expect a pullback and then new highs. Depending on the state of the economy we could have a larger recession. Or if all is good it'll be the next area for support. Just take caution when it gets there.
Good luck!
Nasdaq market analysisGood morning Dear Traders! Join me for the last Nasdaq market analysis for the week. Share your charts, ask questions, and let's discuss trading strategies.
