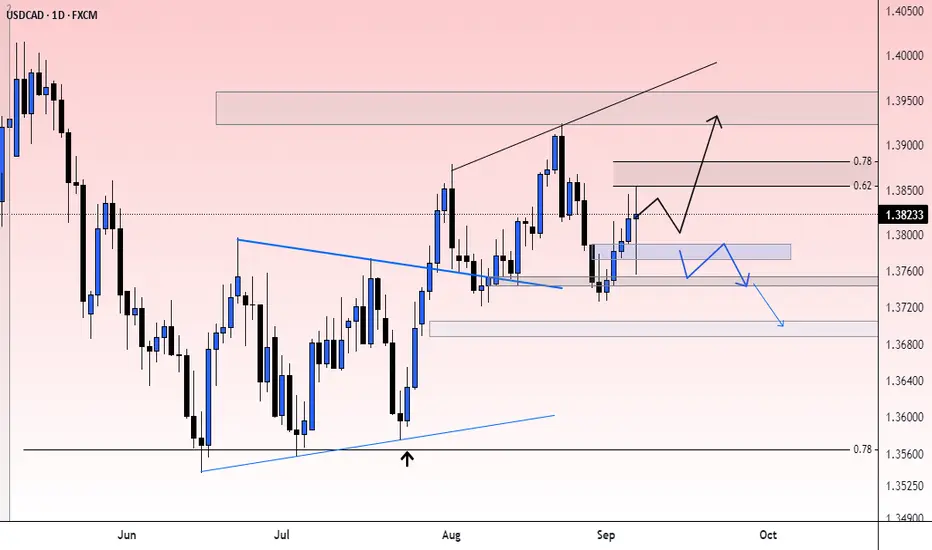
possibility of uptrendThe price is expected to break through the resistance trend line and advance to the specified resistance area. Then the continuation of the upward trend will be likely.
If the price breaks through the support area, the continuation of the downward trend will be likely.
Neo Wave

possibility of uptrend The price is expected to break through the resistance area and then continue the upward trend. Otherwise, the continuation of the correction to the specified support area will be possible.

Elliott Wave Analysis: Balkrishna Industries LimitedHello friends,
Welcome to RK_Chaarts,
We're analyzing the chart of Balkrishna Industries Limited from the perspective of Elliott Waves.
Here's what we've observed: we've completed Primary Degree Wave ((3)) in Black at the peak of August 2024. Following that, we've witnessed a complete bearish and sideways movement, culminating in the low of April 7, 2025, which marks the end of Primary Degree Wave ((4)) in Black.
We've now initiated Wave ((5)) in Black, which should unfold as five Intermediate Degree subdivisions (1) to (5) in Blue. Furthermore, within Wave (1), we should see 1,2,3,4,& 5 Minor Degree subdivisions in Red. As we can see, we've marked Red Wave 1 as complete, and Red Wave 2 is almost complete.
According to Elliott Wave Theory, Wave 2 has retraced less than 100% of Wave 1, which is a valid point. Our invalidation level will be the low of Wave ((4)) in Black at 2150.
Since April 7, the price has made an impulsive move upwards, forming a high on May 9, 2025. We've labeled this as Minor Degree Wave 1 (in red). Within Wave 1, we've identified a lower degree, Minute Degree (in black), with subdivisions ((i))-((ii))-((iii))-((iv)) & ((v)).
Following Wave 1, a corrective move has unfolded in a 3-3-5 structure, specifically a flat correction. We've labeled this as Wave 2. If the price doesn't break below the low of Wave ((4)) (2150), and instead forms a higher high, it will increase the likelihood that our wave count is correct. However, if the price makes a lower low, it will introduce a doubtful scenario.
We've observed that Primary Degree Wave ((3)) in Black, which we identified at the top, has led to a corrective fall in Wave ((4)) in Black. Within Wave ((4)), we've labeled an Intermediate Degree (W)(X)(Y) correction (in blue) with subdivisions. This can be classified as a Double Three pattern.
Furthermore, within the (W) correction, we've identified another Minor Degree WXY pattern, and within the (X) wave, another WXY pattern. The (Y) wave has an ABC minor pattern. Additionally, we've noticed a slanting resistance trend line, which has been broken with the arrival of Wave 1.
Given the significant decline in price, market sentiments have likely contributed to the unfolding corrective structure. If the price forms a higher high, it will increase the likelihood that our potential Elliott Wave count is correct.
Elliott Wave analysis is always like solving a puzzle, requiring us to unfold the structure and make educated guesses about the emerging pattern. If the price breaks below the Wave ((4)) low 2150, our wave count will likely change. Until the price remains above this invalidation level, we'll continue to follow this wave count. If the price crosses the Wave 1 high, we'll have full confidence in this wave count.
In this study, we've applied Elliott wave theoretical structures to identify a potential scenario. However, markets can be unpredictable and may surprise us at any time, leading to new scenarios emerging.
The information, chart, and study shared in this post are solely for educational purposes. Our goal is to demonstrate how we plot market movements and make informed forecasting about future trends using Elliott Wave theory. If our predictions prove accurate, we can refine our wave counts accordingly. Conversely, if our predictions are incorrect, we will need to adjust our wave counts.
Please note that this analysis is not investment advice, and you should always consult with a financial expert before making any investment decisions.
I am not Sebi registered analyst. My studies are for educational purpose only.
Please Consult your financial advisor before trading or investing.
I am not responsible for any kinds of your profits and your losses.
Most investors treat trading as a hobby because they have a full-time job doing something else.
However, If you treat trading like a business, it will pay you like a business.
If you treat like a hobby, hobbies don't pay, they cost you...!
Hope this post is helpful to community
Thanks
RK💕
Disclaimer and Risk Warning.
The analysis and discussion provided on in.tradingview.com is intended for educational purposes only and should not be relied upon for trading decisions. RK_Chaarts is not an investment adviser and the information provided here should not be taken as professional investment advice. Before buying or selling any investments, securities, or precious metals, it is recommended that you conduct your own due diligence. RK_Chaarts does not share in your profits and will not take responsibility for any losses you may incur. So Please Consult your financial advisor before trading or investing.

correction If the index breaks through the current support level, it can advance to the next support level. Then there is a possibility of a trend change or a continuation of the downward trend.

uptrend Given the recent upward wave, the upward trend is expected to advance to the 100% level. Then, considering the price behavior in the resistance range, possible scenarios have been identified.

possibility of uptrend It is expected that after some resistance levels will be broken and we will witness the start of the upward trend. If the support range is broken, the correction and fluctuation trend will continue.
check the trend It is expected that after the amount of correction and fluctuation, a trend change will take place in the current support range and we will witness the start of the upward trend. The breakdown of the resistance range will be a confirmation of the upward trend.

possibility of uptrend Considering the price behavior within the current support trend line, possible scenarios have been identified. The resistance area is expected to be broken and we will see the start of the upward trend.

check the trend The price is expected to break the resistance area, then the start of the upward trend will be likely.
Otherwise, the correction trend will continue to the specified support area.

correction The correction trend is expected to advance to the support area. Then a trend change will form and we will see the start of the upward trend. The break of the resistance trend line will be a confirmation of the upward trend.

uptrend As long as the index fluctuates above the support range and the support trend line, the continuation of the upward trend to the specified targets is likely. If the support range is broken, the continuation of the corrective and downward trend is possible.

possibility of uptrend The price is expected to fluctuate above the current support range and then we will see the beginning of the upward trend. If the support range is broken, the continuation of the downward trend is likely.

check the trend Considering the price behavior in the current resistance range, possible scenarios have been identified. It is expected that the upward trend will continue.

Douglas Elliman (DOUG) – NeoWave Structural OutlookThis chart presents a NeoWave structural interpretation of DOUG, combining the higher-degree schematic (left) with the real market data (right).
On the 6-month structural model (left panel), we label the decline as (W), followed by an intervening (X), and now developing into a potential (Y) = upsloping contracting triangle.
On the daily chart (right panel), starting from the end of wave (X), price action subdivides into a five-legged contracting triangle: A–B–C–D–E.
The upper boundary is flat, repeatedly tested by waves B and D.
The lower boundary is rising, defined by waves A, C, and E.
Wave B is the most violent, while E is smaller in price but longer in time – acceptable under NeoWave guidelines.
Implications:
If the labeling is correct, this triangle represents wave (Y).
Upon completion, two scenarios are possible:
Continuation – If the larger pattern is a W–X–Y, the triangle could be the terminal corrective structure, followed by a strong breakout.
Extension – If the correction is not yet complete, the triangle as (Y) could be followed by another X–Z to form a full W–X–Y–X–Z complex.
👉 Key Level: If price breaks out of the triangle to the upside and holds above 3.00, this would strongly suggest the start of a new trend or the beginning of another upward (X) wave.
👉 Target Projection: Based on the triangle’s height (B–C range = 2.60–1.48 ≈ 1.12), the potential upside target lies near 4.10–4.15.

HUSDT Analysis (4H)This coin, after completing a bullish wave in the form of a WXY, has entered a corrective phase from the point where we placed the red arrow on the chart.
This phase appears to be a Diametric, and we are currently in wave F of this Diametric.
It is expected that wave G will soon be completed, pushing the price toward the green lines, which mark our entry zone for a buy/long position.
In the green zone, we are looking for a buy/long position. If you are considering a sell/short position, the red-marked box is suggested.
Targets are marked on the chart.
A daily candle close below the invalidation level will invalidate this analysis.
For risk management, please don't forget stop loss and capital management
When we reach the first target, save some profit and then change the stop to entry
Comment if you have any questions
Thank You

EIGEN Analysis (8H)The price seems to be in the corrective wave B, likely in the final corrective sub-wave of the larger wave B. From the green zone | which is a flip zone overlapping with the trendline | we expect a rejection to the upside, initiating wave C.
We are looking for buying opportunities around the green zone.
The targets are marked on the chart.
A daily candle closing below the invalidation level would nullify this analysis.
For risk management, please don't forget stop loss and capital management
When we reach the first target, save some profit and then change the stop to entry
Comment if you have any questions
Thank You

PLAY Analysis (4H)It seems that the price is currently completing wave g of B. After this wave is completed, we can expect an upward move. The best area for wave g to complete is around the green lines marked on the chart, which represent our entry zones.
Please note that due to the high volatility of this coin, this setup is suitable for the spot market only, not futures
The targets are marked on the chart. A daily candle close below the invalidation level will invalidate this analysis.
For risk management, please don't forget stop loss and capital management
When we reach the first target, save some profit and then change the stop to entry
Comment if you have any questions
Thank You

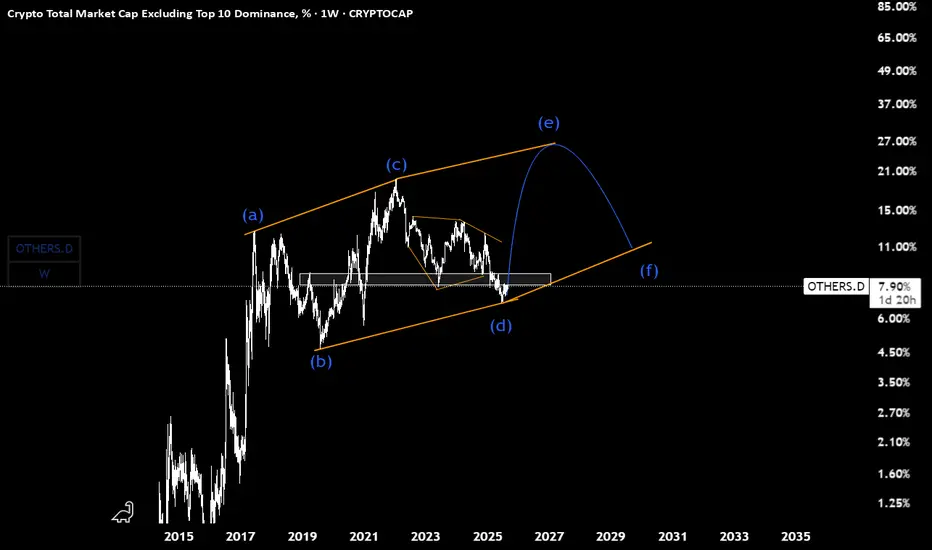
Others.D(based on NEo wave)there is 2 ways for wave E
its E of diametric or E of triangle.
we should wait for it but triangle makes a sharper wave E.
confirmation is breaking the white box on W timeframe.
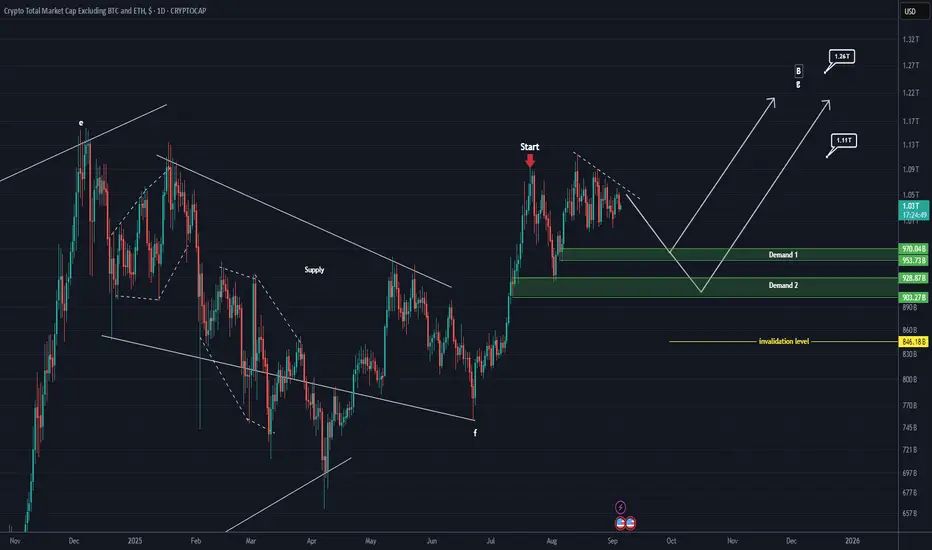
TOTAL 3 New Update (1D)As you know, capital first flows into Bitcoin, then into Ethereum, and afterward into other altcoins. This index serves as a good indicator to understand when altcoins, apart from Ethereum, will turn bullish.
It seems that one more corrective wave remains in this index, which could complete within one of the green zones. After that, we expect to see another bullish wave.
The targets are marked on the chart.
A daily candle close below the invalidation level will nullify this analysis.
For risk management, please don't forget stop loss and capital management
When we reach the first target, save some profit and then change the stop to entry
Comment if you have any questions
Thank You
ADA Buy/Long Setup (1D)Cardano, in our view, is currently within a major bullish structure, with wave D having just completed.
It now appears that the price is inside bullish wave E.
We have identified two specific entry levels for re-entering Cardano. At each entry level, you can take one step into a buy position.
The target is around \$1.20.
Please note that this analysis is based on the daily timeframe, so it may take some time to play out.
The invalidation level is the same as our stop loss. If this level is reached, the setup will be invalidated.
For risk management, please don't forget stop loss and capital management
Comment if you have any questions
Thank You

SANTOS ANALYSIS (1D)Football-related tokens in the crypto market have been quiet for a while and seem to be dormant. One of the tokens that shows good inflow during its moves is SANTOS.
SANTOS appears to be forming a symmetrical triangle and is currently at the end of wave E. While there are multiple wave count scenarios for this token, it is sitting on a strong support zone.
As long as it holds the green zone, it has the potential to move toward the targets.
However, a daily candle closing below the invalidation level will invalidate this analysis.
For risk management, please don't forget stop loss and capital management
When we reach the first target, save some profit and then change the stop to entry
Comment if you have any questions
Thank You

NIL Looks Bearish (12H)Based on the signals we see on the chart, it seems that NIL has entered another bearish wave.
According to the chart, this symbol appears to be within a diametric pattern and has just entered wave E, which itself is a bearish wave.
If the price makes a pullback to the red zone, it would present a good opportunity for sell/short positions.
This outlook would only be invalidated if a daily candle closes above the invalidation level.
For risk management, please don't forget stop loss and capital management
When we reach the first target, save some profit and then change the stop to entry
Comment if you have any questions
Thank You

correction It is expected that a trend change will form within the current support range and we will witness the beginning of an upward trend. If the 78.6% level is broken, the downward trend will continue to the specified support ranges.
