Let's learn & Apply Elliott Wave Rules on chart: BTCUSD BitcoinHello Friends,
Welcome to RK_Chaarts,
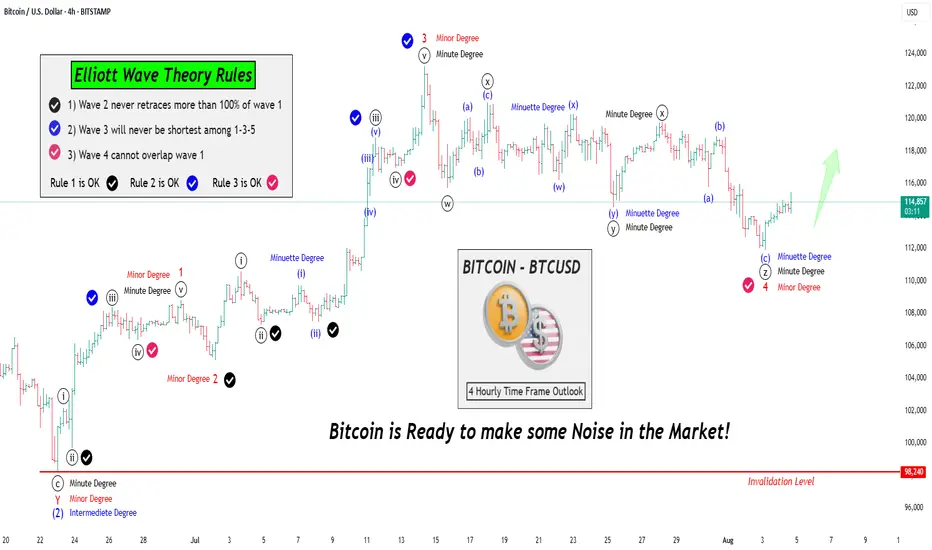
Friends, Today we are going to learn 3 Rules of the Elliott Wave theory, there are three principles and some patterns. Impulses move in a 1-2-3-4-5 pattern, either as an impulse or a motive wave. However, within impulses, there are three rules:
Rule No 1:
Wave 2 will never retrace more than 100% of Wave 1.
Rule No 2:
Wave 3 will never be the shortest among Waves 1, 3, and 5; it can be the largest, but never the smallest.
Rule No 3:
Wave 4 cannot overlap Wave 1, except in diagonals or triangles; in impulses, it cannot overlap.
We've checked these three rules and marked them with separate tick marks on the chart with different colors, making them clearly visible. You can review the chart and verify these rules yourself, learning how wave principles are applied and checked.
We've explained all this through a drawing on the chart, so we won't elaborate further here. Moving forward, let's analyze what the wave theory suggests about the current market trend. This entire analysis is shared for Educational purposes only.
I hope you'll consider this educational post as a learning resource, Definitely, I encourage you to review the chart as an image or picture to better understand the concepts we've worked hard to explain.
Our effort will be successful if you gain a deeper understanding and learn something new from this post. If you find this helpful and informative, our hard work will have paid off. Please keep this in mind as you review the material.
Now let's explore how wave counts within wave counts, or lower degrees within higher degrees, unfold through complete wave theory patterns and following theory Rules all the times.
Let's take a closer look at the Bitcoin chart we've analyzed using Elliott Waves. From this perspective, it's clear that the Intermediate Degree Wave (2) concluded around June 23rd.
After this, we observe that the internal wave counts of the lower degree, specifically Wave 1-2-3 (in red) have completed their cycle of Minor degree. Furthermore, Red Wave 4 of same Minor degree has been moving sideways, characterized by a downward trend.
Notably, the fall of Red Wave 4 is classified as a Minor Degree movement. Interestingly, this downward movement appears to have terminated in an even lower degree, namely the Minute Degree, which we've marked in black as ((w))-((x))-((y))-((xx))-((z)) that means Wave 4 of Minor degree (in Red) is complete.
Given that Red Wave 4 Minor has reached its conclusion, it's highly plausible that Wave 5 has initiated. This development suggests that Bitcoin is poised to make a significant move.
Moving on to the analysis, we observe that:
- Rule 1: Wave 2 has not retraced more than 100% of Wave 1, so this rule is intact.
- Rule 2: Wave 3 is not the shortest among Waves 1, 3, and 5, so this rule is also valid.
- Rule 3: Wave 4 does not overlap Wave 1, so this rule is also satisfied.
Bitcoin is all set to shake things up! We eagerly anticipate further rallies in the market.
This post is shared purely for educational purpose & it’s Not a trading advice.
I am not Sebi registered analyst.
My studies are for educational purpose only.
Please Consult your financial advisor before trading or investing.
I am not responsible for any kinds of your profits and your losses.
Most investors treat trading as a hobby because they have a full-time job doing something else.
However, If you treat trading like a business, it will pay you like a business.
If you treat like a hobby, hobbies don't pay, they cost you...!
Hope this post is helpful to community
Thanks
RK💕
Disclaimer and Risk Warning.
The analysis and discussion provided on in.tradingview.com is intended for educational purposes only and should not be relied upon for trading decisions. RK_Chaarts is not an investment adviser and the information provided here should not be taken as professional investment advice. Before buying or selling any investments, securities, or precious metals, it is recommended that you conduct your own due diligence. RK_Chaarts does not share in your profits and will not take responsibility for any losses you may incur. So Please Consult your financial advisor before trading or investing.
Neo Wave
ETH Looks Bearish (3D)Ethereum approached the weekly trendline and experienced a correction. It seems likely that we may see one more push upward to create a false bullish sentiment on this coin. There is even a possibility of a fake breakout above the descending trendline. However, before any major move, a significant correction toward the green zone appears likely | after which the main bullish move is expected to occur.
On higher timeframes, this is currently our outlook on Ethereum.
A daily candle closing above or below the invalidation levels would negate the current buy or sell bias.
For risk management, please don't forget stop loss and capital management
Comment if you have any questions
Thank You

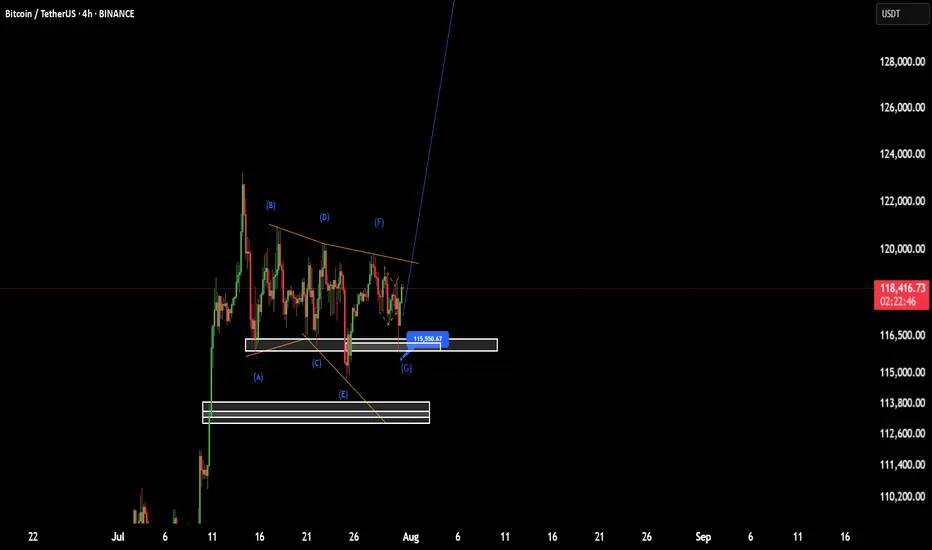
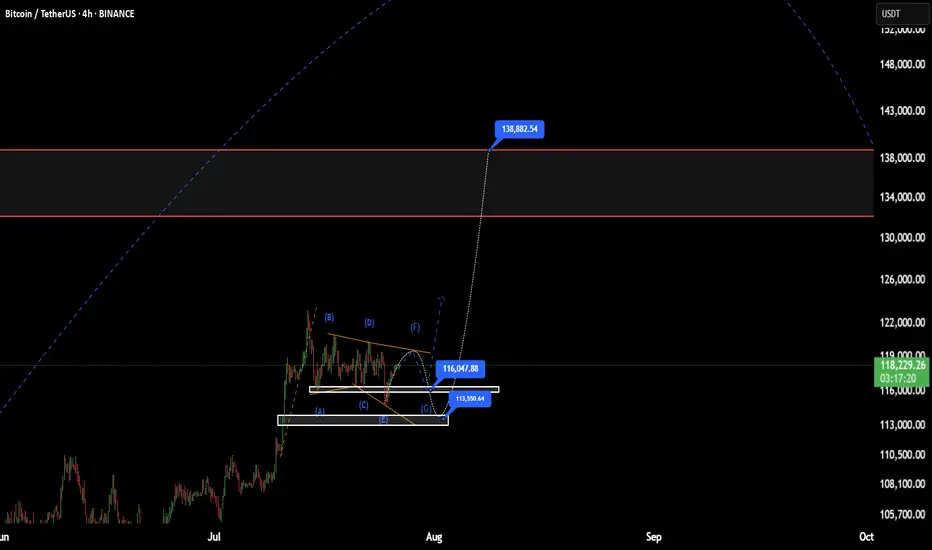
BTC(based on NEo wave)I think wave G is finished and soon it will pump to 138K.
stop loss is 115500.
attention:138K is the first target of these bullish waves.
Get Ready to Sell...I'm expecting another swing high (probably by FOMC upcoming statement) just before a an almost 80% drop!
Get ready to sell your PEPE and other crypto before the huge drop.
YOU HAVE BEEN WARNED !!!

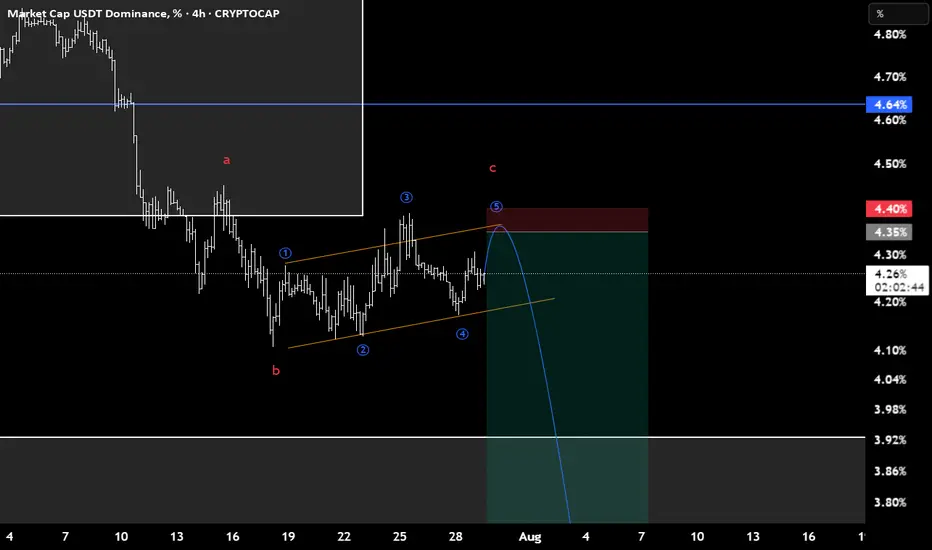
USDT.D(based on NEo wave)I consider this branch as a flat and c wave is the terminal with 3rd extended.
stop loss is 4.4.
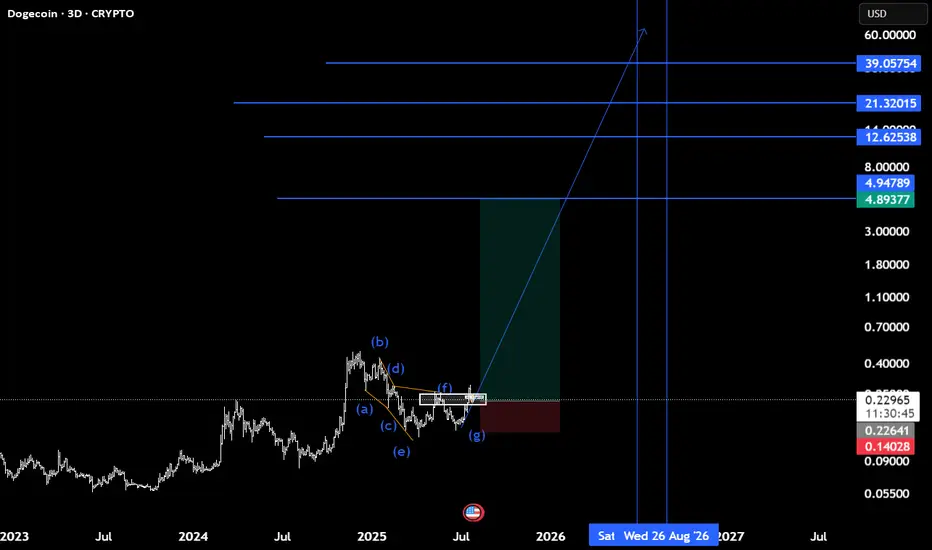
Doge(based on NEo wave)confirmation of finishing the E wave of triangle is here now.
it takes about 400 days for all targets to pass.
see the related last chart of doge.
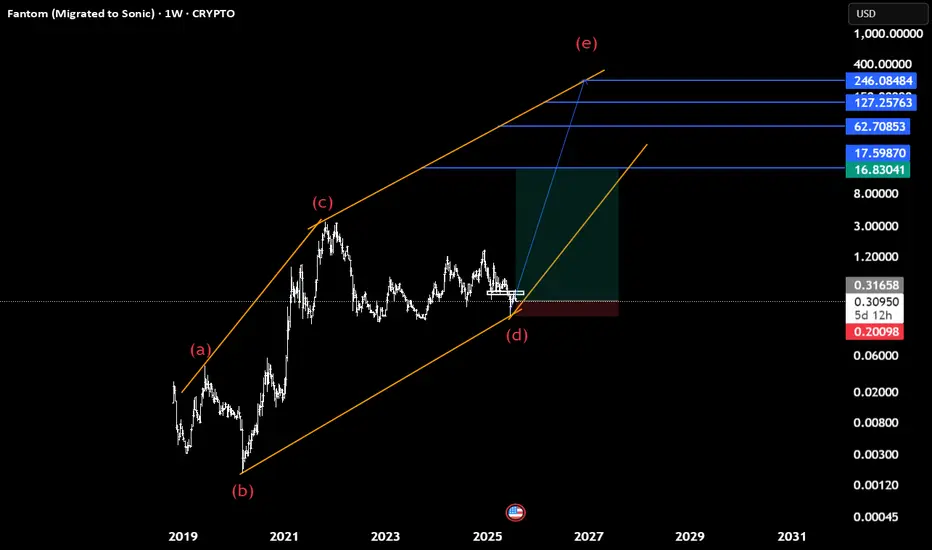
Sonic(based on NEo wave)Soon Sonic will start heavy bullish waves to the targets which shown with blue lines.
95% it is a diamnod diametric and we cant consider this as descending triangle because there is no overlap between wave d and a.
Possibility of uptrend As long as the indicator is above the green resistance zone and the resistance trend line is not consolidated, the continuation of the downtrend is likely. If the strong indicator breaks through the mentioned resistance zone, a long-term uptrend will be formed.
Correction It is expected that the price will consolidate below the trend line and continue the downtrend to the specified support levels. In this case, a three-wave pattern will form.
Check the trend Given that there is a possibility of a triangle pattern forming, it is expected that the price will change direction at the current resistance level and a downtrend will begin. If the price consolidates above the green resistance level, the uptrend will likely continue.

Correction It is expected that the downtrend will continue to form until the specified support levels. Then there is a possibility of a trend change and the start of an uptrend. If the price breaks through the support area, the downtrend will continue to the next support area.

Possibility of correction As long as the price fluctuates above the support trend line, the continuation of the uptrend is likely. If the price crosses the support trend line, it will be a confirmation of the downtrend and the start of a downtrend or correction is likely.
Downtrend If the price can break through the support trend line, a continuation of the downtrend to the support levels is likely. Otherwise, an uptrend is possible with consolidation above the support level.

Check the trend Given the price behavior within the current resistance range, possible scenarios have been identified. It is expected that after some volatility and correction, we will see a continuation of the upward trend.

Possibility of uptrend The uptrend is expected to move in the specified direction and advance to the specified targets. If the indicator does not consolidate above the current resistance level, there is a possibility of a double-digit combination pattern. Then a correction is likely.
correction The corrective pattern is expected to move along the specified path and, after reaching the time frame, a trend change is expected to occur.

Check the trend A triangle pattern is expected to form within the current support range. Then the start of an uptrend is likely. If the price breaks through the 78.6% level, a continuation of the correction and downtrend is possible.

B3 Analysis (12H)From the point where the red arrow is placed on the chart, the B3 correction has started. It appears we have an expanding/diagonal/symmetrical triangle, and wave E now seems to be complete.
As long as the green zone holds, the price could move toward the red box, which is a swap zone.
A daily candle closing below the invalidation level will invalidate this analysis.
For risk management, please don't forget stop loss and capital management
Comment if you have any questions
Thank You

ARC Buy/Lonf Setup (1D)The ARC symbol, after completing a triangle and undergoing significant price and time correction, is approaching a strong and important origin.
It is expected that upon reaching the green zone, it will move toward the specified targets.
Since trading this symbol carries its own risks, make sure to practice proper risk management.
The targets are marked on the chart.
A daily candle closing below the invalidation level will invalidate this analysis.
For risk management, please don't forget stop loss and capital management
When we reach the first target, save some profit and then change the stop to entry
Comment if you have any questions
Thank You

GOAT Looks Bullish (12H)It seems that a wave A of a higher-degree structure has completed, and the price is forming a triangle at the bottom, preparing for an upward movement in the form of either a wave B or a new impulse wave. Since this wave belongs to a higher degree, we expect the upcoming bullish wave to take time and show a significant upward retracement.
Try to avoid entering during pumps, and instead focus on entries during price corrections.
As long as the green zone holds, the price has the potential to move upward.
A daily candle closing below the invalidation level will invalidate this outlook.
For risk management, please don't forget stop loss and capital management
When we reach the first target, save some profit and then change the stop to entry
Comment if you have any questions
Thank You

ALCH Looks Bearish (8H)ALCH is one of the altcoins that began its bullish rally earlier than others.
From the point where we placed the green arrow on the chart, it appears that an ABC correction has completed.
As long as the red box is maintained, price may move toward the FVG zone.
Targets are marked on the chart.
Additionally, a liquidity pool is forming below the candles, which is expected to be swept soon
A daily candle closing above the invalidation level would invalidate this bearish outlook.
For risk management, please don't forget stop loss and capital management
Comment if you have any questions
Thank You

BTC(based on NEo wave)This range price is shown as a bow-tie diametrical.
I think G wave will end at one of those prices, 113 or 116
after this it will start a good bullish wave.
stop loss is 110K and the first target is 138K.
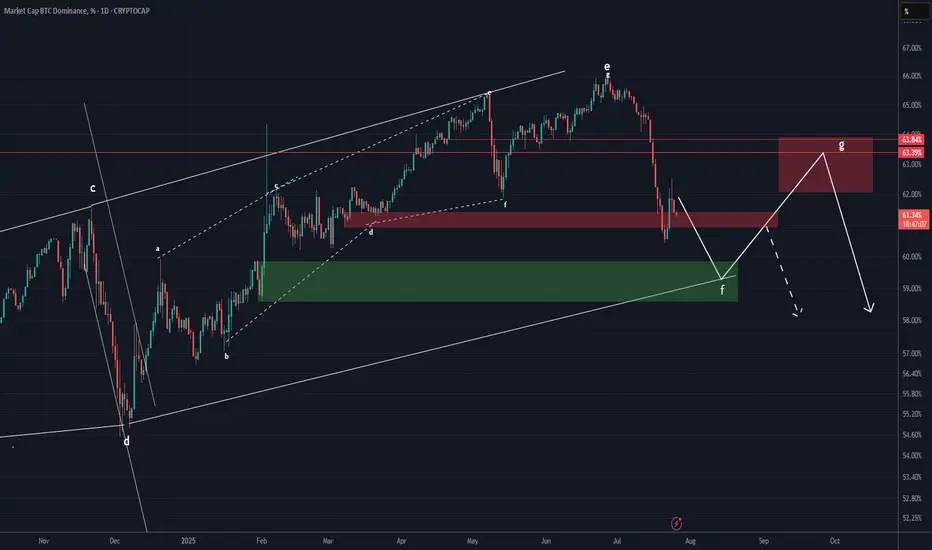
BTC DOMINANCE Update (1D)It seems that Bitcoin dominance may soon experience upward corrections, as it has broken through several support zones to the downside without any reaction and is now close to another support area. Usually, when the market maker pushes the price through multiple supports without a reaction, the price can retrace from a nearby support.
The price may soon move to complete wave G.
We have considered two different scenarios for the fluctuations of this index. However, note that this chart is a derivative chart, and the fluctuations may not follow the schematic exactly, but this analysis gives us a good view of the support and resistance zones and the probable path.
For risk management, please don't forget stop loss and capital management
Comment if you have any questions
Thank You