Ethereum Has Resumed Its Bearish Cycle Once Again (12H)As you can see, a bearish phase has begun from the point marked with the green arrow on the chart, forming an expanding pattern.
Wave E in expanding structures is typically very strong, and we expect the supply zone to hold, leading Ethereum to drop to lower prices within its bearish cycle.
The green zone is a strong area where a significant number of buy orders exist.
We follow the structure to see how Ethereum will react.
For risk management, please don't forget stop loss and capital management
When we reach the first target, save some profit and then change the stop to entry
Comment if you have any questions
Thank You
Neo Wave

ICNT Analysis (4H)It appears that a triangle is forming. We are currently completing wave D of this triangle — in fact, we are in the middle of wave D.
To complete wave D, the price may make deeper drops.
The best area for entering a sell/short position is the red zone. If the price reaches this zone, we can open a sell/short position.
The targets are marked on the chart.
A daily candle closing below the invalidation level will invalidate this analysis.
For risk management, please don't forget stop loss and capital management
When we reach the first target, save some profit and then change the stop to entry
Comment if you have any questions
Thank You

ETHEREUM Analysis (12H)From the point where we marked the green arrow on the chart, the Ethereum triangle has begun, and at the point where we placed the red arrow, this triangle has completed and the price has entered a bearish phase.
It seems that we are currently in the late stages of wave C of this phase. Just note that this is the 12-hour timeframe, and this phase has not finished yet; its completion requires more time. We expect wave C to finish within the green zone, which is a supportive flip area.
From the green zone, wave C is expected to complete and the price should enter wave D, for which we have marked the targets on the chart.
Let’s see how it will unfold.
For risk management, please don't forget stop loss and capital management
When we reach the first target, save some profit and then change the stop to entry
Comment if you have any questions
Thank You

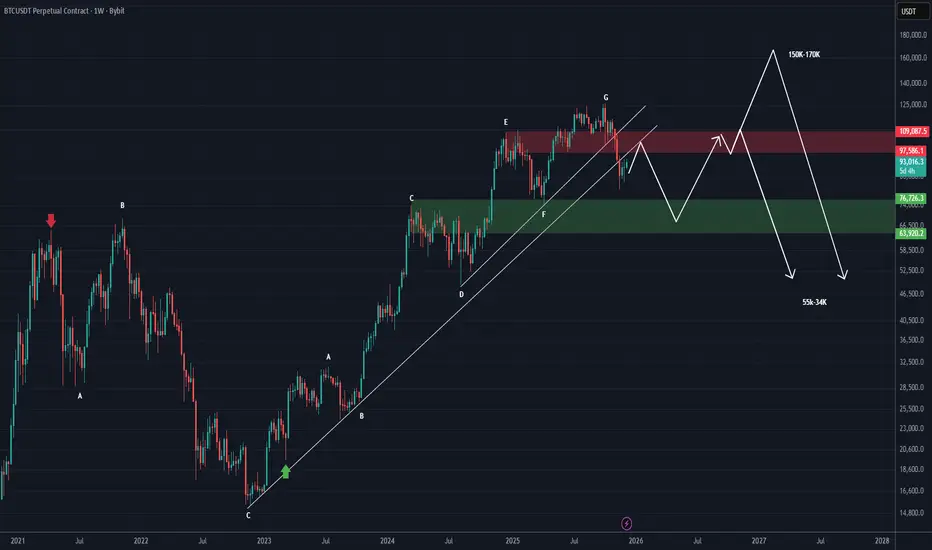
Bitcoin RoadMap (1W) | Important UpdateIt’s better to first have a complete roadmap for Bitcoin for the coming months.
We have cleaned up the chart as much as possible, making the pattern lines and range zones invisible so the chart remains uncluttered.
As you can see, Bitcoin is trading below the upward trendlines and also below the FLIP zone.
It is expected that the price will be rejected from the red zone down toward the 76K to 64K range, and then from that area it may attempt a move toward higher levels.
If the red zone is broken, the price could reach the 150K to 170K area. However, if it fails to hold above the red zone, it may drop to the 55K range and even 27K, potentially starting a bearish cycle.
This is the condition for Bitcoin | it should not be compared with altcoins, and many altcoins may even become bullish while Bitcoin is in a bearish cycle!
For risk management, please don't forget stop loss and capital management
When we reach the first target, save some profit and then change the stop to entry
Comment if you have any questions
Thank You
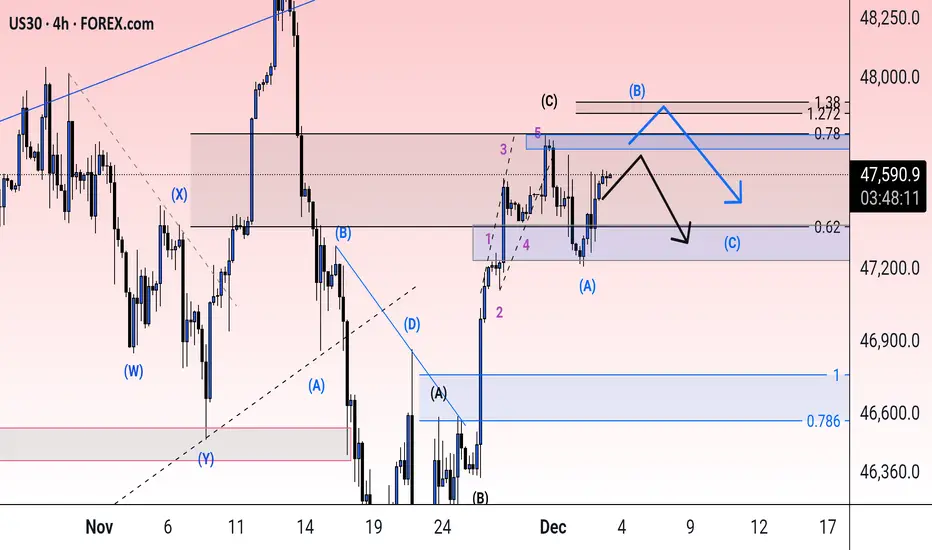
possibility of correction The current uptrend is expected to end at the current resistance level and a correction is expected. If the price breaks through the resistance level, a continuation of the uptrend to the next resistance level is possible.

Quick Bitcoin Update (4H)The corrective phase of Bitcoin is an expanding triangle/diametric/symmetrical , with wave C completed and now we are inside wave D. This is a bullish D wave.
There is still time remaining for wave D to complete.
We have marked a green box below the price; if the price reaches this area, we can look for long/buy positions.
Look for long/buy positions in the red box, as there are many sell orders placed there.
For risk management, please don't forget stop loss and capital management
When we reach the first target, save some profit and then change the stop to entry
Comment if you have any questions
Thank You

New update on Tether Dominance (4H)Based on the previous analysis, which you can see in that post (), the price did not move above the defined supply zone and headed downward. We have now analyzed Tether Dominance on the four-hour timeframe.
Now it seems it may have another drop ahead and move toward the green zone. The best area for a rejection is the red zone.
This would make Bitcoin and some altcoins more bullish.
As long as this index has not reached the green zone, look for buy/long positions.
For risk management, please don't forget stop loss and capital management
When we reach the first target, save some profit and then change the stop to entry
Comment if you have any questions
Thank You

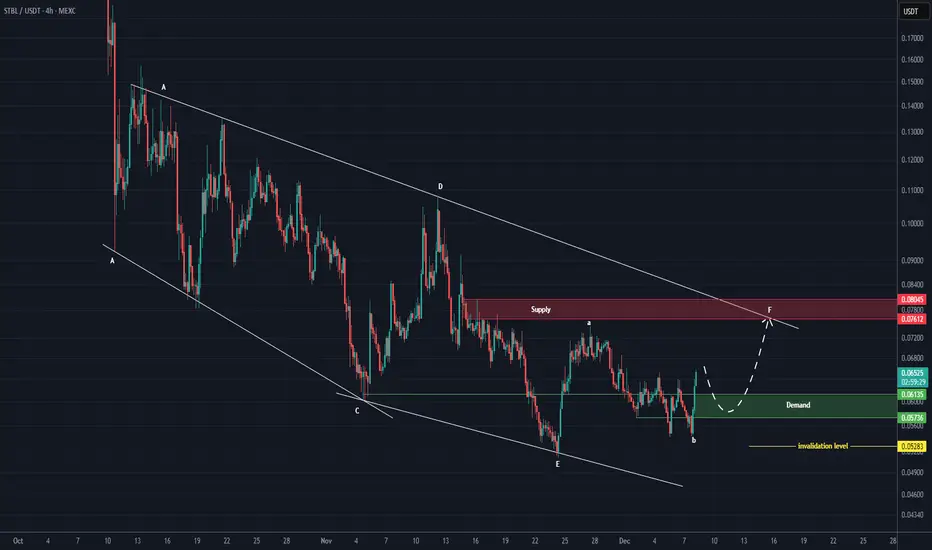
STB Analysis (4H)It seems that the STB coin is in a corrective diametric pattern, and we are currently in wave F of this diametric.
Wave F itself appears to be an ABC structure, and we are now at the end of wave B.
If a pullback forms, a long buy position can be taken at the green zone for the targets of wave B of F.
The targets are marked on the chart.
A daily candle closing below the invalidation level will invalidate this analysis.
For risk management, please don't forget stop loss and capital management
When we reach the first target, save some profit and then change the stop to entry
Comment if you have any questions
Thank You
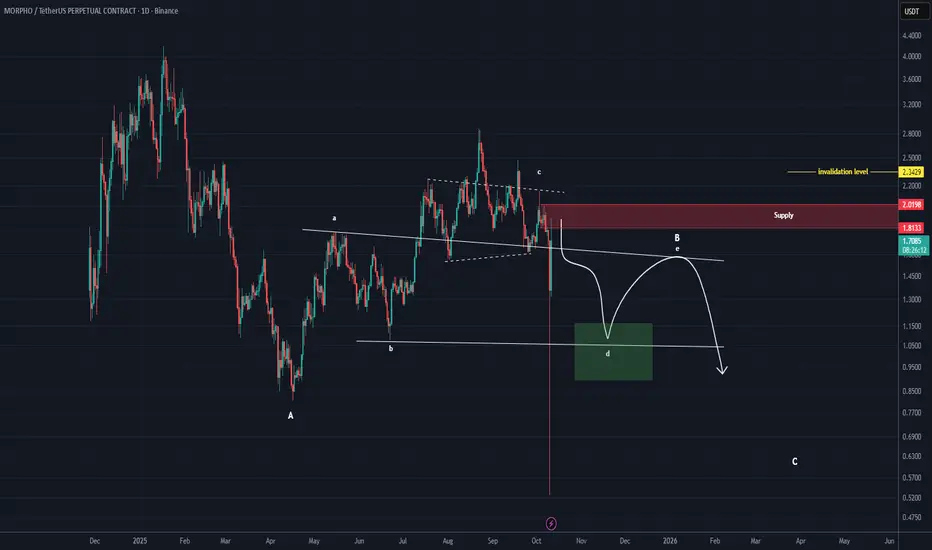
MORPHO Analysis (1D)It appears that MORPHO is currently in wave B. This wave forms a bearish triangle, and it now seems to be in wave D of that triangle. The price may move toward the green box, provided that the red box is maintained.
A daily candle close above the invalidation level will invalidate this analysis.
For risk management, please don't forget stop loss and capital management
When we reach the first target, save some profit and then change the stop to entry
Comment if you have any questions
Thank You
Elliott Wave or NEoWave? Which on is better?A common question people often ask is: Should I learn Elliott Wave or NEoWave? Which one is better? And do I need to study Elliott Wave first before moving on to NEoWave?
Let’s break it down.
The classic Elliott Wave theory originates from the book Elliott Wave Principle, written and compiled by Robert Prechter and A.J. Frost.
Both authors were not the original creators of the theory .. they simply collected and organized the works of Ralph Nelson Elliott, whose ideas were scattered across various sources, and compiled them into a single book.
Given the context of that era .. the trading environment, technology, and available tools .. it’s fair to say R.N. Elliott developed the theory to a level that was almost complete for his time.
Back then, there were no PCs, no laptops, no internet… and charts had to be drawn by hand.
In that sense, Elliott was genuinely a genius.
But despite its impact and popularity, the classical version still contains many weaknesses.
And someone eventually stepped in to identify those flaws .. a passionate young man named Glenn Neely, who dedicated himself to studying wave theory seriously and wanted to eliminate the criticism that Elliott Wave was nothing more than “a subjective theory that doesn’t work in real trading.”
Because he was born in an era where computers were emerging and technology was accelerating, he had the thought of applying science and mathematics to make wave analysis more accurate and repeatable.
After more than seven years of work, Neely published an extremely complex .. and extremely difficult .. book: Mastering Elliott Wave.
This book essentially became the foundation of early NEoWave, because nearly all of the first-generation NEoWave concepts were packed inside it.
So… which one is better?
The answer, without hesitation: Mastering Elliott Wave wins by a landslide.
Yes, it’s difficult.
But that difficulty comes with benefits:
– Higher accuracy
– Clearer structure
– Much stronger logic
These are things classical Elliott Wave simply cannot do.
The blue book (Elliott Wave Principle) lacks something crucial that the red book (MEW) provides:
a practical and functional Degree system.
(The truth is, even MEW’s Degree system isn’t perfect .. which is why I eventually built my own system on top of it.)
Neely also introduced time and price principles to calculate Degrees .. determining which waves are major, which are minor, etc.
This method does not exist in the classical version at all, which only provides extremely abstract degree labels.
So, do you need to learn Elliott Wave first before studying NEoWave?
Let me give you a simple analogy.
Elliott Wave = manual transmission car
NEoWave = automatic transmission car
The question is:
“If you buy an automatic car, do you need to learn manual first?”
The answer: Absolutely not.
Even though NEoWave originated from Elliott Wave, the internal logic has diverged significantly.
(And in today’s world, NEoWave has already moved far past the classical version.)
In fact, I personally believe you shouldn’t study both at the same time .. especially if you’re a beginner .. because the rules of the two systemas will conflict with ech other and waste your time.
For example, some patterns that classical Elliott Wave strictly prohibits, NEoWave has tested and proven to be possible.
In summary:
NEoWave takes the material from classical Elliott Wave and develops it into a far more precise, detailed system.
But even NEoWave still has flaws that make real-world trading difficult .. which is exactly why I’m working on improving and modernizing it.
At the end of the day, no theory lasts forever, because markets are driven by humans.
The psychology of today’s generation isn’t the psychology of people 100 years ago.
And modern markets influenced by AI-driven trading are not the same as Elliott’s era or Neely’s era.
This is why we need new-generation theories built for new-generation data.
- written by me(brainiak/ew-lab) thanks for reading!

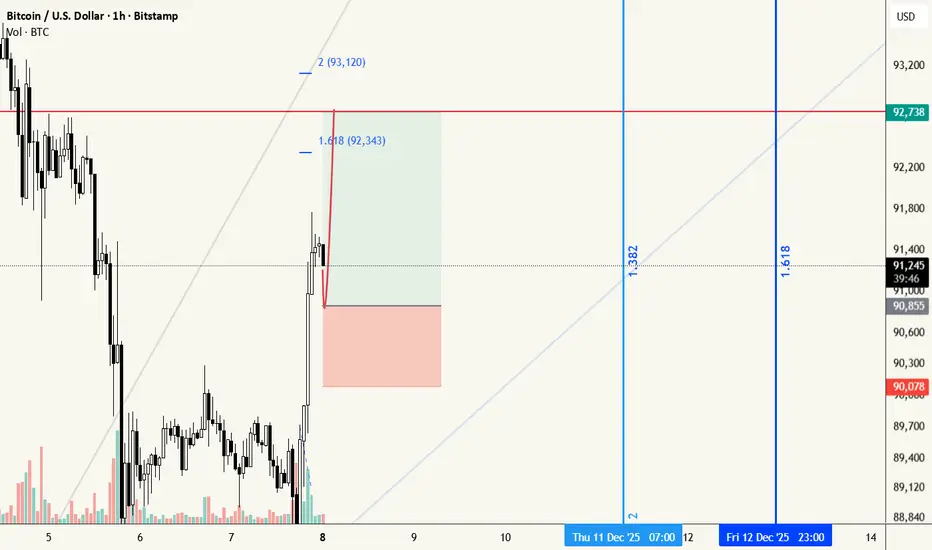
scalp long for bitcoina scalp setup for long in BTCUSDT.
entery : 90850
SL: 90000
TP : 92400 92700 93000
Always DYOR.
BTCUSDT next moveIn my opinion according to elliot waves, we are in the final stage of a WXY wave which will be around 96 - 98 K and then we will go down

YB Buy/Long Setup (4H)From the point where we placed the red arrow on the chart, the correction of YBUSDT has begun. It now appears to be in wave C of this correction.
We are looking for buy positions around the green zone.
Targets are marked on the chart.
A daily candle closing below the invalidation level will invalidate this analysis.
For risk management, please don't forget stop loss and capital management
When we reach the first target, save some profit and then change the stop to entry
Comment if you have any questions
Thank You

TAG Analysis (12H)Before anything else, please note that this coin has high volatility.
This coin is completing a bullish structure. The pattern is a bow-tie diametric, and we are currently in its G wave.
In the red zone, the G wave is expected to finish, and we anticipate a drop.
In the red zone, we will be looking for sell/short positions.
Targets are marked on the chart.
A daily candle closing above the invalidation level will invalidate this analysis.
For risk management, please don't forget stop loss and capital management
When we reach the first target, save some profit and then change the stop to entry
Comment if you have any questions
Thank You

BNB Analysis (4H)From the point where we highlighted the red arrow on the chart, the waves of the bullish phase have finished and the bearish phase has begun.
The bearish-phase pattern you see on the chart, which we have labeled, is a symmetrical formation.
The price proportions in this pattern are clearly visible, except for wave A which corresponds to the market crash and if we exclude it, the declines of each wave in this pattern range between 22% and 25%. This time as well, we expect a similar drop for wave I.
It appears that we are currently in wave I of this pattern, and we expect a rejection from the red zone downward so that wave I for Binance Coin can complete.
In the green zone, one can look for buy/long positions.
The closing of a daily candle below the invalidation level will invalidate this analysis.
invalidation level : 640$
For risk management, please don't forget stop loss and capital management
When we reach the first target, save some profit and then change the stop to entry
Comment if you have any questions
Thank You

Bitcoin Analysis (4H)Bitcoin is in a bearish phase. It appears that Wave C of the bearish phase has transformed into a dimaetric.
The price is expected to bounce back from the green zone toward the upside, and then we may see the main rejection from the red box. The bullish wave we are expecting for Bitcoin corresponds to Wave D.
Let’s see whether a double bottom forms to support the price upward or not.
A daily candle close below the invalidation level will invalidate the bullish Wave D.
For risk management, please don't forget stop loss and capital management
When we reach the first target, save some profit and then change the stop to entry
Comment if you have any questions
Thank You

ASTER New Analysis (4H)This analysis is an update of the analysis you see in the "Related publications" section
The supply zone we identified in the previous analysis, after rejecting the price multiple times, was eventually cleared. It was a good order zone, and we marked the touches and rejections with orange circles. However, based on wave structure and price action, we are not buyers at these points.
This wave is very likely an X-wave, and if the price doesn’t drop from the current levels, it will drop from the upper red zone. We will only look for buy opportunities in the green zone.
The buying pressure you see is due to news and marketing around this token, as Binance funders created this coin.
For risk management, please don't forget stop loss and capital management
When we reach the first target, save some profit and then change the stop to entry
Comment if you have any questions
Thank You

Check the trend It is expected that within the specified resistance levels, a trend change will take place and we will witness the beginning of a correction. If the price crosses the 78.6% level, the continuation of the upward trend will be likely.

Possibility of downtrend A trend change is expected to form at the current resistance level and we will see the start of a correction. As long as the price does not consolidate above the previous ceiling level, a correction is likely.

Possibility of uptrend Given the price behavior within the current resistance range, possible scenarios have been identified. As long as the price does not consolidate above the resistance range, a correction is likely.

Check the trend Considering the price behavior within the support area and the support trend line, possible scenarios have been identified. As long as the price fluctuates above the support area, the start of an uptrend is possible.

Possibility of uptrend The uptrend is expected to end at the current resistance level and begin a downtrend. If the price breaks through the support level and then consolidates above the resistance level, the uptrend may continue.

Check the trend Given the completion of the recent bullish wave, the current corrective trend is expected to continue along the indicated paths. If the index breaks through the resistance area, the blue path will be the alternative scenario.