Eth Short Term BullishThe chart displays Ethereum (ETH/USD) on a 30-minute timeframe, with a technical analysis predicting a potential upward movement using labeled wave structures (A to G). Here's a summary:
Key Elements:
Channel Analysis: Price is moving within an upward channel bounded by two black trendlines.
Breakout Zone: The previous downtrend (marked by a diagonal black resistance) was broken near point A, initiating a potential bullish reversal.
Wave Structure:
A → B → C → D: Price formed higher lows and higher highs within the channel.
Predicted Move: The chart projects a bullish continuation from point D to:
E (around $4,108)
A minor pullback to F ($4,003)
Then a final push to G (around $4,280)
Support & Resistance Levels:
Support Zones: Around $3,800 (highlighted grey box) and $4,003 (F wave).
Resistance Zones: $4,108 (E wave) and $4,280 (G wave).
Conclusion:
The chart suggests a bullish wave pattern is forming, with potential short-term pullbacks before pushing toward higher resistance levels. The trader anticipates ETH to follow a wave-like climb within the rising channel.
Neo Wave

The Bitcoin bearish era has begun (1D)First of all, you should know that in our previous analyses, we had identified a large triangle. However, the market makers created another bullish wave, increasing the chart’s error margin (The scenario you see in the related ideas section.).
This sharp move indicates the beginning of new bearish branches! It is expected that with a pullback to the red zone, the correction will continue, and we will be involved in it for at least a few months.
Closing a daily candle above the invalidation level will invalidate this analysis.
For risk management, please don't forget stop loss and capital management
When we reach the first target, save some profit and then change the stop to entry
Comment if you have any questions
Thank You

Doge(based on NEo wave)I think Its gonna be a flat and some how we will see a very strong bearish wave to 0.01$!
I dont see any bullish waves for long terms.
LYN Looks Bearish (1H)Please note that this token has been listed recently and is highly volatile, so manage your position size and risk carefully.
It seems that a pattern with at least five waves is forming, with wave D currently coming to an end.
Once the price stabilizes below the red line, it may start moving toward the targets.
The targets are marked on the chart.
For risk management, please don't forget stop loss and capital management
When we reach the first target, save some profit and then change the stop to entry
Comment if you have any questions
Thank You

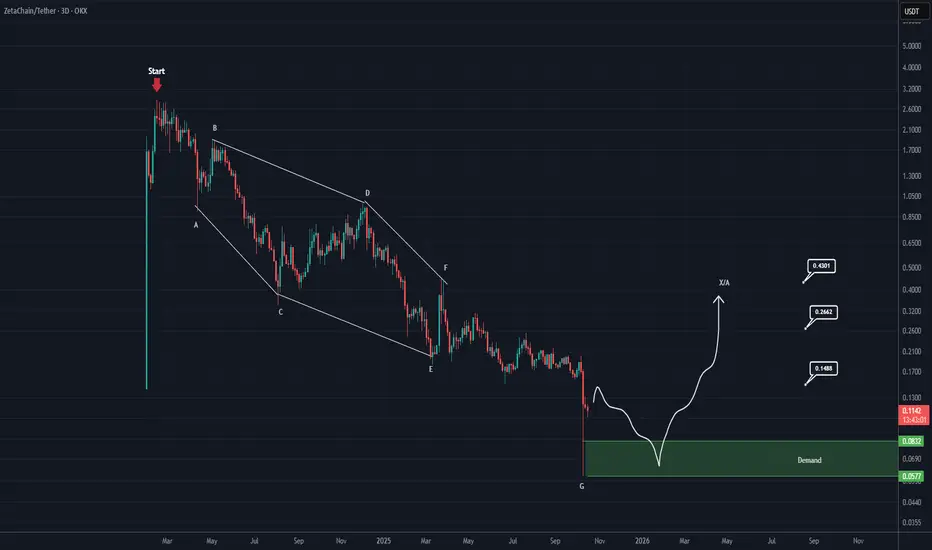
ZETA Analysis (3D)From the point where the red arrow is placed on the chart, it seems that ZETA’s correction has begun, and a diamond-shaped diametric pattern is nearing completion.
It is expected that the correction will end around the green zone, after which the price may enter a bullish phase — this phase could either be an X-wave or a multi-legged upward pattern.
Let’s wait and see how it unfolds.
For risk management, please don't forget stop loss and capital management
When we reach the first target, save some profit and then change the stop to entry
Comment if you have any questions
Thank You
RENDER Analysis (1W)It seems that wave C of the weekly diametric pattern on RENDER has completed, and we are now entering wave D.
The price, through a time–price correction, may move toward the green zone over the coming weeks until the time and price structure of this major diametric pattern is complete.
The targets are based on the weekly timeframe, and it will take time for the price to reach them.
For risk management, please don't forget stop loss and capital management
When we reach the first target, save some profit and then change the stop to entry
Comment if you have any questions
Thank You

Bit Coin Short Term bearishThis chart presents an Elliott Wave analysis of Bitcoin (BTC/USD) on a 4-hour timeframe, shared by Wave Count Pro. The pattern shows a complex corrective structure unfolding within a well-defined channel, with key turning points labeled as A, B, C, D, and a projected E.
Currently, price action is approaching a critical decision zone around $117,211.36. The analysis suggests two potential scenarios:
Bullish Breakout: If the price breaks above the $117,211.36 resistance, it could trigger a strong bullish move toward the upper trendline, targeting around $140,218.55 (labeled as point E).
Bearish Rejection: A failure to break above this level could lead to a pullback toward the lower boundary of the channel, possibly completing a wave (e) before a potential rally.
Key Levels:
Buy Above: $117,211.36
Sell Below: $113,966.84
WaveCount Pro
Gautam Khanna

Ethereum Following Neo WaveEthereum master plan decoded with Targets just follow my Green lines :-)
Ethereum is following neo waves, and these targets are now Arrived basis on the neo wave theory

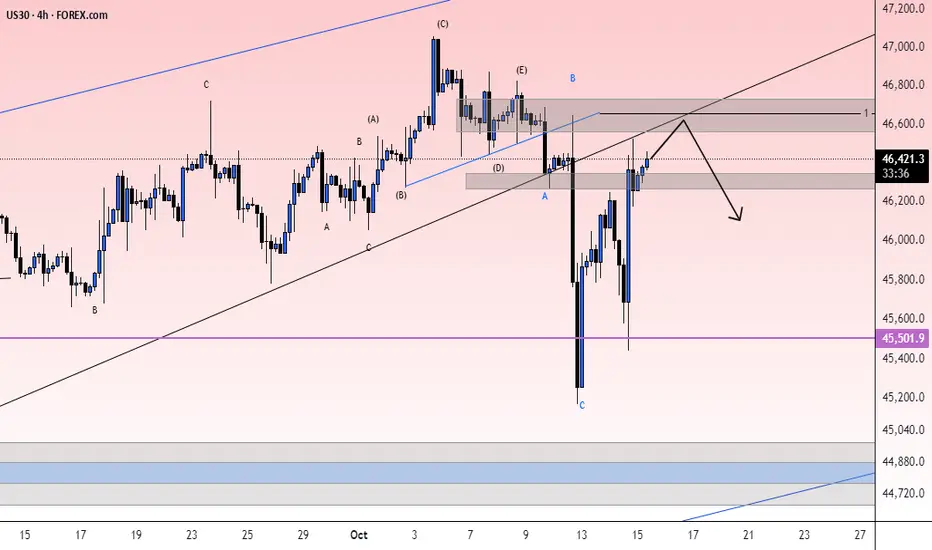
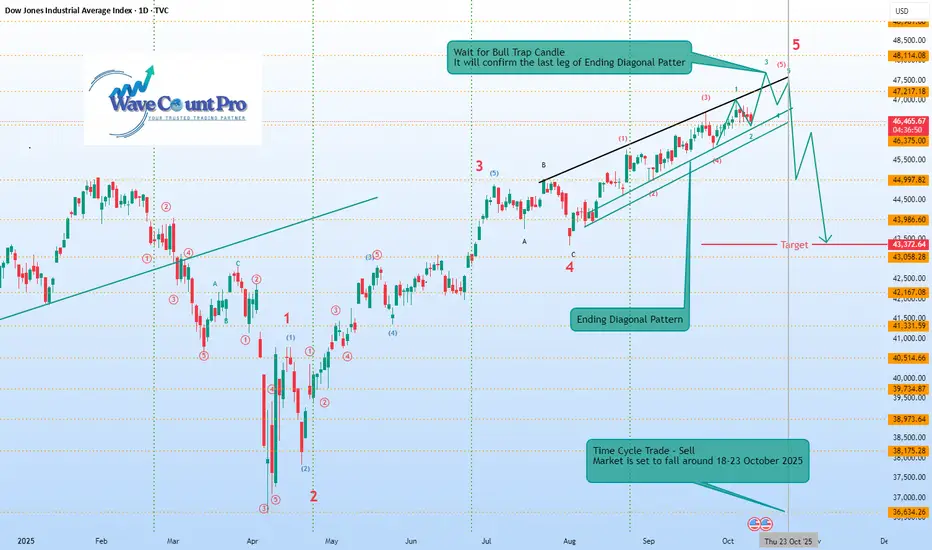
US30 all set to fall 5% starting 18-23rd OctHere’s a summary of the chart you provided:
Index: Dow Jones Industrial Average (DJIA), Daily timeframe (2025).
Pattern: Ending Diagonal Pattern forming in Wave 5.
Wave Count:
Major impulse structure labeled 1–5, with sub-waves marked inside the Ending Diagonal.
Current move is in the final 5th wave, nearing completion.
Key Message:
A Bull Trap Candle is expected — it will confirm the final leg of the Ending Diagonal.
After that, a sharp correction (sell-off) is anticipated.
Target Zone: Around 43,372–43,058.
Time Cycle Note:
A Time Cycle Trade (Sell) is suggested.
Market is projected to fall between October 18–23, 2025.
In short, the chart forecasts the completion of an Ending Diagonal near 47,200–47,500 levels, followed by a significant downside move toward the 43,000 zone starting late October 2025.
Eth New Targets - Triangle Breadown📉 Technical Patterns & Indicators
1. Head and Shoulders Pattern
Left Shoulder, Head, and Right Shoulder are clearly marked.
Breakdown from the neckline suggests a bearish reversal, with a drop of ~6.49% (-295.99) post-breakdown.
2. Triangle Formation
A symmetrical triangle labeled with a, b, c, d, e waves.
The recent price movement has broken below this triangle, indicating a bearish breakout.
3. Elliott Wave Labels
Waves labeled A, B, C, D, E, F, G.
The chart is currently in the E-wave to F-wave transition.
Projection points:
F Wave target: ~$4,218
E Wave target: ~$4,084.51
G Wave target: ~$3,897.08
4. Trendlines
Blue and black descending trendlines suggest downward pressure.
Ethereum remains below these resistance lines, reinforcing a bearish outlook.

Ethereum Daily Chart (Sell on Rise)Wave Count (Green Labels 1–5):
A 5-wave impulsive move appears to have completed, marking a bullish cycle peak.
Complex Correction (W-X-Y-X-Z pattern):
The correction after the 5th wave is labeled as a Complex Correction, composed of:
Wave W – Zigzag
Wave X
Wave Y – Flat (3-3-5)
Wave X – Smaller bounce
Wave Z – Currently unfolding with a Diametric Pattern (7-wave structure)
📉 Current Market Structure
Ethereum is in a corrective phase, currently moving through the Z wave of the complex correction.
The correction appears to be forming another Diametric Pattern, potentially indicating one final drop before resuming upward.
🛒 Key Buying Zones Highlighted
Upper Buying Zone (~$4,400 to $4,600)
If ETH breaks bullish earlier than expected.
Lower Buying Zone (~$3,600 to $3,800)
More likely based on the projection shown.
Where the final leg (Z) is expected to complete.
📈 Projected Path
Price is expected to dip into the lower buying zone as the Diametric pattern completes.
Following that, a strong bullish reversal is anticipated, likely leading to a new impulsive wave up.
📝 Patterns Used
Zigzag
Flat (3-3-5)
Diametric Pattern – A 7-legged corrective structure, less common, indicating prolonged correction.

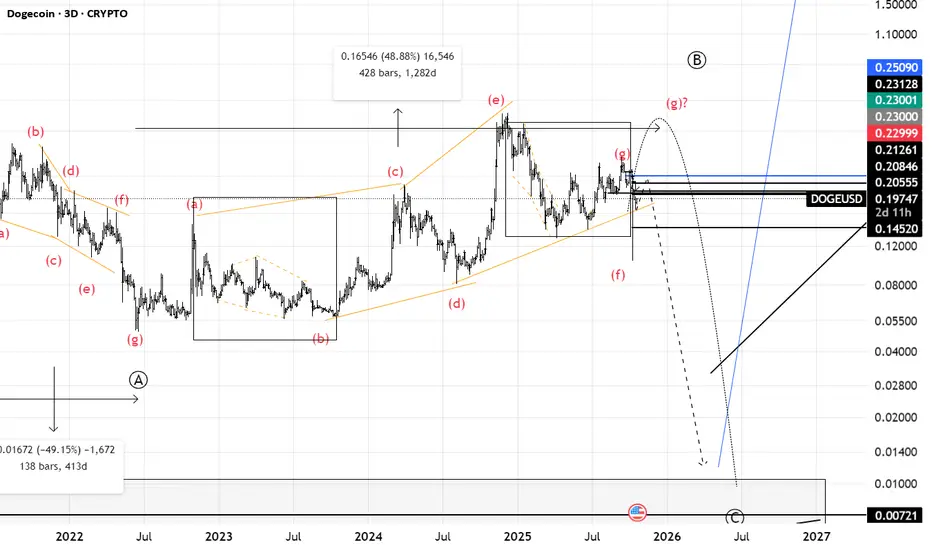
BitCoin Ready for Bull run 28% upside expected🔍 Analysis Summary:
Current Price: ~$106,927
Pattern: Contracting triangle (ABCDE), nearing completion of wave (e).
Buying Zone: Around $104,000, marked as a potential entry area.
✅ Trading Plan:
Wave (e) could mark the end of the triangle, implying an impulsive breakout upward.
Target for the breakout:
$134,831 (approx. +29% move from the current region)
Further Target (long-term):
Potential move toward $146,000+, labeled as wave G??? (still speculative).
🧠 Insights:
Price action has followed a well-defined corrective structure (labeled A-G and a-e).
The chart shows multiple confluences of support near the buying zone (purple curve and horizontal level).
This setup suggests a low-risk, high-reward opportunity if price reverses near wave (e).

Eth Ready for All time High :-)🔍 Analysis Summary:
Current Price: ~$3,824
Pattern: Complex Elliott Wave correction (W-X-Y-X-Z) has likely completed.
Key Observation: A potential bear trap just occurred (false breakdown), signaling a reversal.
Wave Count: The chart suggests that Wave 2 has completed, and Wave 3 up is starting.
✅ Trading Plan:
Buy Above: $3,925
Stop Loss: $3,378
Target 1: $5,230
Target 2: $6,306
🧠 Insights:
Buying Zone was identified in the earlier phase near April.
Bear Traps are used to suggest failed breakdowns, which trap sellers and fuel upside moves.
Expected Move: Strong impulsive rally if price breaks above the resistance zone.

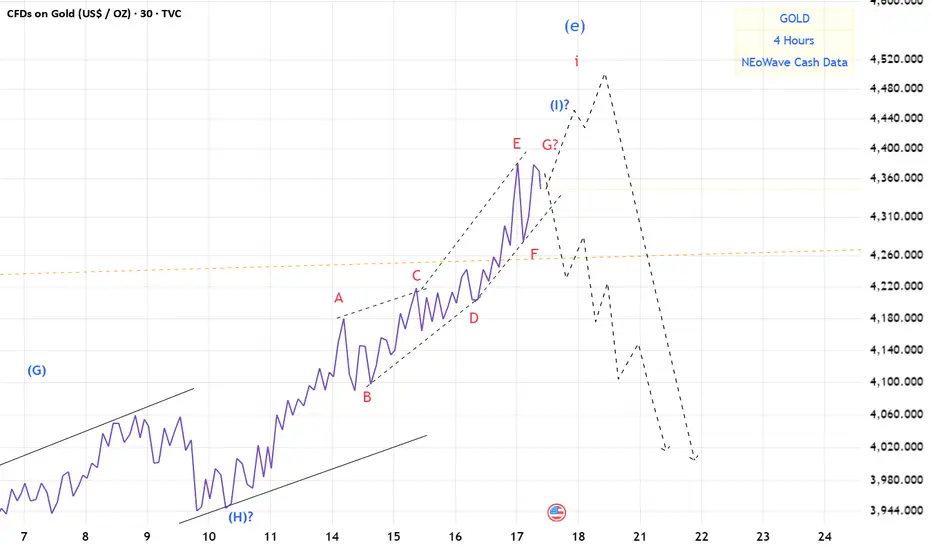
Gold(based on NEo wave)maybe here is the end of wave i.
based on Dow theory good news on top.
crazy people are buying gold.
I think soon we will see crash of gold.
market will not be bullish forever.
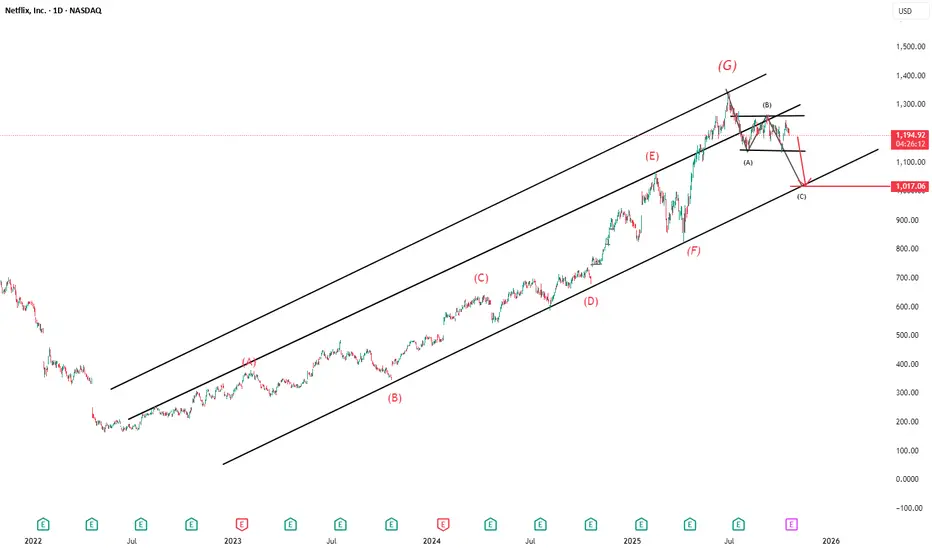
Netflix Ready to Fall ??Technical Analysis Summary
Chart Type: Daily (1D)
Ticker: NFLX (Netflix Inc.)
Current Price: $1,194.00 (as of October 16, 2025)
Recent Movement: Down by -0.77%
📈 Elliott Wave Labels (in red)
The stock shows a 7-wave impulse move labeled from (A) to (G), forming an upward channel.
The latest top is marked as (G) near $1,450.
A corrective structure appears to be forming post-(G), labeled as (A), (B), (C) in black.
📉 Bearish Outlook
The chart suggests a potential further decline:
From the current level ($1,194) to near $1,107 (short-term support).
Then possibly down to around $1,017 (marked as wave (C)).
📊 Trend Channels
Two parallel ascending channels:
The inner channel guided the move from early 2023 until mid-2025.
The outer channel includes the recent peak at (G), showing possible overextension.
The price has broken below the upper boundary, hinting at a trend change.
possibility of uptrendIf the price reverses the trend within the current support range, the start of an uptrend is likely. Otherwise, a continuation of the downtrend to the next support range is possible.

check the trendThe trend change is expected to form in the current resistance range and we will witness the start of the correction trend. With the break of the resistance range, the continuation of the upward trend to the next resistance range will be possible.

possibility of uptrendThe correction trend can progress to the specified support levels. Then there is a possibility of a trend change and the start of the upward trend will be likely. The break of the previous ceiling range will be a confirmation of the upward trend.
possibility of uptrendThe price is expected to break through the resistance range and trend line and we will witness the start of the upward trend. Otherwise, the continuation of the correction trend will be likely.

correction It is expected that the correction trend in the current support area will end and we will witness the beginning of the upward trend. If the 100% level is broken, the downward trend may continue.

uptrend By breaking through the resistance area, the upward trend may continue to the resistance trend line. Then, the movement may continue according to the specified paths.

uptrend If the price breaks through the resistance area, the upward trend may continue to the next resistance levels.
Otherwise, a correction to the specified support levels may be possible.

check the trendIt is expected that a trend change will form in the current resistance range and we will witness the beginning of a downward trend.
As long as the index does not stabilize above the resistance range, the continuation of the downward trend and correction will be likely.