Quantitative Easing & Rate Cuts = Bullmarket in Mining Stocks.You've seen the news lately, the Federal Reserve has taken unprecedented actions BEFORE a recession has even hit. The Fed has already cut rates 3-times and restarted their Quantitative Easing, although not officially calling it that.
Predictions and Possibilities for 2020:
2008 Style Recession.
Dollar Run.
Debt Bubble Pop.
We can not sit and say things are great as you may hear on mainstream financial media. These steps taken by the Fed are VERY bullish for precious metals and mining stocks. These are our recommendations, each will reach at least 300%:
ASM: Avino Silver and Gold Mines
NGD: New Gold
B2G: Barrack Gold
Check our "An Obvious Investment" chart, you will see that our NDG has already seen 10% growth since posting. It's time to be money smart.
NEW

NAS 100 Analysis Latest Updates Short Trade Idea 2020 By Hydra** Please support this idea with your likes and comments, it is the best way to keep it relevant and support me. ** Forex Trading are leveraged product & can result in the loss of your entire capital. Please ensure you fully understand the Risks involved.

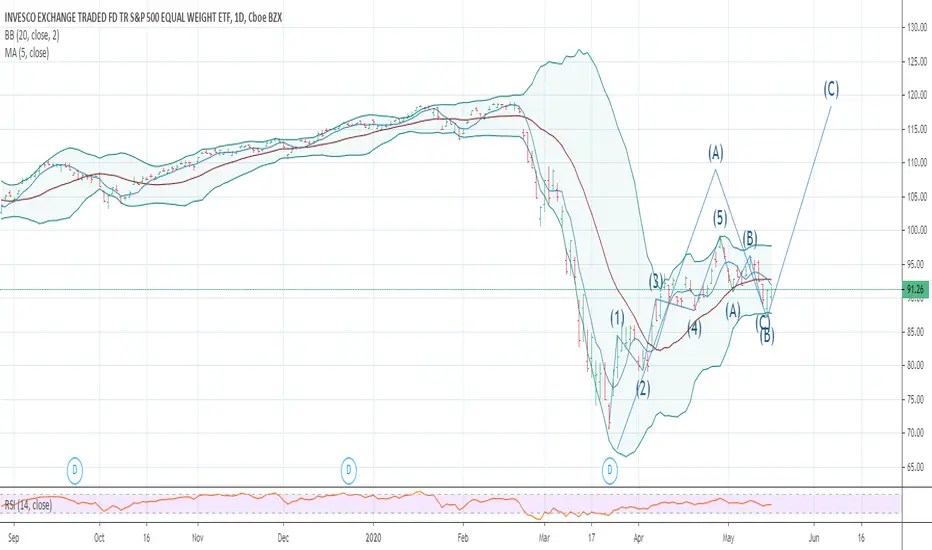
NEW UP LEG TO START THE CYCLE LOW DUE 3/21 AND 4/2 CAME IN RIGHT ON TIME THE NEXT CYCLE LOW WAS DUE 5/10 TO 5/23 I SEE IT ENDING NOW WE SHOULD NOW START ANOTHER 5 WAVES UP TO .618 TO 786 AND EVEN A SLIGHT NEW HIGH COULD BE SEEN FOR WAVE B WITHIN THE FORECAST DEC 23/2019 THAT THE EVERY LARGE SUPER CYCLE 4TH WAVE TRIANGLE WHICH WOULD END OCT 2021 AT THE LATEST AND IF EARLY WOULD BE OCT 10 TO JAN 10


Quaterly Low :-{} Well a reveersal to take out Traders on Top still possible but the Low (red box) would be my bearish target.


PULLBACK ENDING IN WAVE B LOOK FOR MUCH HIGHER TARGETS THE LOW INTO THE PANIC WAS A PERFECT.382 FROM THE LOW IN THE NYSE DEC 1974 WAVE 2 OF FIVE AND NOT WAVE 4 . I WILL POST DETAILS ABOVE 13000 BY JULY AUG

Stop Hunt LevelssLooking for Break to the Top with a Reversal to the lower levels in order to take out Breakeven Stops. Also there is some Imbalance below the Open that needs a fill.

New Possible Highs, but Big Reversal for Stop Hunts to watch outPretty much self explanatory. The opposite of all of this could happens as some previous highs haven been hit and we could a down trend 2-3 days.


EURUSD NEW!!!The dollar is now in a very interesting position.
At the moment, I expect its growth to the level of 1.095.
After which it is rolled back, with a break of the support line, to the support level of 1.077.

FLIGHT TO SAFETY THIS DOES NOT END WELL SOON IF you think that THE PANIC IS OVER THINK AGAIN BASED ON THIS i THINK NOT .I AM NET SHORT TODAY AS OF 10 AM 2836 And very little will change my view THE NEXT DOWN WAVE IS NOT FAR OFF . MAY 10 AND THEN REAL TROUBLE INTO MID OCT

My 1st publish... Looking for feedbackI am brand new to charting and trying to learn T.A.... I am asking for advice on if my ideas are even close to what others are thinking. I have used the fib tool and this pullback on the daily is sitting perfectly on the 236. I have an ascending wedge, that hopefully we can break out to the upside in the next few days. I believe with the ascending triangle and descending volume, this would technically be bearish, but that's not how I think. I am a long term holder so I don't trade on leverage, but if I did, I would probably go long with a close stop loss.
Any feedback would be greatly appreciated. I am a beginner so please be gentle lol

Start BUY EURJPYGood morning everyone! So, we start with EURJPY.
I apologize for being so distant, but I wanted to show you the power of the lines that form the channels.
Now the price has dropped to the intersection of two support lines.
Therefore, I certainly expect EURJPY to rise to the first resistance line.
Open "Buy".

AUDUSD LONG new thoery not looking fro specifics in price targets as of yet as im testing a new theory, just a general area labelled "box1" and "box2"
this theory captures the previous ares of wicks and uses those as support and resistance , one established the area is looking to find a 3rd touch on the trend line , (first arrow pointing towards it) to then shoot up for a long


Another ExerciseThis is the same idea as my previous post to combine the Cross Strategy with the Standard one I keep seeing...

Another Exercise/PracticeDoes this make sense? I tried to marry the idea of a cross strategy with the idea of the boxes that I see everyone do. Two yellow lines would be my entry threshold. Solid red line would be my SL. The 3 aqua lines would be my TP1, TP2, TP3. So placing each sell simultaneously as such - TP1 (+1.00) TP2 (+1.00) (TP3) (+.50). TP1 & TP2 are more "plausible" if the down trend continues, so put more in for a greater reward. Once TP1 hits, move SL up to that previous line.
Again, does this make sense? I realize they arent large PIPS, I'm still new, I'm just trying to see if I understand what's happening. I'm still in demo mode, so this is all hypothetical.
Does anyone see these? Haha.
FX:USDJPY

USD/JPY analysis: trade setupprice has retraced to a key region with supporting confluence from trendline and fib regions if price can respect this area with candlestick behaviour displaying slowed momentum, buying opportunities could be more predominant to a shift into new highs like 110.00 which correlates to -27% fib level.

