Natural Gas(NG) is about to BOUNCE
Technical Analysis:
Now it seems to make a wave (2) in blue and after it is complete we expect a bonce
Don't sell NG now and prepare to buy when II in red is finished.
H1 right side is turning up
H4 right side is turning down
Ng!

Natural Gas On Breakout....Natural Gas is Breaking out of the base. The entry is above this daily bullish candle and stop loss under the candle. Looking at 2R profit target, however there will be more entries along the way on lower timeframes for more scalping.

Is Natural Gas(NG) Preparing for a Big Bounce???Technical Analysis:
- Natural Gas is in a weekly edging buy area and any moment it can bounce once wave (5) in blue will be done
- Anyway, the big probability with actual data is that a small extend could happen in the wave (5)
- H1 right side is turning down
- H4 right side is down
Technical Information:
- If you're a position trader or long term investor, you may buy in the actual level
- And if you're a swing trader, wait for possible extend in wave (5)

Natural Gas Gold Silver DXY Price forecastsupport & Resistance guide Natural Gas Gold Silver DXY Price forecast

CL WTI Crude Oil - Getting In Sync With The Market MakersIn late July I made a call that oil's actual target in the imminent term is not $100+, but actually a 3 or a 4-handle.
Oil - A New Long Leg Down Soon Begins
I believe that this long term analysis is still correct. However, price action has shown that the target was finally the daily gap at $85 and was achieved last week.
Thus far in some 7 weeks of trading, oil has only gained $9.
I likewise believe that before Natural Gas goes on its next bull run, it's going to violently abuse the longs with a raid under $1.8
NatGas - No Moon Until Doom
But with current price action, we may get a false breakout over $3.1 before that can happen.
A pump in energy and metals in September would be congruent with the thesis that equities are going to have a very red September as a setup into a Q4 that takes out the highs, which I outline here on the Nasdaq ES Futures:
Nasdaq Futures - Are You Prepared For Red September?
But the problem for retail traders is everyone is "practical" and believes that we're going straight up from where we are. It's a new bull market, some guy who works for some big bank and is tasked with engineering liquidity for high net worth clients and funds, told social and establishment media.
Equity bulls need to give their head a shake, though. And so do energy bulls.
With the U.S. being net short hundreds of millions of barrels from the Strategic Petroleum Reserve and the Fed reiterating that interest rates simply are not going to be cut until there's an international economic crash, the "long" trade only exists insofar as riding the wave that is intended to kill long term funds who are net short.
If the scheme really is to rally like it's a new paradigm into Q4 and create a Bump and Run and then blow the world economy away in 2024 ahead of the next U.S. election, which Joe Biden will win because Donald Trump will die in prison, then there are significant risks.
It's just like Burning Man where they decided to do a ritual sacrifice to the Azov cult in Ukraine and were met with a flood and rainbows and now are trapped in 6 inches of their own urine and feces and alkaline mud.
What I mean by the above is that the best laid plans of mice and men always go awry, and this should be obvious to anyone who understands the situation in China with even a modicum of sobriety.
Unfortunately, the people who understand China with a modicum of sobriety are almost nobody.
Xi Jinping is an idiot who is still holding onto the Chinese Communist Party, the most murderous and worthless regime in all of human history.
While Xi has never participated in the persecution of Falun Dafa's 100 million practitioners, which was started July 20, 1999 by former Chairman Jiang Zemin, and has even been killing the Jiang Faction as his real target in the Anti-Corruption Campaign, Xi is still the head of the CCP.
When the CCP falls, Xi will fall with it and be impugned as responsible for all of the Party's sins in all of history.
And this means that in the process of the CCP falling, Xi may show a glint of intelligence and wisdom and overthrow the Party himself, Gorbachev style, using the persecution as a weapon to protect the real China from being taken over by the International Rules Based Order that uses Taiwan as a proxy.
What all of this means for energy and equities and really everything else is significant gap downs are ahead in the markets, and are likely to come at prices that are high but not that high.
This is because if significant problems in China emerge and go viral on social media that Party West's propaganda machine are unable to suppress, it will disrupt the plan, and all of those long positions that are set to sell at high prices will turn around and start market dumping.
This means you'll wake up one morning and see that SPY and QQQ are down 12% on market open, and this time, unlike COVID, you aren't seeing daily reversals for mitigation.
Everyone will just be open selling to get into USD cash to run for their lives.
Nobody will be around to maintain the bots, and every market will look like a cryptocurrency memecoin.
So here's the trade on oil.
We may see an immediate reversal at $85, where we are now.
But I think the real target is $95, which will take out that effective daily bar double top printed in November of last year.
That will draw in all the $100 call moonboys, since energy bulls are even more irrational than goldbugs.
And they'll expire worthless as we head into the $40s to end the year while Apple prints $220 and Tesla prints $420 and NVDIA prints $480 (lolAIbulls).
So if you want a trade heading into September, maybe we get a retrace to $82 on oil.
Consider going long with a stop under the $77.60~ low. Sell at $95.
Look for big dumps and go short on the retrace and hold into February for a $30 candle.
Then get long for January '25 printing $150+.

Natural Gas DXY Gold SIlver FORECASTNatural Gas DXY Gold SIlver FORECAST
Price action Trend analysis

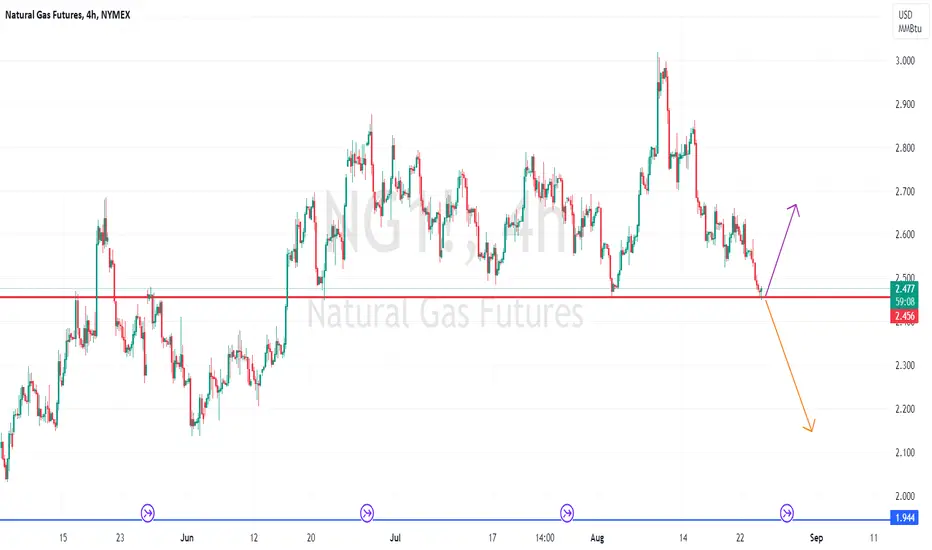
NG at multi timeframe support#NATURAL GAS... market is at his multi timeframe supporting level 2.45
its market most important and traded area form last few decades,
again market is at his level and winter season is on his way,
but it should hold this level for again bounce back..
otherwise downside we have next area that is mentioned on chart. 4
trade wisely
good luck
Natural Gas bullish move!Big move down today!
But! i still believe we have a potential huge upside.
We could go a little lower to a support level around 2.5~
but we should go up over the coming week(s).
I expect a target price around 2.7~ and after that, another move upwards towards 3~.
lets see what happens!
Good luck!

Energy markets top of mind – got gas?Energy markets are front of mind – we see crude into new cycle highs and riding the 5-day EMA – clients are progressively increasing short exposures, although we’re not at historically high skews.
Nat Gas (NG) – the wild west of energy markets – has broken the $1.91 to $2.82 range it has held all year, and the Bollinger Band volatility squeeze is firmly on. EU TTF NG prices were a clear driver, with price closing up 28%, and along with US CPI, will be front and centre in the session ahead.
Gasoline has moved to range highs of $3.00 and could get more attention from clients, if and when it closes above the highs.
The fundamentals behind the NG move have been firmly debated and whether the potential worker's strike at the Chevron and Woodside LNG facilities has genuine longevity – the three facilities in question account for c.10% of global LNG supply, so it is significant.
The risk to NG longs resides in a quick de-escalation of talks and we ultimately see no impact on supply. Married with signs of a mild winter in Asia and LNG not far off capacity limits, we could see a sharp decline in price on a resolution. Conversely, if we do see a full escalation and the market feels it could play out over a period of weeks, longs will be sitting pretty.
The trend-following crowd would be triggered on NG, with price closing above the Bollinger band and Donchian Channel (40-day look back). This still needs work, but the fact we’ve seen a breakout has raised the prospect of a test of the 200-day MA and full trending conditions.
Looking at the intraday tape in the US500 we see that as crude prices pushed above the April highs, we saw little selling of equity. We also saw the market's pricing of expected inflation (through ‘breakeven’ rates) also falling. This goes part of the way to answer two important questions – the level where higher energy prices accelerate the view that headline inflation may reverse higher again. And, whether higher oil prices become an outright negative for equities.
It appears that while we are closer to that tipping point, it feels like it may take a break of the psychological $100p/b to change the risk dynamic.
For now, longs in Nat Gas seem the right position, knowing the clear near-term risk/catalyst is headlines on strike action in W.A.

part 2 of 7 natural gas & mega cap tech and QQQ SPYnatural gas weekly uptrend still intact key battle zone now

Natural Gas Forecast | Price Trend GuideWeekly bounce off 50% fib retracement good sign for the bulls
weekly uptrend still intact, now we have a big enough bounce for bulls to try for the daily uptrend change

Natural Gas - BullishWith the current clima, demand for natural gas for AC-cooling, there is a good foundation for a bullish move in Natural Gas.
1. Lets see a move upwards to the 2.8
2. Maybe a slight pullback
3. And then the big move towards the 3-3.05 level
Also bakced by the fact that Buffet have bought into LNG so lets see if the trend can hold.
Good lucK!
NLong

Natural Gas Forecast | Gold & Silver Analysis- natural gas bulls holding above 2.66
- Natgas resistance at 2.8 & 2.86 zone
- natural gas stock currently in a daily and weekly uptrend.

Natural Gas Forecast | Detail Price Level Trend Guide- Natural Gas confirm its daily uptrend
- broke bullish out of the equilibrium wedge that has been chopping around for months.
- Ideally for bulls we re-test the wedge and bounce off of it
- for bears they would want it to break back into it

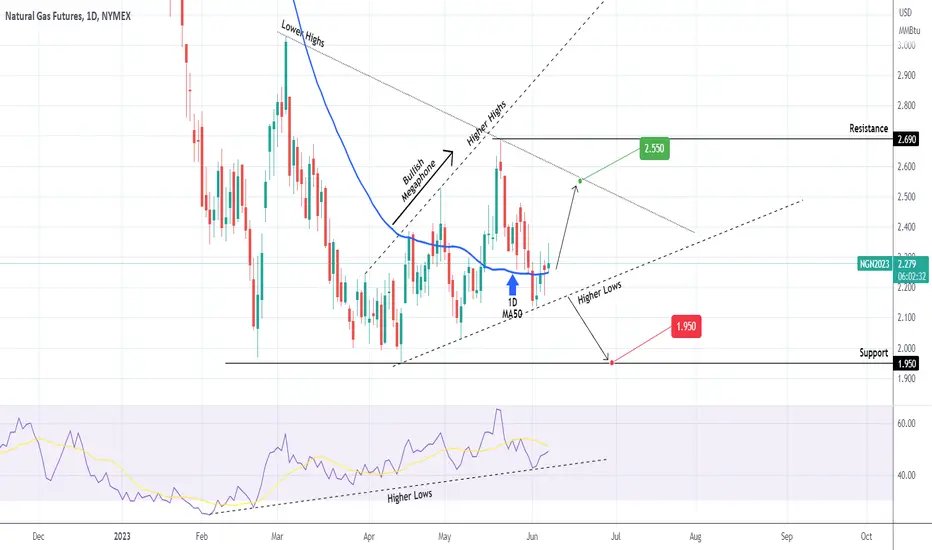
NATURAL GAS Buy signal unless this Higher Lows line breaks.Natural Gas (NG1!) is trading inside a Bullish Megaphone that has just priced its new Higher Low. The price is above the 1D MA50 (blue trend-line) and has started the new leg to a Higher High. Before that however, it has several Resistance levels to overcome, namely the 2.690 Resistance and before that the Lower Highs trend-line. As a result we are buyers but set a target below that level at 2.550. If instead the price closes a 1D candle below the bottom (Higher Lows trend-line) of the Megaphone, we will sell and target the 1.950 Support.
It is worth mentioning the 1D RSI that has been trading on Higher Lows since February 03, an early Bullish Divergence signal against the downtrend's Lower Lows for the price. This momentum continues to favor buying on the medium-term.
-------------------------------------------------------------------------------
** Please LIKE 👍, FOLLOW ✅, SHARE 🙌 and COMMENT ✍ if you enjoy this idea! Also share your ideas and charts in the comments section below! **
-------------------------------------------------------------------------------
💸💸💸💸💸💸
👇 👇 👇 👇 👇 👇
NATGAS BOIL NG Bottoming formation.Natural gas has been basing for a few months now in what has become a very recognizable Wyckoff accumulation pattern. Complete with high volume on the start to low volume towards the end. Breakouts occur on LOW VOLUME in accumulation phases so don't look for volume to give a clue. Just like the AMEX:SPY and NASDAQ:QQQ markets did at the October bottoms. Remember everyone saying how low the volume was? Yes, same here. We also see a very recognizable MEGAPHONE BOTTOM specifically on BOIL. This is regarded as a bullish signal showing that the existing downtrend may reverse to start a new UPTREND. Further, we see evidence in arcs of a possible bottom. EW counts also suggest the bottom is in for now.

NatGas UNG Detail Trade Plan With Support & Resistance Levels- UNG falling wedge still intact
- potential lacking follow through on the bears on Friday
- Natural Gas needs to confirm 1h uptrend as their very first step

$BOIL #NG Buy the dipI've been bullish and trading natural gas (BOIL EQT RRC) for a while now and recently sold on the last pump to 2.6
I'm reloading now, as I'm looking at a few things technically I like
-Price appears to have found support on a flattening 20DMA , and will next watch to see if we start trending up
- The low in May was higher than April , and almost forming a rounded base if we can sustain higher than May's low , it will be a good sign
- Strong support at 2 putting in a triple bottom now - even if we go lower, in the longer term as long as we stay above 2 , your entry of say 2.15 won't really matter when we're at 5 !
- EQT and RRC are both flagging and keeping their gains so far, looking for more upside , which of course depends on NG but is providing bullish confluence .

KOLD drops with Natural Gas RisesOn the daily chart KOLD has been testing resistance since February with a single touch in
February , a head and shoulders in April and a double top in early May. It is now retracing
due to the rise in natural gas prices in the past 10 days. A support line from a prior
retracement in early March is drawn at 41.45. This analysis is further supported by the zero-lag
MACD oscillator. I will take a trade of put options but short selling is another alternative.
Once in the trade, a signal to close will be the red zone outside the bands as was the case
in late February. The actual sell signal being the thick MACD black line inflecting from moving
downward to upward. KOLD could drop 80% from the present price down to the POC line of
the volume profile at about $ 12.50. If leveraged with put options this could represent
a 5X profit or better. Any sustained rebound in natural gas prices will lend heavy support to
this idea. IF a trader wants to capture smaller moves albeit at the risk of getting into a chop
zone, a smaller time fram such as 30-120 minutes could be used.

Will WTI follow Natty into the basement? Is WTI going to suffer the same fate as Natural Gas ? Endearingly referred to as Natty ? Well the good ship Natty got REKT last week. The long side which was overcrowded, overleveraged caught the "to da moon" bagholders off guard . Stunned whilst spitting out the kool aid they were seen gasping for air when the dead cat bounce rocked the boat ., Natty was batterred and was last seen heading into shallow water dangerously close to the rocks . Choppy water ahead alert the marine units.
The setup on CL very same chart right before the dump so spread out grab your umbrellas !!!
The trade : Let price action have the final say on your entry get the best price you can very important! Patience pays when shorting! Monday may get some purchasing for the week early on so shorts may get pinched a bit before any ride either way. Wednesday the EIA inventory numbers are relesed at 10:30 EST. OPEC meeting also this week I believe so expect volatility. Sell 83.60 & higher use stops longer time frames target 59.50 might be best move of the year if it goes. Record or near record inventory build over the last month so stay tuned! Not a trade recommendation or a reccomendation to buy or sell securites of any kind.

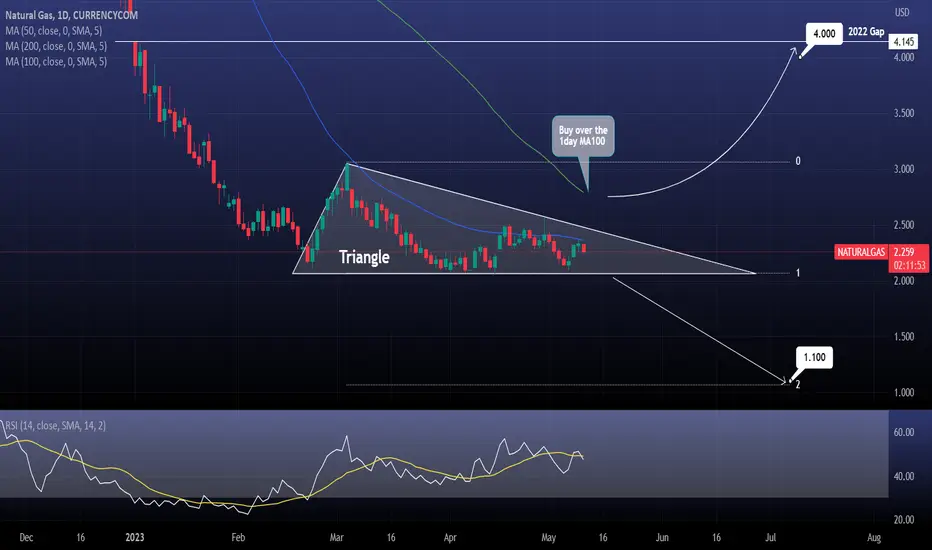
NATURAL GAS The Triangle's breakout will determine the trendNatural Gas is trading inside a Triangle, with the 1day MA50 as the Resistance.
The critical level is the 1day MA100. If the price breaks above it, target the gap from 2022 at 4.000.
If the price crosses under the Triangle's bottom, target Fibonacci 2.0 at 1.100.
Follow us, like the idea and leave a comment below!!
N
NATGAS, Accumulation mode is definitely ON before x4 by DecemberNATGAS weekly data is conveying massive accumulation at the current price range of 2.0 to 2.2.
Target by Winter/December will be a 6.0-8.0 price range.
TAYOR.

The Hard Boiled BOIL Bulls could catch a breakWho says you can't chart 3X leverage?
Got a nice down channel here and about to hit the bottom of the channel.
4.20 at the end of next week would be a nice price.
That would be over a 96% drop from the top. Interestingly, the previous peaks in Nov 2018 and Feb 2014 dropped just over 96% before touching the channel bottom.
Could overshoot below since it overshot out at the top.
Also could bounce early like that small bounce in Dec 2015, before tanking lower and tapping the channel.
Lots of breakout potential in the RSI.
Feeling like there's going to be some crazy times ahead... if things aren't crazy enough.
