NATURAL GAS: PRICE ACTION , NEW BULLISH IMPULSE COMING...Welcome back Traders, Investors, and Community!
Check the Links on BIO and If you LIKE this analysis, Please support our Idea by hitting the LIKE 👍 button
Traders, if you like this idea or have your own opinion about it, please write your own in the comment box . We will be glad for this.
Feel free to request any pair/instrument analysis or ask any questions in the comment section below.
Have a Good Day Trading !
Ng!

NATURAL GAS Time to start selling?Natural Gas has been one of the most profitable trading assets of the year offering great returns to our long-term portfolio. On a long-term scale though (1W time-frame on this chart) it has starting to form a peak pattern, which we have seen previously in the past 20 years.
I've plotted the Sine Waves on the chart to more efficiently illustrate NG's long-term cycles. Currently it is within a Bull Cycle having formed a Golden Cross (MA50 crossing above the MA200) in June. However after every 1W Golden Cross since 2000, the market made a Top shortly after. We have three very clear cyclical occasions as you see on the chart. On top of that the current 1W RSI sequence is very similar to these past top formations.
Our thesis is that Natural Gas has or is very close to forming a long-term Top and we are starting to take sell positions on that market.
** Please support this idea with your likes and comments, it is the best way to keep it relevant and support me. **
--------------------------------------------------------------------------------------------------------
!! Donations via TradingView coins also help me a great deal at posting more free trading content and signals here !!
🎉 👍 Shout-out to TradingShot's 💰 top TradingView Coin donor 💰 this week ==> Vergnes
--------------------------------------------------------------------------------------------------------

Natural GasNatural gas has completed the retracement in Thursday and return back to the bearish trend.

BTC - Press Your LuckThe Potential for a Squeeze in BitCoin is rising. 30,000 lets go and Sellers will
indeed press their luck should it fail.
Selling throughout the EU Session has gained momentum as the VIX broke it's
UTL by 4 Ticks.
We had issued a cautious note on Indices into July 20-22, 2021 as tensions were
beginning to mount in the South China Sea.
RTY has failed IT Support, ES Fails at 4251, YM 34,000 - NQ 14313.50.
CCRV has been indicating a Pullback in the Commodity Complex as the Curve
appears to be heading South once again.
Presently, we are anticipating a minor retracement at some point today, perhaps
when the EU Session closes up into 11:30AM EST.
Should Selling continue unabated, we anticipate BRC losing 30K this week and
heading to out open Target of 24955. 36,000 should contain any ST Squeeze as
the Sell Side of the BTC trade is becoming crowded.
NG has been a stellar counter-trend trade to CL, $4 appears to be in play.
Remembering when NG traded from $1 to $21 - brings back memories.
OGZPY (Gazprom) would continue its trend to $20 over the longer term time
horizon.
The VIX has made a new high just now and is now targeting the 22.75 Level.
It's going to be a sporty day indeed, right on time :)

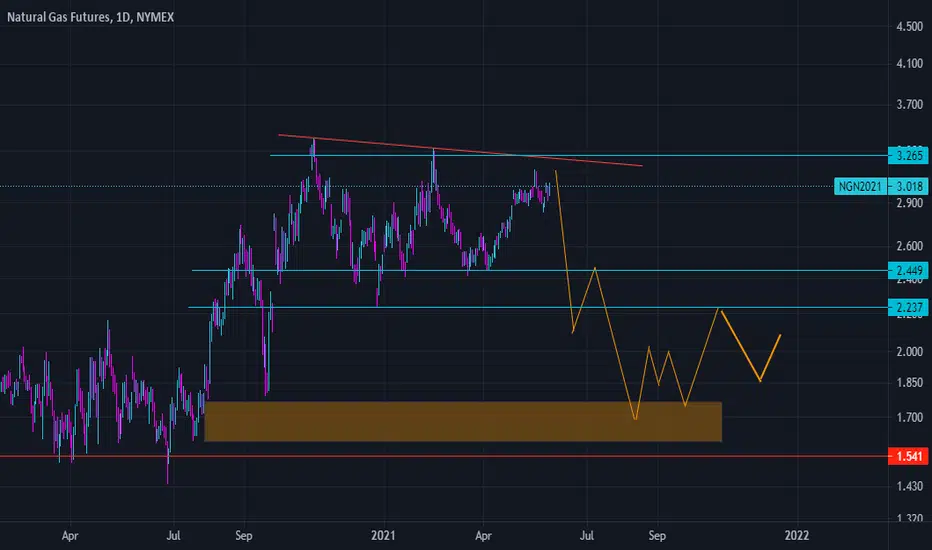
NATURAL GAS approaching the ultimate long-term sell levelI've first published this chart 2 years ago on Natural Gas' 2 year cycles within a +10 years Channel Down. As you see this pattern is holding up to this day and in fact following the aggressive rise of this year (and of Q2 in particular), it becomes more relevant than ever.
The time-frame is on the weekly (1W) of course to grasp as much of the long-term price action as possible and right now is has just formed a Golden Cross (when the 1W MA50 (blue trend-line) crosses above the 1W MA200 (orange trend-line)). This is technically a bullish formation as it shifts momentum from bearish to bullish long-term.
However within this 10 year+ Channel Down, Golden Crosses have been formed closer to peaks than bottoms. It is therefore no coincidence that the price has already entered the Sell Zone of the Channel Down and is currently approaching its Lower Highs trend-line.
I've applied also the Sinewave indicator and it seems very consistent with NG's cyclical behavior within this Channel Down. Even though this Cycle's Top (Lower High on the Channel Down) can be priced anytime within 2022, the price level won't be much higher than the current.
Long-term traders and investors should take this opportunity to sell and comfortably wait for (much) lower prices in 2024 before buying again. Such consistent long-term patterns don't come around that often.
** Please support this idea with your likes and comments, it is the best way to keep it relevant and support me. **
--------------------------------------------------------------------------------------------------------
!! Donations via TradingView coins also help me a great deal at posting more free trading content and signals here !!
🎉 👍 Shout-out to TradingShot's 💰 top TradingView Coin donor 💰 this week ==> chrissmith98
--------------------------------------------------------------------------------------------------------

NEW POSITION $NG Target 10.09 for 23.20% $NG Target 10.09 for 23.20%
Or double position at 6.29
That's one heck of a dip right there. I don't love trading gold so I took a smaller than normal position here... but it looks like it has a nice range.
—
On the far right of the chart is my Average (Grey) Current Target (Green), and Next Level to add (Red) Percentage to target is from my average.
I start every position with 1% of my account and build from there as needed and as possible.
I am not your financial advisor. Watch my setups first before you jump in… My trade set ups work very well and they are for my personal reference and if you decide to trade them you do so at your own risk. I will gladly answer questions to the best of my knowledge but ultimately the risk is on you. I will update targets as needed.
GL and happy trading.

Ng short set upwait for tag of trendline or scale in short below... stops above 1st high... Price is above 200 day ma, this is a counter trend trade, so better to start small and add along if it works. targets shown below... beware of 200d ma , and how it behaves 'round there to access the trade's probabilities.
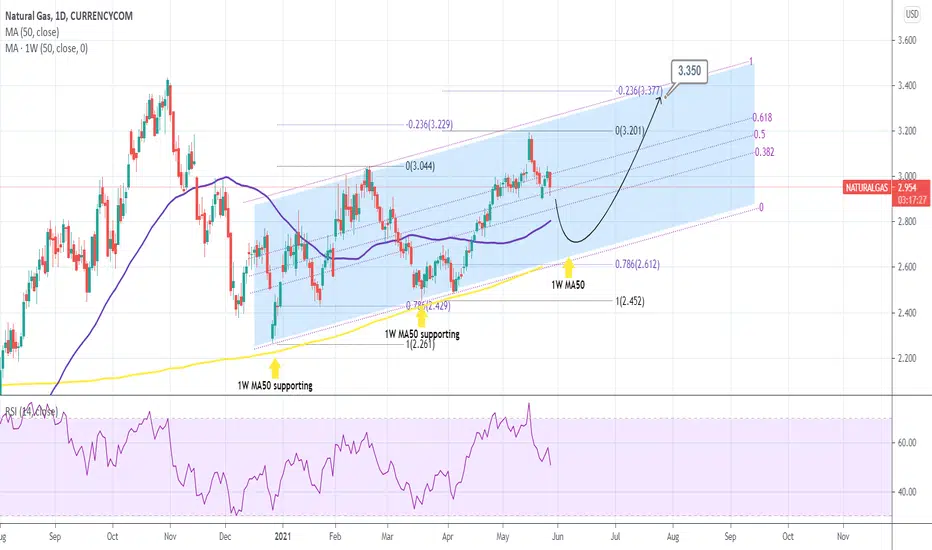
NATURAL GAS Action PlanPattern: Channel Up on 1D.
Signal: Buy within the 1D MA50 (blue trend-line) and the 1W MA50 (yellow trend-line).
Target: 3.350 (just below the -0.236 Fibonacci extension).
Most recent Natural Gas signal:
** Please support this idea with your likes and comments, it is the best way to keep it relevant and support me. **
--------------------------------------------------------------------------------------------------------
!! Donations via TradingView coins also help me a great deal at posting more free trading content and signals here !!
🎉 👍 Shout-out to TradingShot's 💰 top TradingView Coin donor 💰 this week ==> CryptoSurfer007
--------------------------------------------------------------------------------------------------------
N

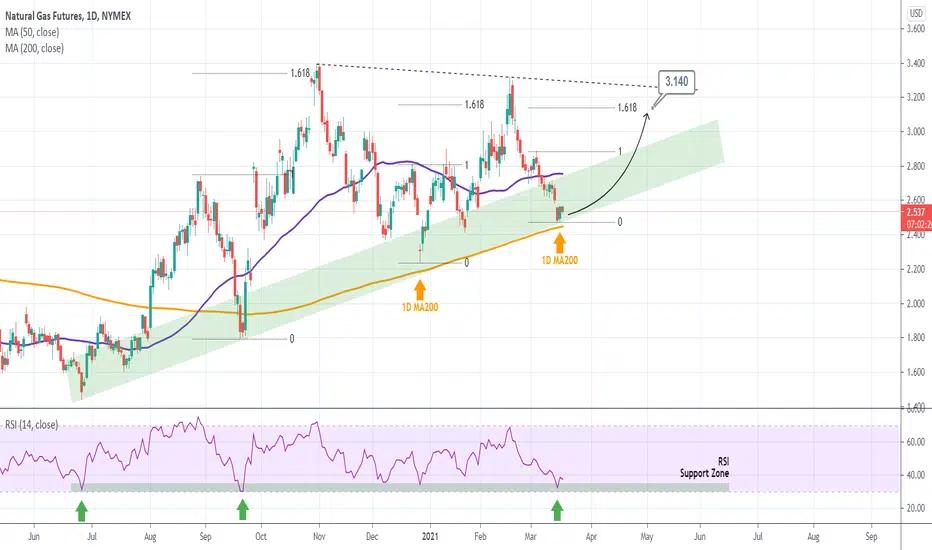
NATURAL GAS 1st Higher High since mid February. Buy.Pattern: Triangle on 1D.
Signal: Buy as the price has rebounded on the 1D MA200 (orange trend-line) and formed the 1st Higher High since February 17. After a Higher High, a rally was always followed since July 2020.
Target: 3.140 (the 1.618 Fibonacci extension ).
Most recent signal on NG:
** Please support this idea with your likes and comments, it is the best way to keep it relevant and support me. **
--------------------------------------------------------------------------------------------------------
!! Donations via TradingView coins also help me a great deal at posting more free trading content and signals here !!
🎉 👍 Shout-out to TradingShot's 💰 top TradingView Coin donor 💰 this week ==> kylevd23
--------------------------------------------------------------------------------------------------------


NATURAL GAS Buy SignalPattern: Triangle on 1D.
Signal: Buy as the price has found support just above the 1D MA200 (orange trend-line) and within the 8-month Higher Lows Zone (green). The RSI also hit its own Support Zone.
Target: 3.140 (the 1.618 Fibonacci extension).
** Please support this idea with your likes and comments, it is the best way to keep it relevant and support me. **
--------------------------------------------------------------------------------------------------------
!! Donations via TradingView coins also help me a great deal at posting more free trading content and signals here !!
🎉 👍 Shout-out to TradingShot's 💰 top TradingView Coin donor 💰 this week ==> xBTala
--------------------------------------------------------------------------------------------------------
SELL NATURAL GAS BELOW 9 EMA FOR 200 EMASELL NATURAL GAS BELOW 9 EMA FOR 200 EMA CONSIDERING UPCOMING SHORTAGE IN DEMAND DUE TO DECRESING COLD IN UPCOMING WEEKS.
NShort

SELL NATURAL GAS BELOW 9 EMA FOR 200 EMANATURAL GAS PRICE HAS BOUNCED FROM 9 EMA ON DAILY CHART. THE BOUNCE WAS ALSO SUPPORTED BY COLD STORM STARTED ON THURSDAY. THE BOUNCE WAS NEUTRALISED BY THE DOUBLE HEAD FORMATION AND SELLING HAS ALREDY BEGUN. I MY VIEW SHORT POSITION CAN BE OPENED BELOW 9 EMA FOR 200 EMA TARGET CONSIDERING LESS DEMAND IN COMING WEEKS.
NShort

Key Trendlines, Support and Resistance Levels in Natural GasDisplayed here on the 4h chart are key trend lines noteworthy in NG during the past year which offer suggestions of imminent support and resistance.
What's interesting is how the 200d SMA (blue line here) has merged perfectly with a trendline established 21/22 Sep (red line). The SMA and trend line have acted as a support line and provided a window for NG price trend range - see how the SMA has bound to the trend line as if they were one and the same.
Also interesting is how the Linear Regression channel, shown as dotted lines here, is also well aligned with the trend lines in the same way. Other trend line possibilities I've shown here (yellow and dark red) illustrate potential alternative variant support lines.
The 100d SMA (orange line) is currently holding us where we are now and explains where we have settled today despite a number of attempts at a breakout. If we drop from here, we may look for the 200d SMA level as support - likely within the timeframe provided by the green line. This is likely to fall indirectly and over time rather than suddenly as a particularly cold snap of weather is due to hit the US by the 27th Jan.

Long on National Grid #NG.NG.
- MACD sloping UP
- RSI at reasonable level
- Buy price @ £ 861.4
- 1st target @ £913.0
- 2nd target @ £ 954.4
- Stop loss @ £ 811.4


NATURAL GAS broke the 1D MA50 after +2 months.Last time NG crossed that level was on November 03. But last time it did so coming below with the 1D MA50 as a Resistance, was on July 28 and before that March 09.
On both occasions, the after the break-out, an approximately +20% rise followed. In addition, the RSI just broke the trend-line which also broke during those two events. Everything points towards a Natural Gas value around 3.300.
Most recent NG signal:
Please like, subscribe and share your ideas and charts with the community!
--------------------------------------------------------------------------------------------------------
!! Donations via TradingView coins also help me a great deal at posting more free trading content and signals here !!
🎉 👍 Shout-out to TradingShot's 💰 top TradingView Coin donor 💰 this week ==> ProjectSyndicate
--------------------------------------------------------------------------------------------------------

NG: UNG: BOIL: Natural Gas Rebounded on Feb 2021 RollNatural Gas prices rebounded after dropping earlier in the week from $2.5 to $2.25 on warm weather. Prices rebounded on tight balances, oversold technical conditions,
and roll into February 2021 contract. Support is expected to hold, as LNG flows are above 11 Bcf/d and balances are tight, with last draw at -152 Bcf.
Technical Analysis: 4 Hr chart shows oversold condition. Support is seen at $2.25. However, double bottom is still possible, before going higher around January 10.
Potential price target for the next leg up is $2.75 - $2.8. Upside potential for NG and BOIL may be limited due to roll into lower March 2021 contract on January 22 -27.
Fundamental Analysis: Bullish picture with tight balances and potential for a deficit is possible going into 2021. Lower 48 state production lost -4 Bcf/d vs. 2020,
while gas exports increased +4 Bcf/d, resulting in net increase in demand of 8 Bcf/d. Lower 48 production is expected to remain at 91 Bcf/d, while LNG flows and
Mexico exports will total 16 Bcf/d. HFIR energy believes, that forward curve is underpriced at avg. of $2.58/MMBtu. Should weather turn colder after January 11, 2021,
as projected by NatGasWeather, we may see NG prices bounce back to $2.7-$2.8 levels. Cash prices are likely to go much higher during winter. However, NG and BOIL,
will start rolling into lower March contract around January 22 -27, which may bring futures prices back to their current support level at $2.3-$2.5 at that time.
Overall picture for NG in 2021 is bullish, given lower production and higher LNG demand and exports remain in place. Traders are bullish EQT and BOIL (day trade).
Short sellers will still have their opportunities on selling 4 Hr tops. KOLD is an inverse daily ETF, that does well during March - April contract timeframe.

NATURAL GAS Hit the 4 month Support. Conditions for a rebound.NG almost made contact with the 2.440 level today, which has been the major Support since August 21. So far we have 3 perfect touches on the Support, which alone creates the conditions for a strong rebound.
A closer look on the 1D time-frame shows that this pattern resembles the March - June 2020 sequence, when NG also made 3 hits on the Monthly Support. As with now, the price was also coming at that time from a 1D MA50 rejection (turned into a Resistance after previously being a Support). Once the 1D MA50 broke and after a final pull-back, the very aggressive rally of August - October took place. The RSI patterns are also similar. I am carefully buying now and after the MA50 breaks, I will add on the next available pull-back the remaining of my position. The long-term target is 3.400.
P.S. It is always helpful to keep a longer-term perspective, having in mind NG's multi-year Cycles within the Channel Down, as shown below:
** Please support this idea with your likes and comments, it is the best way to keep it relevant and support me. **
--------------------------------------------------------------------------------------------------------
!! Donations via TradingView coins also help me a great deal at posting more free trading content and signals here !!
🎉 👍 Shout-out to TradingShot's 💰 top TradingView Coin donor 💰 this week ==> TradingView
--------------------------------------------------------------------------------------------------------
NLong

NG: UNG: boil: Natural Gas Looking for a Bottom - Mid DecemberNatural Gas futures dropped disproportionately to fundamentals on lower national demand in the first half of December and slightly higher recent production.
However, NatGasWeather forecasts for the storage draw covering next three weeks are not as bearish as the drop in gas prices. LNG flows are consistently
bullish exceeding 10.5 bcf/d. The fundamentals are still strong. It seems that bullish traders are waiting for colder weather patterns to settle in before driving
prices higher.
If we get the forecasted warming next week, the prices may go lower. Expected trough at around December 9-12.
Technicals: The 4 Hr chart is oversold. Yet, this condition may persist for another week. The double bottom is more likely before going higher.
Per NatGasWeather Report:
EIA Weekly Nat Gas Storage Report Outlook: EIA Weekly Report
Week 1 – December 10 -70 to -80 Bcf Slightly Larger vs Normal Draw
(Nov 27-Dec 3)
Week 2 – December 17 -80 to -90 Bcf Slightly Smaller vs Normal Draw
(Dec 4-10)
Week 3 – December 23 -85 to -100 Bcf Slightly Smaller vs Normal Draw
(Dec 11-17)
NatGasWeather.com Forecast
5-Year Average -61 Bcf -105 Bcf -127 Bcf
