NG

NatGas/Gold Ratio - Monthly Log ScaleChart reflects a symmetrical triangle reversal pattern. Long-term general outlook - natural gas up, gold down.

Natural Gas (NG) Technical CycleBear in mind that this is subjective. The chart is an attempt to identify a peak/trough cycle and highlight where price is currently.

Squeeze on Nat GasSecond Analysis on NG, Last target was too optimist and took some breathing, loooking for a small push

Short Term Bullish for Natural Gas Short term move to the upside for ugaz. Then i expect a big drop. will post once we need completion.

First published Idea of #natgasJust looking for a bounce around 2.28 on Jan contract. read about at ngetf.com
This is my first post and I need to get in the kitchen and cook some bacon and eggs. so long

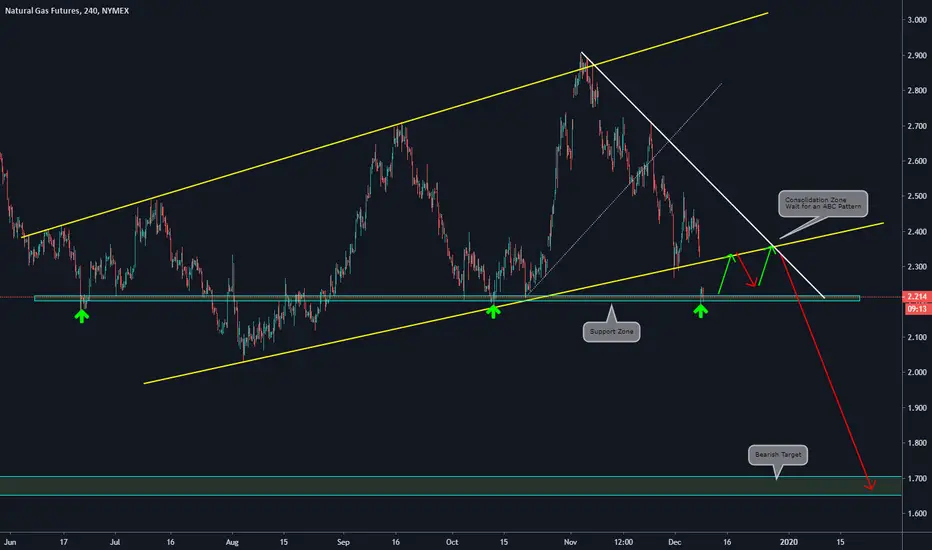
Multi-Timeframe Analysis / Natural Gas Futures by ThinkingAntsOkUse this as a guide to develop your view:
Main items we can observe on the 4HS chart:
a)Price has broken the primary structure (yellow lines) with a bearish movement
b)The price found support on the 2.20 level
c)We Expect an ABC formation with a pullback to the broken structure
d)If the ABC formation happens, we forecast a continuation of the bearish movement towards the next support zone at the 1.7 level
Daily Vision:
Weekly Vision:
Flatulence is naturalColder and more snow than normal in the areas that drive demand, but is that enough to eat the surplus?
Daily
Support is holding @19.21, 9cent's below the daily setup trend @19.30
Weekly
mostly negative to neutral
Monthly
Patterns
Inverted Hammer on an 8 downtrend = Bullish in a downtrend
Star Doji = Bullish in a downtrend
Gravestone Doji = Bullish in a downtrend
Weather Forcast

UNG (natural gas ETF) 16% up 24% down... My intention was to analyze the NG exchange rate. Even so, I still chose his ETF. The fractal motion is much more visible in this. That is why I would like to present this. It is clear from the movement of the exchange rate that Friday's big fall (7%) was an expected process. The figure clearly shows that a fractal sequence has been completed. It is also clear that the original fractal is copied in a 2: 1 ratio. This copy has been slow for a month now. Therefore, I assume that further movement follows similar regularity. This means that NG and its ETF will turn north in the coming days. The ETF may increase by 16%. But from that level, another decline may begin. Nearly 24%. I am expecting the bottom of the ETF to be 15.44 usd. Then the most interesting thing happens. I assume that NG can start an amazing rise after 14 years. I also recommend this for a longer term investment.


NATURAL GAS - Head & Shoulder BREAKOUT!Price just broke out of our inverted head and shoulder neckline. We are expecting price to have a minor retest before rocketing to the upside.
We may find our first level of resistance @ ~2.45. We are targeting the upper 2.60's.
For entries, we will be waiting on lower time frames for a retest of neckline before going long.

EASY Head and Shoulders on Natural Gas. perfect head and shoulders with a tiny shoulder. he needs to work out both arms
scared money dont make money

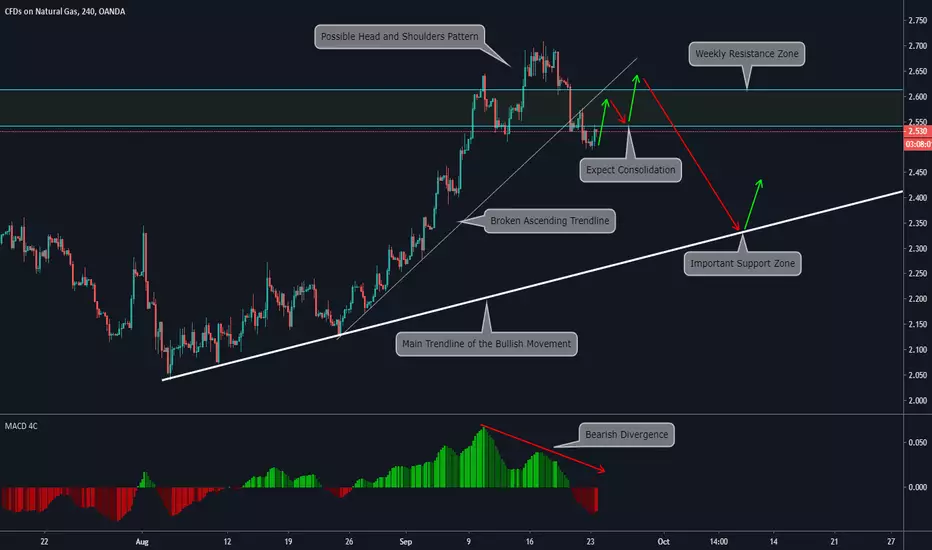
Top and Bottom Analysis on Natural Gas by ThinkingAntsOkUse this as a guide to develop your own setup
Main items we can see on the 4hs chart:
a)The price is against a Weekly resistance zone
b)We saw a clear rejection of that level
c)On MACD we can see a bearish Divergence showing the weakness of the current bullish movement
d)The current ascending trendline was broken
e)We will wait for an ABC pattern o something similar, the objective is to have a consolidation on the shown area
f)If that structure is made we will consider it as a clear Zone to short NATGAS towards the Main trendline of the bullish movement
Check the Higher timeframe analysis to make more sense of the 4hs chart
WEEKLY CHART:
DAILY CHART:
NATGASUSD Wolf PatternNATGAS could be in complete wolf pattern, moving of wave No 5 out of the descending channel make me believe that is bullish wolf, target must be point No 6

Will Natural Gas futures continue to fall? Here is my viewTable of contents:
§ 1 Chart analysis
§ 2 Fundamentals
§ 3 My plan to enter
§ 1 Chart analysis
Looking at the NG!1(LNG futures) price, it's quite easy spotting the giant downward channel that price has been moving within for a while now.
As you likely already know, if you are a conservative trader like I am you would look only to take shorts at this point at the top of the channel, but in this case, things might be a bit different...
§ 2 Fundamentals
Now although looking strictly at the chart you would of course look to take shorts on the top of the channel, however, as I have mentioned in my FLNG analysis, China and India are planning on going from Coal heating to Natural Gas heating .
With that said, as we are currently moving away from summer and I predict colder weather will hit these countries within the next month, we might see a change in direction of price in NG as demand rises. Historically we have seen up to a 100% price increase during the winter, as that is when we have the most demand for heating.
§ 3 My plan to enter
I will be looking to enter short if price rejects upper channel and creates a regular divergence with the RSI, and I will enter if the price closes below the 50 EMA.
I will be looking to enter long if price breaks trough the upper channel, and we are met with a hidden divergence.
Another possibility is price retracing partly downward after rejecting top channel but not reaching the bottom of the channel, in which case if we get a regular divergence close to a previous support I will be looking to go long again, or atleast exit my trade.
Hope you found this helpful and good luck with your trading, although, if you trade based on luck you are already screwed.
Have a good day everyone

Natural Gas Daily About To Break Out Of Falling WedgeThe $NG daily has been doing battle with the 50dsma for 8 months. The falling wedge is about to explode to the upside.

Natural Gas Needs a Gap UpThe natural gas daily has been unsuccessfully trying to beat the 50dsma for 5 months now. A gap up may be needed to beat the 50 and the falling wedge.

Gold Where you going? UH UH! GET BACK DOWN!Please gold bugs look at the charts of oil and gold. As one hits the top the other hits the bottom. The breathing in and out of the world economy. The exhale is coming! Make sure to look at my $1500 call I just published linked below

NATURAL GAS | SELLPerfect Short Entry for Natural Gas.
Its in Sellzone for this weeks pivots, next weeks pivots and this months pivots and it also rejected resistance and also top of channel.

Long Trade Idea on Natural Gas + Weekly view by ThinkingAntsOkUse this as a guide to develop your own setup
Main items we see on the 4hs chart:
a)Price is inside a descending channel
b)On MACD we can see a bullish divergence in the inner waves of the descending channel
c)On a closer look, we can see that the price broke out from the descending trendline and now is leaving a Pin bar on the zone
d)We will wait for a retest of the broken descending trendline and an ABC structure (like flag patterns) before taking long setups
e)Currently, this is just a trade idea we need to wait for more confirmations before opening positions.
Weekly vision:

Looking for a significant bottom in NGlittle bit lower is the most probable scenario but I’m looking for a bottom in the 2.00-2.1 region and a big rally into end of year
** Just an idea, NOT a forecast

NG bottomed? The strong rally today suggests that NG low of the year might be in, bullish divergence in play, biggest hurdle would be a close above last swing high at 2.488
* seasonally NG bottoms in the last week of July, so looks good timing wise
** Just an idea NOT a forecast

5 reasons to be bullish on Natural Gaz / $UGAZ1. Natural gaz is very weather dependent and seasonal. In the last 20 years, natural gaz went up 14 out of 20 times between Aug and Nov. The exceptions were (2000, 2005,2008, 2010, 2011 and 2015).
2. In the last 20 years, natural gaz was above $2.25 98% (eye ball) of the time. As you can see on the chart, $2.25 is a clear floor.
3. Adjusted for inflation for 20 yrs at 1.5% inflation rate, this floor should be in the $3.00 range in 2019.
4. Average price in the last 20 yrs has been around $4.50 ish. There is lots of room above!
5. With the FED's dovishness, the dollar will start softening soon. It may creep up a few more days but it will come down. Commodity will then have upward price pressure.
The price is falling at the moment. I would like to see it stabilize first but this looks like a pretty good odds trade to execute some time in August, below $2.25. The question is, ...How low can it go? My advice, keep an eye on it...
The above are only my opinions and are not a trading advice. This is just something to get you thinking... an idea, THAT'S ALL! I am not responsible nor liable for any financial losses you may incur following my ideas. Also know that leveraged ETFs such as UGAZ carry additional risks. READ the prospectus! Do your own analysis and due diligence PLEASE!
Good luck to all!
