Options Blueprint Series [Intermediate]: Lunar Timing and ThetaIntroduction
This edition of the Options Blueprint Series focuses on gold futures and micro gold futures, using an iron condor options structure to explore how time decay (theta) can be positioned in an environment where signals conflict rather than agree.
Gold has been trading at elevated levels, attracting strong participation from momentum-driven traders while simultaneously showing signs of short-term exhaustion. This creates a valuable learning environment for options traders, particularly those interested in non-directional strategies that rely more on time and range behavior than outright price direction.
This article is presented as a case study. All tools, indicators, and trade structures discussed are used for educational purposes only. Lunar timing, in particular, is included as a belief-based analytical lens used by some market participants, not as a predictive mechanism.
Market Context: Gold at Elevated Levels
Gold futures have experienced a powerful rally since the reopening of U.S. Sunday evening trading hours, extending an already strong longer-term uptrend. Price is now operating at new all-time highs, a condition that often amplifies emotional behavior among trend followers.
In such environments, markets frequently display two competing forces:
Continued upside pressure driven by momentum and fear of missing out
Short-term vulnerability driven by overextension, crowding, and mean-reversion dynamics
Rather than attempting to resolve which force will dominate, this Options Blueprint explores how options structures can be used to frame uncertainty itself.
Analytical Inputs Used in This Case Study
This framework combines multiple analytical perspectives. None are presented as definitive signals; instead, they are used to illustrate how diverse inputs can shape options structure selection.
Lunar Timing (Moon Phases Indicator)
The chart highlights waxing and waning moon phases:
Waxing moons are displayed in blue
Waning moons are displayed in gray
The current market condition coincides with a waxing moon phase, which some traders interpret as a potentially bearish timing window. It is important to stress that lunar analysis is belief-based, not empirically causal. Its inclusion here is intentional for educational diversity and contextual layering, not validation.
Bollinger Bands® on Multiple Timeframes
Two Bollinger Bands® sets are applied:
One based on the daily timeframe
One based on the weekly timeframe
Price is approaching, and in some instances penetrating, the upper bands on both timeframes simultaneously. This alignment often signals volatility expansion and late-stage trend behavior, increasing the probability of range stabilization or consolidation, even if the broader trend remains intact.
RSI and Divergence
The Relative Strength Index is set to standard parameters: Length = 14
A bearish divergence is visible, where momentum fails to confirm new price highs. Notably, the
RSI length coincides numerically with half of a lunar cycle. This coincidence is observational only and does not imply a functional relationship.
Structural Support Below Price: UFO Context
Below current price, the chart highlights UFOs (UnFilled Orders) clustered near 4,527. These represent areas where prior price discovery was incomplete, often acting as zones of liquidity and structural interest.
This region introduces an important counterbalance:
While short-term indicators lean bearish
Structural market mechanics suggest potential downside cushioning
This combination reinforces the idea of a bounded market environment, rather than a clean directional thesis.
Why an Iron Condor Fits This Environment
When markets present conflicting directional evidence, strategies that benefit from price containment and time decay become particularly relevant.
An iron condor:
Does not require a bullish or bearish forecast
Defines risk in advance
Benefits from theta as time passes
Allows strike placement around known volatility and structure zones
In this context, the iron condor serves as a framework for uncertainty, not a directional expression.
Iron Condor Structure (Illustrative Example)
This case study uses a January 27 expiration within the GCG contract cycle.
Call Side
Short 4,850 call
Long 4,900 call
Put Side
Short 4,500 put
Long 4,450 put
The strikes are positioned at approximately equal distance from current price, with the downside aligned near known UFO structural support.
Key Characteristics
Net theoretical credit: approximately 10.3 points
Theoretical maximum risk: approximately 39.7 points
Lower break-even: near 4,490
Upper break-even: near 4,860
As long as price remains within this range through expiration, the structure benefits from time decay. If price exits the range, losses are predefined and limited.
Theta: Time as the Primary Variable
In short-option structures, theta becomes the dominant driver of performance when price remains stable.
Key educational takeaways:
Theta accelerates as expiration approaches
Time decay is not linear
Volatility changes can amplify or offset theta
Direction matters less than location and pace
This structure highlights how patience and risk definition often matter more than directional conviction.
Managing an Iron Condor
There are many ways traders manage iron condors as conditions evolve. Without going into procedural detail, common approaches include:
Rolling positions forward in time
Adjusting strikes to rebalance risk
Reducing exposure on one side of the structure
Management decisions depend on price behavior, remaining time, volatility, and individual risk tolerance.
Contract Specifications: GC vs MGC
Gold Futures (GC)
Contract size: 100 troy ounces
Tick size: 0.1
Tick value: $10
Outright margin: $22,900
Micro Gold Futures (MGC)
Contract size: 10 troy ounces
Tick size: 0.1
Tick value: $1
Outright margin: $2,290
Both contracts follow the same structural logic, allowing traders to scale exposure while maintaining identical analytical frameworks.
Margin requirements for futures and futures options are dynamic rather than fixed, meaning they may vary over time in response to changes in market volatility, price levels, and risk conditions as determined by exchanges and clearing firms.
Depending on the broker and clearing arrangements, the specific margin requirement for an iron condor is frequently set near the position’s maximum theoretical risk; in this illustrative case study, that risk is approximately 39.7 points ($397), though margin treatment can vary.
Risk Management Considerations
Even defined-risk strategies carry meaningful risk. Key principles include:
Position sizing relative to account equity
Awareness of gap and volatility risk
Understanding assignment and expiration mechanics
Options limit risk by design, but do not eliminate uncertainty.
Final Thoughts
This Options Blueprint demonstrates how lunar timing, volatility structure, RSI behavior, and UFO context can coexist within a single framework, without requiring directional certainty.
The iron condor is not presented as a solution, but as a lens through which uncertainty can be structured, with time decay acting as the central variable.
Markets rarely offer clarity. Options allow traders to respond to that reality with structure, discipline, and predefined risk.
Data Consideration
When charting futures, the data provided could be delayed. Traders working with the ticker symbols discussed in this idea may prefer to use CME Group real-time data plan on TradingView: www.tradingview.com - This consideration is particularly important for shorter-term traders, whereas it may be less critical for those focused on longer-term trading strategies.
General Disclaimer
The trade ideas presented herein are solely for illustrative purposes forming a part of a case study intended to demonstrate key principles in risk management within the context of the specific market scenarios discussed. These ideas are not to be interpreted as investment recommendations or financial advice. They do not endorse or promote any specific trading strategies, financial products, or services. The information provided is based on data believed to be reliable; however, its accuracy or completeness cannot be guaranteed. Trading in financial markets involves risks, including the potential loss of principal. Each individual should conduct their own research and consult with professional financial advisors before making any investment decisions. The author or publisher of this content bears no responsibility for any actions taken based on the information provided or for any resultant financial or other losses.
Nondirectional

Condor in the Clouds: When the S&P 500 Takes a Nap1 – The Setup Nobody Expected
The S&P 500 just pulled a classic “I’m tired” move. After that big drop, it stopped running and started hovering between 6,437 and 6,873 — a cozy sideways zone filled with Fibonacci levels, Floor Trader Pivots, and UFOs (yep, UnFilled Orders, not flying saucers).
Markets do that sometimes — they sprint, then nap. And when they nap, option sellers quietly collect theta while everyone else wonders when the action will come back.
2 – The Play: Short Iron Condor
When the market’s stuck in the middle, the Short Iron Condor is like putting walls on both sides of the price. Here’s the idea — you get paid if ES stays in between.
How it’s built:
Sell a Call above resistance
Buy a Call a little higher (that’s your safety net)
Sell a Put below support
Buy a Put a little lower (another safety net)
Boom — now you’ve boxed the market. If it behaves, you earn. If it doesn’t, your risk is capped.
3 – Why It Works Right Now
The Condor thrives when volatility chills out. That’s exactly what ES is doing — taking a breath after chaos.
Theta decay: your invisible ally, eating away at option value day by day.
Range stability: resistance ≈ 6,873, support ≈ 6,437.
Low Vega: volatility tantrums matter less.
You don’t need fireworks — you need patience. This trade doesn’t scream, it hums.
4 – The Fine Print (a.k.a. Risk Management)
Keep it real:
Size positions by max risk, not by excitement level.
Don’t wait for expiration — grab 50–60% profit and fly away.
When the market is calm, the Condor glides. When storms build, fold your wings.
5 – For the Data Nerds
If you love precision:
ES tick = $12.50
MES tick = $1.25
Margins ≈ $21k and $2.1k respectively (subject to volatility).
And yes — theta doesn’t care which one you trade; it just wants time to pass.
6 – The Takeaway
Markets don’t always trend. Sometimes they just drift — and that’s okay.
In those moments, the Short Iron Condor turns boredom into strategy.
So, if the S&P 500 keeps “floating in the clouds,” don’t chase it — collect from it.
Want More Depth?
If you’d like to go deeper into the building blocks of trading, check out our From Mystery to Mastery trilogy, three cornerstone articles that complement this one:
🔗 From Mystery to Mastery: Trading Essentials
🔗 From Mystery to Mastery: Futures Explained
🔗 From Mystery to Mastery: Options Explained
When charting futures, the data provided could be delayed. Traders working with the ticker symbols discussed in this idea may prefer to use CME Group real-time data plan on TradingView: www.tradingview.com - This consideration is particularly important for shorter-term traders, whereas it may be less critical for those focused on longer-term trading strategies.
General Disclaimer:
The trade ideas presented herein are solely for illustrative purposes forming a part of a case study intended to demonstrate key principles in risk management within the context of the specific market scenarios discussed. These ideas are not to be interpreted as investment recommendations or financial advice. They do not endorse or promote any specific trading strategies, financial products, or services. The information provided is based on data believed to be reliable; however, its accuracy or completeness cannot be guaranteed. Trading in financial markets involves risks, including the potential loss of principal. Each individual should conduct their own research and consult with professional financial advisors before making any investment decisions. The author or publisher of this content bears no responsibility for any actions taken based on the information provided or for any resultant financial or other losses.

Options Blueprint Series [Intermediate]: Gold Triangle Trap PlayGold’s Volatility Decline Meets a Classic Chart Setup
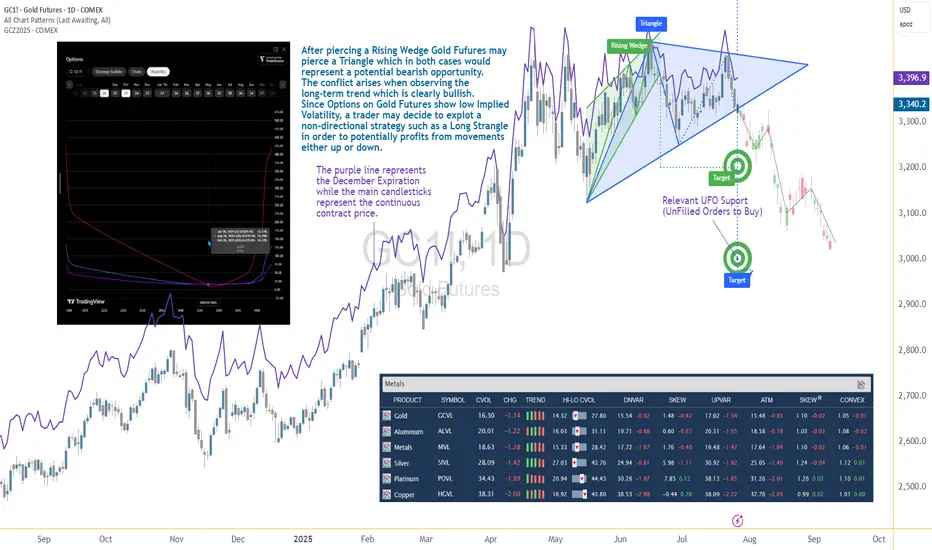
Gold Futures have been steadily declining after piercing a Rising Wedge on June 20. Now, the market structure reveals the formation of a Triangle pattern nearing its apex — a point often associated with imminent breakouts. While this setup typically signals a continuation or reversal, the direction remains uncertain, and the conflict grows when juxtaposed with the longer-term bullish trajectory Gold has displayed since 2022.
The resulting dilemma for traders is clear: follow the short-term bearish patterns, or respect the dominant uptrend? In situations like these, a non-directional approach may help tackle the uncertainty while defining the risk. This is where a Long Strangle options strategy becomes highly relevant.
Low Volatility Sets the Stage for an Options Play
According to the CME Group’s CVOL Index, Gold’s implied volatility currently trades near the bottom of its 1-year range — hovering just above 14.32, with a 12-month high around 27.80. Historically, such low readings in implied volatility are uncommon and often precede sharp price movements. For options traders, this backdrop suggests one thing: options are potentially underpriced.
Additionally, an IV analysis on the December options chain reveals even more favorable pricing conditions for longer-dated expirations. This creates a compelling opportunity to position using a strategy that benefits from volatility expansion and directional movement.
Structuring the Long Strangle on Gold Futures
A Long Strangle involves buying an Out-of-the-Money (OTM) Call and an OTM Put with the same expiration. The trader benefits if the underlying asset makes a sizable move in either direction before expiration — ideal for a breakout scenario from a compressing Triangle pattern.
In this case, the trade setup uses:
Long 3345 Put (Oct 28 expiration)
Long 3440 Call (Oct 28 expiration)
With Gold Futures (Futures December Expiration) currently trading near $3,392.5, this strangle places both legs approximately 45–50 points away from the current price. The total cost of the strangle is 173.73 points, which defines the maximum risk on the trade.
This structure allows participation in a directional move while remaining neutral on which direction that move may be.
Technical Backdrop and Support Zones
The confluence of chart patterns adds weight to this setup. The initial breakdown from the Rising Wedge in June signaled weakness, and now the Triangle’s potential imminent resolution may extend that move. However, technical traders must remain alert to a false breakdown scenario — especially in trending assets like Gold.
Buy Orders below current price levels show significant buying interest near 3,037.9 (UFO Support), suggesting that if price drops, it may find support and rebound sharply. This adds further justification for a Long Strangle — the market may fall quickly toward that zone or fail and reverse just as violently.
Gold Futures and Micro Gold Futures Contract Specs and Margin Details
Understanding the product’s specifications is crucial before engaging in any options strategy:
🔸 Gold Futures (GC)
Contract Size: 100 troy ounces
Tick Size: 0.10 = $10 per tick
Initial Margin: ~$15,000 (varies by broker and volatility)
🔸 Micro Gold Futures (MGC)
Contract Size: 10 troy ounces
Tick Size: 0.10 = $1 per tick
Initial Margin: ~$1,500
The options strategy discussed here is based on the standard Gold Futures (GC), but micro-sized versions could be explored by traders with lower capital exposure preferences.
The Trade Plan: Long Strangle on Gold Futures
Here's how the trade comes together:
Strategy: Long Strangle using Gold Futures options
Direction: Non-directional
Instruments:
Buy 3440 Call (Oct 28)
Buy 3345 Put (Oct 28)
Premium Paid: $173.73 (per full-size GC contract)
Max Risk: Limited to premium paid
Breakeven Points on Expiration:
Upper Breakeven: 3440 + 1.7373 = 3613.73
Lower Breakeven: 3345 – 1.7373 = 3171.27
Reward Potential: Unlimited above breakeven on the upside, substantial below breakeven on the downside
R/R Profile: Defined risk, asymmetric potential reward
This setup thrives on movement. Whether Gold rallies or plunges, the trader benefits if price breaks and sustains beyond breakeven levels by expiration.
Risk Management Matters More Than Ever
The strength of a Long Strangle lies in its predefined risk and unlimited reward potential, but that doesn’t mean the position is immune to pitfalls. Movement is key — and time decay (theta) begins to erode the premium paid with each passing day.
Here are a few key considerations:
Stop-loss is optional, as max loss is predefined.
Precise entry timing increases the likelihood of capturing breakout moves before theta becomes too damaging. Same for exit.
Strike selection should always balance affordability and distance to breakeven.
Avoid overexposure, especially in low volatility environments that can lull traders into overtrading due to the potentially “cheap” options.
Using strategies like this within a broader portfolio should always come with well-structured risk limits and position sizing protocols.
When charting futures, the data provided could be delayed. Traders working with the ticker symbols discussed in this idea may prefer to use CME Group real-time data plan on TradingView: www.tradingview.com - This consideration is particularly important for shorter-term traders, whereas it may be less critical for those focused on longer-term trading strategies.
General Disclaimer:
The trade ideas presented herein are solely for illustrative purposes forming a part of a case study intended to demonstrate key principles in risk management within the context of the specific market scenarios discussed. These ideas are not to be interpreted as investment recommendations or financial advice. They do not endorse or promote any specific trading strategies, financial products, or services. The information provided is based on data believed to be reliable; however, its accuracy or completeness cannot be guaranteed. Trading in financial markets involves risks, including the potential loss of principal. Each individual should conduct their own research and consult with professional financial advisors before making any investment decisions. The author or publisher of this content bears no responsibility for any actions taken based on the information provided or for any resultant financial or other losses.
BTCUSD: Short for Delta-Neutrality after buying Spot @ Range-LowLike i mentioned in my previous analysis, BTCUSD is in a range and it might be ignored by the majority that there's no clear knowledge of the range spread. Noone knows, me included.
I just stick to my plan. Check my previous analysis if you want to know the reasons for this idea. Now it's more concrete and it's still worth a try, but if you are a retail trader, you should ignore it because of the leverage being used as well as the lack of experience with delta-neutral trading.
Also it is completely different from a typical HODL- or DCA-strategy. Trend-Followers and Breakout-Traders in general should wait for a more directional BIAS elsewhere because my analysis and trade idea results in a non-directional BIAS.

Managing non directional option trades : #snap Making money even when Im wrong, only in options world is that a thing.
Non directional trades try to capture premium from both bull and bear sides be on a range or sideways trend.
Here I discuss managing non directional trades as time passes and future price moves reveal themselves.
Eventually, this non directional trade became directional. But thats my choice and comfort based on risk reward of the current market.
We have to price risks and choose our exposure.
We dont control the market or outcomes. We control decisions and orders.
good luck have fun be safe!

Educational Options Video Strangle v Capped Strangle Jade LizardConceptual view of how to trade non directional or semi directionally using strangles and capped strangles, also known as Jade Lizard option spreads.
Non directional option trades attempt to benefit from sideways markets or markets where options are are pricing more implied movement than is realized in the underlying asset.
Combing a vertical on top with a cash secured put on bottom, creates a range trade. Selling on both sides for credits helps either reduce the cost of buying shares or creates income while the stock trades sideways without direction.
DIA SPX QQQ VIX NYSE:PLTR SNAP

EDUCATION: TIPS: MANAGING THE TESTED NONDIRECTIONALUnless you've been buried under a rock somewhere, you'll know that we've experienced a big, broad market move from the late December "Dump Everything, Including the Kitchen Sink" lows at SPY 234 to where we finished Friday. If you were bullish assumption directional in virtually any broad market instrument or exchange-traded fund at or near those late December/early January lows, well, you're feeling pretty awesome here. However, if you went nondirectional at those same lows (short strangle, short straddle) in light of the high volatility environment that existed at that point in time, you may be struggling with call side test and have your share of inverteds on. With that in mind, here are a few tips for managing tested nondirectionals, particularly short strangles and short straddles.
1. Don't Panic/Take Time To Manage The Setup Thoughtfully. If you've been selling short strangles or straddles for any period of time, you'll know that markets move. You can't have a perfectly delta balanced setup all the time, and you probably shouldn't try to keep things that way. Constantly going for delta neutral costs you fees and commissions at the very least and subjects you to potential whipsaw if you're too aggressive. Take a deep breath, close your phone's trading app, and look at the setup again when you've got sufficient time to evaluate what you should do, which should include looking at all your options (rolling the untested side up, rolling the whole setup out, adding needed delta via an additional setup,* or a combination of those).
2. Stay Mechanical As To "When." I generally have a few rules as to when something must be done with a broken setup: (a) A side is approaching worthless (<.05). (b) There is ex-divvy assignment risk. (c) Time is simply running out. All other times are basically "non-must" times when you probably should just hand sit on the setup and attempt to allow the probabilities to work out without intervention. I would note that hand sitting patiently for one of these "must do" points in time is the hardest thing to do in practice, but probably gives better results than constantly fiddling with the setup. (I tend to be a fiddler, so I can speak from experience).
3. Stay Mechanical As To "Where."
Intraexpiry Rolls: My general rule on intraexpiry rolls is to roll the untested side toward current price to a strike that will cut net delta position in half where there is side test or the side to be rolled is approaching worthless, assuming that doing that will be productive from a credit received standpoint. For example, if the position's net delta has skewed out to -50, look to roll the untested side to a strike that will reduce that net to =25. As a possible alternative rule, roll the untested to the 30 delta strike; it won't necessarily cut your net delta in half, but it's also a good mechanical rule.
If an intraexpiry roll won't be productive (<.25 is kind of my cut off), look to roll out for duration.
Rolling For Duration: I generally look to roll the tested side "as is" and the untested to the 30 delta strike.
4. Be Familiar With "Inversion Math." If either an intraexpiry/duration roll results in an inverted setup, keep in mind that the number of strikes the strangle is inverted must be subtracted from total credits received to determine your max profit potential in the inverted. For example, if you received 2.00 for a short strangle and rolled for a 1.00 credit to an inverted that is 2 dollars wide, the max profit potential of that setup isn't 3.00 (total credits received); it's the total credits received minus the width of the inversion: 3.00 (total credits received) - 2.00 (inversion width) = 1.00. Your scratch point is still 3.00, but you won't be able to get out of that setup for less than 1.00 max, so there's no point in shooting for 1.50, for example. Conversely, rigorously attempt to avoid rolling to an inversion that is wider than total credits received, since you won't be able to exit that setup at your scratch point profitably.
5. Look to Bail On Inversions At Scratch. Broken setup risk is generally not centered, the probability of profit is lower than an original setup, max profit potential generally isn't ideal as a function of how much buying power a broken is tying up, and there is there is random assignment risk, depending how deep in the money the tested side is. A scratch is always better than a loser.
6. Keep Track As You Go. Regardless of which type of roll you do, keep track of total credits received as you do each one. Going back through your platform or brokerage statement to look at what you received in credits adds work to the basic scratch calculation process and can lead to addition/subtraction errors as to where your scratch point lies. I have a spread sheet for active trades to avoid doofy addition errors. Aside from calculating short strangle scratch points, it's just a good habit to have a spreadsheet, particularly with things like covered calls, where you can work positions over several months, if not years, of time.
* -- Getting required delta via a separate setup (short calls, short call verticals, downward put diagonals, short skewed strangles/straddles for short delta; short puts, short put verticals, upward call diagonals, long skewed strangles/straddles for long delta) is also something that you can do to delta balance, but it naturally adds its own risk.
