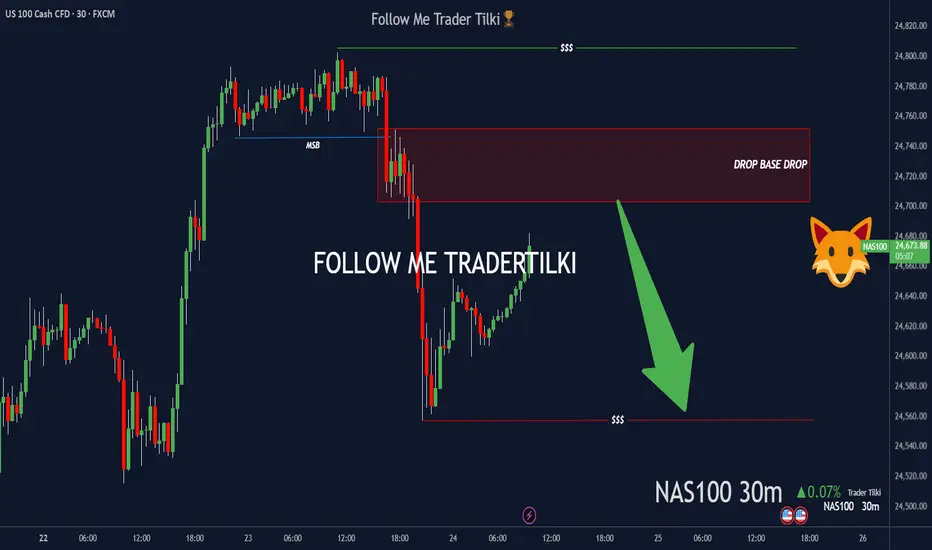
30 sept DOWN NASDAQshort in nasdaq.
looking at weaknes in daily.
entry in blue
stop in red.
target in green.
have fun
all details of the trade are explained on the video
Electra 33
NASDAQ 100 E-MINI FUTURES

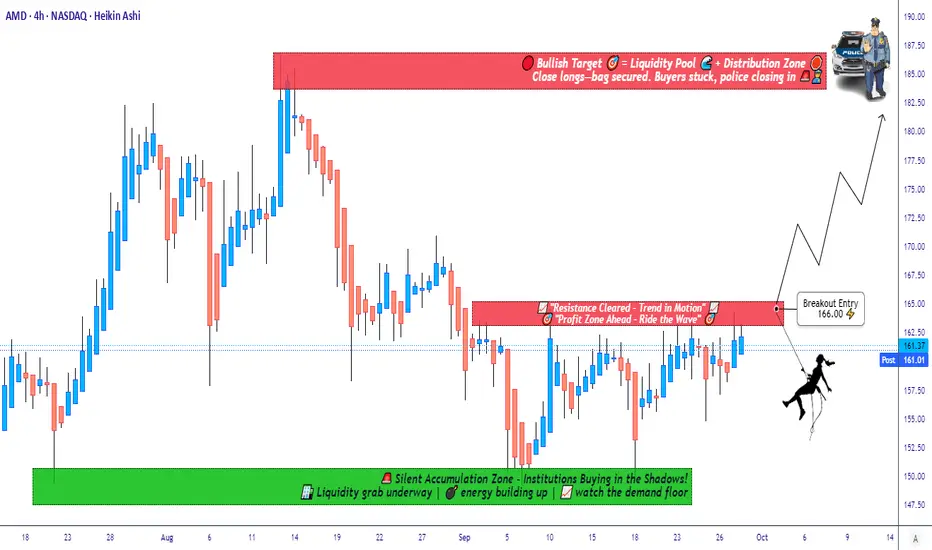
Breakout or Fakeout? Watching AMD Resistance for Next Big Move📈 AMD “Advanced Micro Devices, Inc” – Wealth Strategy Map (Swing/Day Trade)
🗺️ Plan:
I’m tracking AMD with a bullish strategy — waiting for a resistance level breakout to confirm momentum. Once price breaks the key barrier, entry opportunities open up.
🎯 Entry Setup (Thief Strategy Layering Method):
Instead of one entry, I’m applying a layering strategy with multiple buy limit orders. This approach helps average entries across different levels.
Buy limit layers: 155.00, 158.00, 160.00, 162.00, 163.00. 164.00
(💡 You can increase layers based on your own risk & comfort.)
Breakout confirmation: Entry after breakout price level mentioned.
🛑 Stop Loss (Thief SL):
Suggested stop loss @150.00
⚠️ Note: Dear Ladies & Gentlemen (Thief OG’s), this is my SL level, but you are not required to follow it. Manage risk according to your own plan.
🎯 Profit Target (Police Barricade Zone 🚨):
Price faces a strong resistance around 186.00 — this area acts as a trap zone with overbought conditions.
Target @186.00 (escape with profits before police catch you 🚔).
⚠️ Note: Again, TP is personal. Take profit when satisfied — your money, your choice.
🔗 Related Assets to Watch (Correlation Insight):
AMD tends to move in line with broader tech sentiment and semiconductors:
NASDAQ:NVDA (NVIDIA) – Direct sector competitor, often mirrors momentum.
NASDAQ:SMH (VanEck Semiconductor ETF) – Strong correlation, broader chip market direction.
NASDAQ:QQQ (NASDAQ 100 ETF) – AMD is a major component; index momentum often drives AMD.
NASDAQ:INTC (Intel) – Rival stock; negative news on INTC can boost AMD sentiment.
Watching these pairs helps confirm breakouts & avoid false signals.
✨ “If you find value in my analysis, a 👍 and 🚀 boost is much appreciated — it helps me share more setups with the community!”
⚠️ Disclaimer:
This is a Thief Style Trading Strategy — shared for fun & educational purposes only.
Not financial advice. Trade at your own risk.
#AMD #SwingTrade #DayTrade #Stocks #Semiconductors #TradingStrategy #BreakoutSetup #StockMarket #NVDA #QQQ
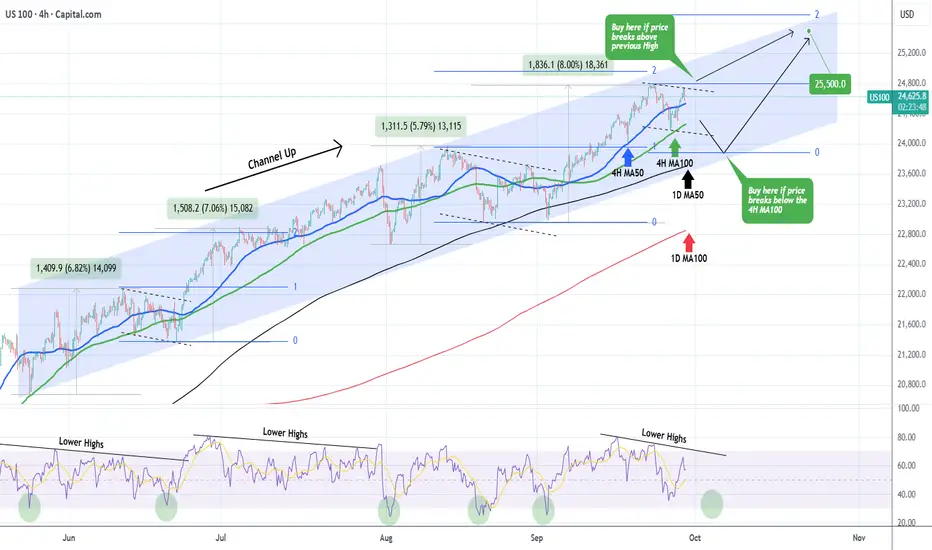
NASDAQ in no action zone. Buy break-out or pull-back.Nasdaq (NDX) has been trading within a 4-month Channel Up and its most recent low has been on its 4H MA100 (green trend-line) 2 days ago.
As long as it holds, it maintains the short-term bullish trend but a confirmed buy signal would be after the price breaks above its previous 24800 High.
Until it does, it might be within a technical Bearish Leg similar to late August's and mid June's that both broke below the 4H MA100 before bottoming on the Higher Lows trend-line of the Channel Up and rebounded. The 4H RSI Lower Highs structure shows that we might be on such a pull-back sequence, which turns into a buy below 33.00 (RSI).
As a result, we will either wait for a 24800 break-out or a 1D MA50 (black trend-line) pull-back before initiating a buy again. In both cases, our Target is 25500 (just below the 2.0 Fibonacci extension).
-------------------------------------------------------------------------------
** Please LIKE 👍, FOLLOW ✅, SHARE 🙌 and COMMENT ✍ if you enjoy this idea! Also share your ideas and charts in the comments section below! This is best way to keep it relevant, support us, keep the content here free and allow the idea to reach as many people as possible. **
-------------------------------------------------------------------------------
💸💸💸💸💸💸
👇 👇 👇 👇 👇 👇
NASDAQ-NAS100 4H Analysis: Buy OpportunityHello Guys,
I’ve prepared a 4-hour NAS100 analysis for you.
I’ll be entering a buy position from 24,500.00 with a target set at 24,748.00.
Set your stop level according to your own margin.
Once the markets open, I’ll definitely take my shot on the buy side of NAS100.
Let’s see how this analysis plays out together.
Every like is my biggest motivation to keep sharing these analyses.
Thanks to everyone supporting me!

NQ is twitching the worm - Don't take the bait🎣 Don’t take the bait! 🎣
Just sitting here, watching my pre-market setup.
Now I can see them twitching the worm, trying to lure me in.
NOPE!
This price action’s way too twitchy for me. §8-)
This Chart is a RTH with "Gap-Attached" and gives a perfect catch of the first drop.
So, just casually watching...maybe I can learn even more...
🐟🐠🐡🐟🐠🐡🐟🐠🐡🐟🐠🐡🐟🐠🐡🐟🐠🐡🐟🐠🐡
A Bullish Friday for NasdaqNow that support has been reached, I’m anticipating Nasdaq to resume its bull run. During the AM session, I’ll be watching for either a double bottom or an inverse head-and-shoulders pattern to form.
On the daily chart, I’m anticipating a rejection from the 24,600 Daily FVG.
It may be too early to confirm, so I’ll revisit and update this idea in the morning.
Lets go Long⚡

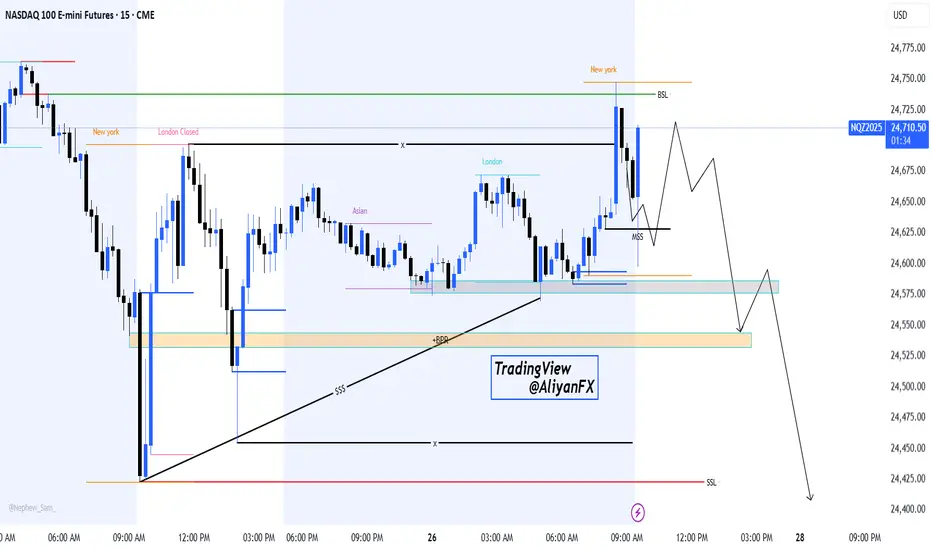
NASDAQ 100 – Potential Liquidity Grab & Bearish Continuation SetHello Billionaires!!
We All know that the Price has swept the New York session high (BSL) and is now showing signs of a potential market structure shift (MSS). If the short-term pullback holds, we may see a deeper retracement toward the demand zone (BPR + Asian range) before another leg down.
🔹Key Levels to Watch:
24,725 – 24,750: Liquidity grab zone (recent NY high)
24,575 – 24,550: Re-test area for possible continuation
24,500 – 24,450: Next downside target if bearish momentum continues
Bias: Short-term retracement followed by potential bearish continuation toward lower liquidity pools (SSL).
📌 This is an educational projection, not financial advice. Trade safe and always manage your risk!
Nasdaq Pre-Market Long CIB Trade🔱 Here comes the CIB Trade 🔱
Price came down in 5 waves.
The CIB line gives us a heads-up if price breaks through it, and it did!
Now everyone and it's Grandma is long on the breakout.
"...let's scare them out, let's hit their Stop!"
Then we take off upon a test of the CIB-Line, which in essence is the same as a test fo a U-MLH or L-MLH after a break.
We have a nice target with a chance to hit of about 80% at the Centerline, and a fantastic tiny stop below the test at the CIB line.
Let's watch how this unfolds.

Pressure’s buildin’ on NAS100—could pop any minute.Hey Guys,
Once NAS100 hits my SELL zone, I’m pulling the trigger—targeting 24557.06
• Entry: 24752.05 or 24703.29
Set the stop point according to your own margin, my friends.
Every like you drop pushes me to share more setups like this. Big thanks to everyone showing support!
NQ - Nasdaq Is Coming For Your Stop!OK, there's not much to say.
That guy looks bad. I mean, really bad §8-)
Let's see if we can use the bad mood for a nice short down to the bottom.
Ohhhh Myyyy.....

SMH Bullish Setup – Breakout Plan for the Perfect Heist!🔥🚀 THIEF TRADER ALERT: SMH BULLISH HEIST PLAN! 🚀🔥
Asset: VANECK SEMICONDUCTOR ETF (SMH)
Plan: BULLISH BREAKOUT HEIST 🎯 (Resistance wall breakout candle close above 298.00)
🎯 THIEF ENTRY STRATEGY (LAYERING METHOD) 🎯
"Steal the dip like a PRO!" 💰🔪
Multiple Limit Orders (Layer Entry) 👇
1st Layer: 298.00 (Breakout Confirmation)
2nd Layer: 292.00 (Pullback Steal)
3rd Layer: 288.00 (Aggressive Discount)
4th Layer: 284.00 (Max Pain = Max Gain)
(Add more layers if you’re a risk-loving THIEF!)
⚠️ WARNING: DO NOT place SL or orders before breakout! (Only real THIEFS wait for confirmation!)
🛑 THIEF STOP LOSS (OG STYLE) 🛑
"Protect your loot or get wrecked!" 💣
SL @ 280.00 (Hard floor – adjust based on your risk appetite!)
Place SL ONLY AFTER breakout! (No premature stops – patience = profit!)
🎯 TARGET: 324.00 🚀 (OR ESCAPE EARLY IF MARKET TURNS)
Scalpers: Ride the waves, but stay LONG ONLY! 🌊
Swing Thieves: Hold & rob big! Use Trailing SL to lock gains! 🔐💰
📢 THIEF PRO TIPS:
✅ Set Alerts! (Don’t miss the breakout!) 🔔
✅ Watch for News! (Avoid getting caught in volatility traps!) 📉📈
✅ Boost & Support! (More boosts = more heists!) 💖🚀
🔥 FINAL MESSAGE:
"The market is a casino, and WE are the robbers! 🎰💰 Steal smart, escape rich! 🏴☠️💸"
👉 LIKE, BOOST & FOLLOW FOR MORE HEIST PLANS! 👈
🚀 NEXT HEIST COMING SOON… STAY TUNED! 🚀
#ThiefTrader #SMH #BreakoutHeist #LayerEntry #LimitOrderBandit 🎯🔥

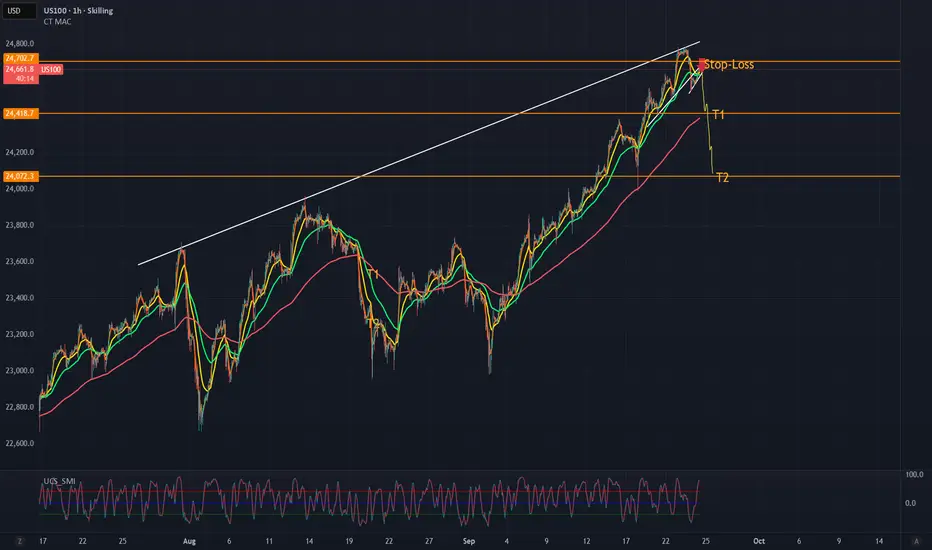
NASDAQ (US100) - ShortNasdaq (US100) currently trading at 24662.
We reached a high at 24767 and from there got a rejection. Multiple reasons here now for a continuation to the down side.
Entry: In rising channel at current levels.
Stop Loss: 24702
T1: 24418
T2: 24072
I'm expecting to see a break of this rising channel soon, may get some retest of the upper line till then which are great entry points.
No trading advise, just my opinion. Have fun.
NQ - Sub Dividing Elliott Wave CountIs this possible? Multiple 1st and 2nd wave sub divisions, a small 3rd wave, and then again multiple 4th and 5th wave sub divisions.

NasdaqNasdaq consolidated another support level at 24740 in today's session. If the price remains above this support, buyers remain in control, and we could reach 25000, an important level that could signal the end of the bullish rally. An H1 candlestick closing above 24800 could confirm continuation.

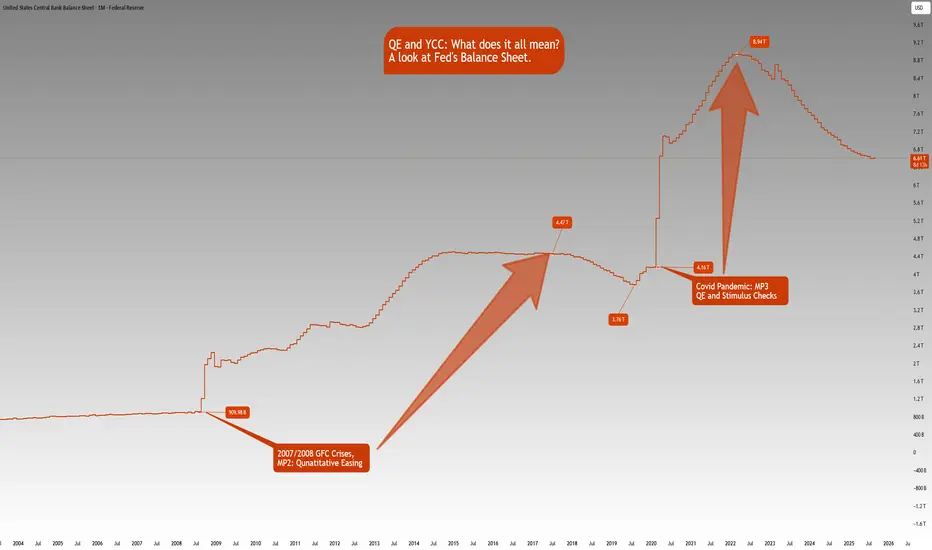
QE and YCC: What does it all mean?ECONOMICS:USCBBS
CBOT:ZB1! CBOT:ZN1! CME_MINI:NQ1!
There is growing market speculation that the Fed may tolerate inflation above 2% for longer, consistent with its Average Inflation Targeting (AIT) framework introduced in 2020.
This also implies that real rates i.e., nominal rates minus inflation are likely to fall significantly. Given this, we anticipate gold to continue trending higher as the U.S. dollar's purchasing power erodes with mounting debt, persistently higher inflation, and falling real yields.
What is QE?
Quantitative Easing (QE) refers to the Fed injecting liquidity into financial markets by purchasing large quantities of assets such as Mortgage-Backed Securities (MBS) and U.S. Treasuries, especially during periods of economic stress like the Global Financial Crisis (2007–2008) and the COVID-19 downturn.
How Does QE Work?
Asset Purchases: The Fed buys large volumes of Treasuries and MBS from financial institutions.
Balance Sheet Expansion: These purchases expand the Fed's balance sheet (now hovering near $6.6 trillion, per FRED).
Increased Liquidity: Banks receive excess reserves in exchange, increasing system-wide liquidity.
Lower Interest Rates: Demand for bonds pushes prices higher and yields lower.
Economic Stimulus: Lower borrowing costs promote credit creation, investment, and consumer spending.
However, a key drawback of QE is asset price inflation. As seen between the GFC and the COVID-19 pandemic, low rates and excess liquidity drove significant appreciation in equities, housing, and other financial assets, even while consumer inflation remained near target.
QE vs. Stimulus Checks
If traditional interest rate policy is Monetary Policy 1 (MP1), then QE is MP2. Stimulus checks, or government handouts, fall under MP, a fusion of monetary and fiscal policy.
While QE primarily injects liquidity into financial institutions, stimulus checks inject purchasing power directly into households. This approach where the Treasury issues debt and the Fed purchases that debt, stimulates demand for real goods and services. We saw this during the post-COVID recovery, which brought a sharp rebound in consumer activity but also a surge in inflation, reaching a peak of 9.1% in June 2022 (CPI YoY).
QE impacts Asset Price Inflation
Stimulus Checks impact Goods & Services Inflation
What is YCC? (Yield Curve Control)
Yield Curve Control (YCC) is a policy whereby the central bank buys government debt across various maturities to control yields not just at the short end (via rates), but across the entire yield curve.
A prime example is the Bank of Japan, which has used YCC since 2016 to anchor 10-year JGB yields near zero. The Fed has not formally adopted YCC, but market participants believe it may lean in that direction in the future especially during crises where long-end rates rise undesirably. Mounting US debt and rising long end yields may prompt the Fed to step in and adopt YCC like BoJ has done previously.
Front-End Control: Managed via policy rates
Long-End Control: Central bank buys 5Y, 10Y, 20Y, 30Y Treasuries to anchor yields
Potential Risks of YCC:
Credibility Risk: If inflation rises while the central bank suppresses yields, it may lose market trust.
Currency Pressure: Artificially low yields may trigger speculative pressure on the currency (as seen with the yen under BoJ YCC).
We’ve kept this concise and digestible for now, but there’s more to unpack—especially on the long-term implications of coordinated monetary-fiscal policy (MP3), debt sustainability, and central bank credibility.
The Fed’s balance sheet chart shows how Fed’s balance sheet has increased:
Aug 1, 2008: $909.98B
Jul 1, 2017: $4.47T
Aug 1, 2019: $3.76T
Feb 1, 2020: $4.16T
Mar 1, 2022: $8.94T
Aug 1, 2025: $6.61T
Note that this is not just a US phenomenon. It is a world wide phenomena looking at many of the developed and emerging markets. The Debt to GDP ratios are increasing, Central Banks balance sheets are rising in tandem with rising government debt.
With the rate cutting cycle starting, it is a matter of time that we also see QE restarting.
If you’d like us to dive deeper into any of these topics in future educational blogs, let us know. We're happy to build on this foundation with more insights.
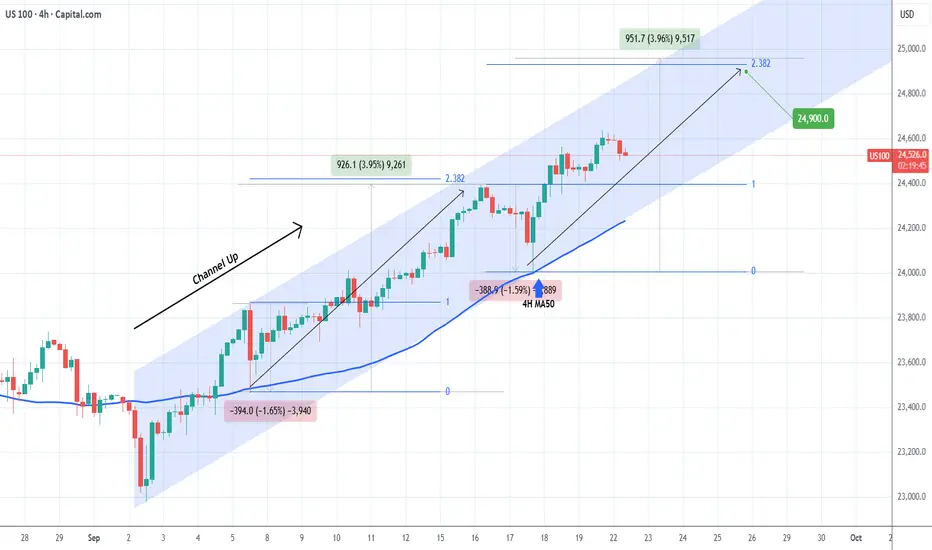
NASDAQ September's Channel Up targets 24900.Nasdaq (NDX) has been trading within a Channel Up since the September 02 Low and at the moment it is unfolding its 2nd Bullish Leg following the 4H MA50 (blue trend-line) bounce on September 17.
Based on the previous 4H MA50 Bullish Leg, the sequence should peak below the 2.382 Fibonacci extension at a maximum +3.96% rise. Our Target is slightly below those at 24900.
-------------------------------------------------------------------------------
** Please LIKE 👍, FOLLOW ✅, SHARE 🙌 and COMMENT ✍ if you enjoy this idea! Also share your ideas and charts in the comments section below! This is best way to keep it relevant, support us, keep the content here free and allow the idea to reach as many people as possible. **
-------------------------------------------------------------------------------
💸💸💸💸💸💸
👇 👇 👇 👇 👇 👇
NASDAQ 100 (NQ1!): Bullish! Wait For The Pullback, Then Buy ItWelcome back to the Weekly Forex Forecast for the week of Sept 22 - 26th.
In this video, we will analyze the following FX market: NASDAQ (NQ1!) NAS100
The NASDAQ is bullish. Let the market pullback to the +FVG (Internal Range Liquidity) a +FVG, and look for valid long setups on the lower timeframes.
Should the -FVG fail, then wait until it moves to a lower +FVG that will act as support. I do not recommend shorting this market until there is a clear bearish BOS.
Enjoy!
May profits be upon you.
Leave any questions or comments in the comment section.
I appreciate any feedback from my viewers!
Like and/or subscribe if you want more accurate analysis.
Thank you so much!
Disclaimer:
I do not provide personal investment advice and I am not a qualified licensed investment advisor.
All information found here, including any ideas, opinions, views, predictions, forecasts, commentaries, suggestions, expressed or implied herein, are for informational, entertainment or educational purposes only and should not be construed as personal investment advice. While the information provided is believed to be accurate, it may include errors or inaccuracies.
I will not and cannot be held liable for any actions you take as a result of anything you read here.
Conduct your own due diligence, or consult a licensed financial advisor or broker before making any and all investment decisions. Any investments, trades, speculations, or decisions made on the basis of any information found on this channel, expressed or implied herein, are committed at your own risk, financial or otherwise.

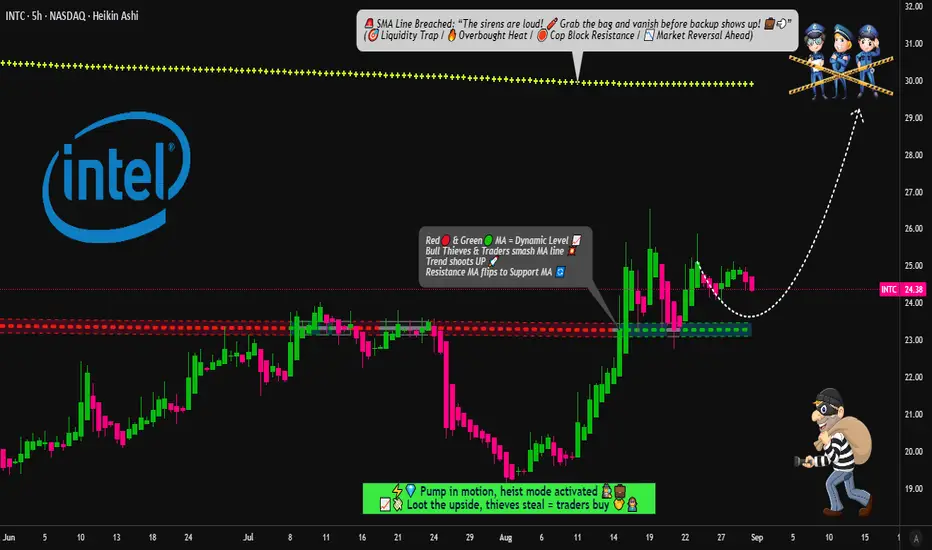
INTEL Heist Playbook: Buy the Dips, Escape Before the Sirens🔓💻 INTEL CORPORATION "Chip Heist" Stock Raid 💻🔓
🎯 Plan: Bullish Robbery | Targeting $30.00 | Stop Loss: $21.00
💰 Layered Limit Entries | Silicon Valley Loot | Calculated Takedown
🚨⚠️ Attention TRADERS, Tech Pirates & Market Mercenaries! ⚠️🚨
The INTC data vault is cracked, and the Thief Trader squad is executing a multi-layer LIMIT ENTRY HEIST – stacking shares like we're loading the getaway van. 🚐💾⚡
👀 We ain't chasing price – we're ambushing it with precision. Every discount? A planned acquisition.
💥 ENTRY: Any Price Level is a Gift 💥
"Bullish on Silicon" – we're collecting shares on any dip into value town!
Deploy buy limits at key psychological support layers: $25.00, $24.00, $23.00 (Add more layers based on your own capital).
Thief-style: We don't buy the hype; we steal the undervalued chips.
🛑 STOP LOSS: This is a Thief SL @ $21.00 🔐
Dear Ladies & Gentleman (Thief OG's), this is set at the breakdown panic zone – where the weak hands get shaken out.
Adjust your final SL based on your own risk appetite and strategy. Size wisely.
🎯 TARGET: $30.00 💸
The police barricade is there, so kindly escape with your stolen money before arrival.
We're targeting the next major resistance vault. Take profits and live to trade another day.
🧠 Swing Traders? Load the boat. Day Traders? Snatch the quick flips. Investors? Stack and hold. 💵☕
Use a trailing stop loss to protect your capital as the trend accelerates.
🕵️♂️ THIEF TRADER INSIGHTS:
📊 Backed by tech sector momentum, oversold bounces, and order block analysis.
🗞️ Earnings? Chip news? = increased volatility = adjust your layers accordingly.
⚠️ HEIST PROTOCOL:
✅ Avoid over-leveraging – this is a layering strategy, not a casino bet. 📉
✅ Use risk-adjusted position sizing on every limit order.
✅ Discipline is key. The market will deliver the discounts; you just need to be patient.
❤️🔥 Hit that 💥 LIKE & FOLLOW 💥 if you're riding with the Thief Squad!
Support the strategy. Respect the plan. Stack your gains like a true Market Outlaw.
🔔 Follow for the next HEIST. Big bags only. 💼🚀📈
“The market is a river of money—flowing from the impatient to the patient.” – Thief Trader
#INTC #Intel #StocksToWatch #TradingPlan #SwingTrading #StockMarket #Investing #LayeredEntries #ThiefTrader #ChipHeist
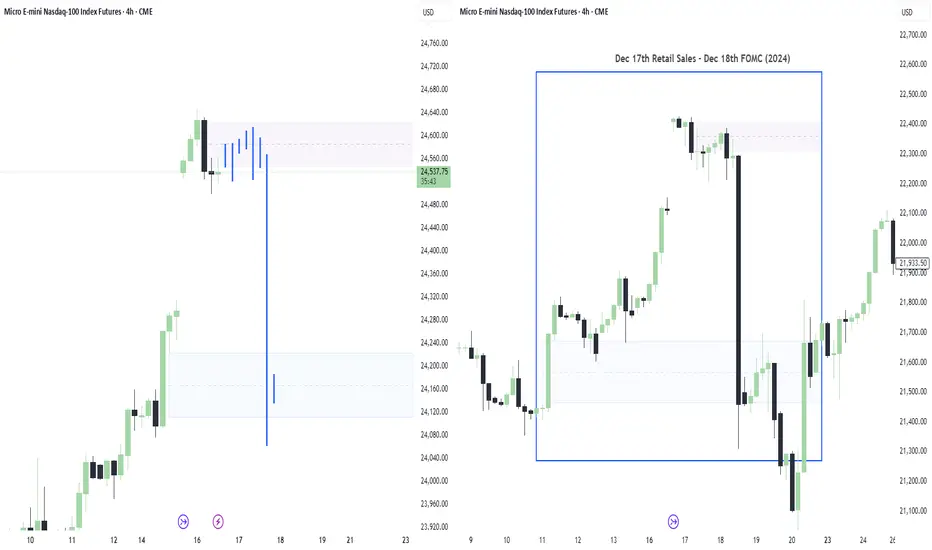
Nasdaq Echoing December FOMC| NQ1 Short SetupAfter spotting the new day opening gap, I immediately analyzed the charts for a comparable All-Time High NDOG scenario. Sure enough, I found nearly identical price action — unfolding on the same days and with the exact same news catalysts.
I’m planning to short from around 24,600.00, with the expectation that 24,200.00 will get taken out.
Let's see how this plays out⚡
Nasdaq looking downtoday as seen in the video, we are looking for a short.
yesterday showed a lot of rejection to the upside so maybe today we see the market test levels to the down side.
entry in blue.
stop in red
target in green
Elektra

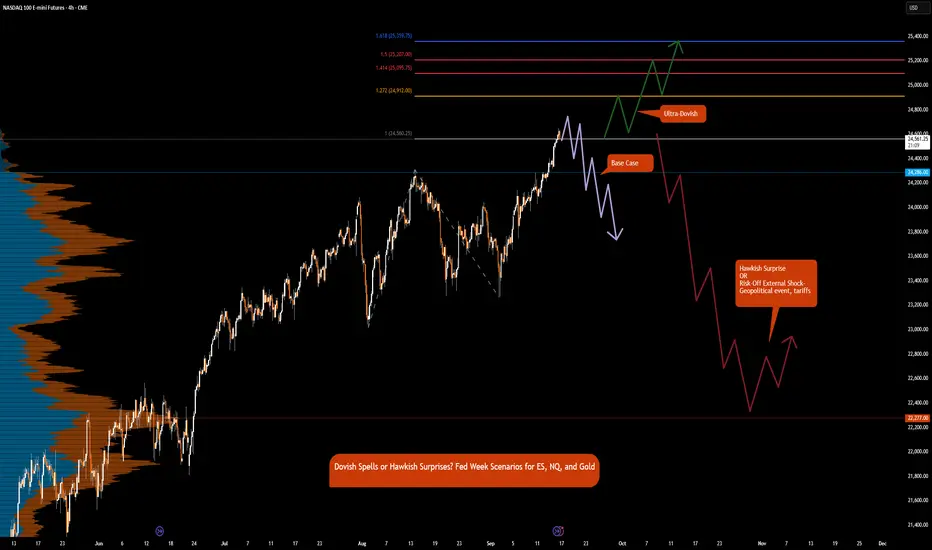
Dovish Spells or Hawkish Surprises? FOMC Prep for ES, NQ, GCLet’s start with the biggest event this week. Unless, of course, some unexpected headline swoops in and steals the spotlight — because markets love a good plot twist.
Emotions are running high, and volatility is flying around like confetti at a surprise party nobody asked for. But don’t worry, Chair Powell might just play the role of the calm voice in the chaos.
Markets are pricing in a 25 bps rate cut by the Fed this week. Interestingly, the future path of rate cut expectations has been in the doldrums. Is it a bird or a plane? No, it’s Superman. Likewise here, is it 1 cut or 2 cuts? No, it’s 3 cuts priced at this moment until the end of 2025.
Excuse the humor, but what fun is it if you cannot entertain yourself while analyzing the complexities of markets day in and day out. Execution is boring; risk management is much like dementors sucking out life force when risk is not respected. And analyzing and preparation is where the creativity and fun is.
And as Kurt Angle would say, it is “ True ”.
Index futures including ES futures and NQ futures have all climbed steadily higher since September 2 low. Markets are turning higher in anticipation of a new bull run.
Gold futures are rallying, currently trading above $3700. Since the Jackson Hole dovish pivot, gold has not looked back and has rocketed higher above major resistance.
Our focus is on the Fed meeting. All eyes will be on the forward guidance; risks to inflation, risks for the labor market and FED’s SEP (Summary of Economic Projections). This also includes GDP forecasts and the most anticipated Dot Plot.
Which of the two mandates will the Fed prioritize, labor market weakness or sticky inflation? The interesting thing to note is that despite sticky inflation, markets are anticipating 3 cuts of 25 bps for each of the meetings this year.
Thus far, as we have previously mentioned, the Fed will likely be moving away from their 2% inflation target to an average inflation target in the range of 2% to 3%.
This also implies that real rates i.e., nominal less inflation are going to fall sharply lower.
Given this, we anticipate gold to continue higher as the US Dollar's purchasing power erodes away, with mounting debt, higher inflation and falling real yields.
The real question we should be asking is:
What if the meeting outcome is hawkish with the Fed delivering just 1 cut in the September meeting and staying on hold for the remainder of the year?
What other risks are there that could pull stocks and indexes lower? And bonds higher?
Tariffs at this point seem like an old talk unless something reinvigorates and puts them on the front and center of market worries.
Based on these thoughts, here are our scenarios:
Base Case:
25 bps cuts and dovish guidance but iterates meeting by meeting approach.
ES & NQ:
Data dependent Fed, that is likely behind the curve and markets may translate this as Fed too slow to react to emerging risks, risks of recession goes higher. In this case, although stocks may push higher with rates coming down initially, in our view, much of this is priced in and this may be ‘sell the fact moment’.
Portfolio adjustment: Sell index futures, Buy Gold and Bonds.
Ultra-Dovish:
Fed’s dot plot confirms 2 additional rate cuts of 25 bps for Oct and Dec meeting and further 4 cuts till end of 2026 to bring terminal rate lower to 250-275.
USD weakens further, real rates sink, reinforcing gold bid.
Portfolio adjustment: Buy everything. Buy the dip.
Hawkish Surprise
Only 25 bps in September, then pause
ES & NQ:
• Sharp pullback as equities reprice for tighter liquidity.
• ES could retrace recent gains, downside risk toward 4,900–5,000 zone.
• NQ likely hit harder due to tech sensitivity to discount rate.
GC:
• Short-term correction as USD firms and yields spike.
• However, downside may be limited if market shifts focus back to debt & long-term inflation risks.
Risk-Off External Shock- Geopolitical event, tariffs
ES & NQ:
• Drop as risk sentiment sours; defensives outperform growth.
• Bonds rally, yields fall, curve steepens if Fed cut expectations accelerate.
GC:
• Strong safe-haven bid, spikes higher regardless of Fed stance.
Comment with your thoughts and let us know how you see the markets shaping up this week
A Tolled BellThe first bell has rung. A bridge is being paved across the $6000 range.
IF it blows up, it likely won't happen until the bridge is constructed and sentiment improves. Expect a few heartfelt endeavors to shoot above $6,660. Base case is long term crab market.

NASDAQ Approaching a critical +1 year Resistance.Nasdaq (NDX) is close to hitting our 24500 bullish target, which as we explained on our previous analysis represents a +6.78% rise, the technical Bullish Leg of the Channel Up that started back in mid-May.
This pattern is however headed towards a +1 year Resistance level, the Higher Highs trend-line that started on the July 11 2024 High. Technically, we should be expecting a rejection there and pull-back towards at least the 1D MA50 (blue trend-line), if not the 1D MA100 (green trend-line), which is where an identical Channel Up in 2024 that topped on December 16 2024, found Support at.
Even the 1D RSI sequences among the two patterns look similar. As a result, there are high probabilities to see a short-term correction there, which will in turn fuel the end-of-year rally. Our new medium-term Target is 25000.
-------------------------------------------------------------------------------
** Please LIKE 👍, FOLLOW ✅, SHARE 🙌 and COMMENT ✍ if you enjoy this idea! Also share your ideas and charts in the comments section below! This is best way to keep it relevant, support us, keep the content here free and allow the idea to reach as many people as possible. **
-------------------------------------------------------------------------------
💸💸💸💸💸💸
👇 👇 👇 👇 👇 👇
