NASDAQ: Dip Buy Time! Wait For Valid Buy Setups!Welcome back to the Weekly Forex Forecast for the week of Dec. 15 - 19th.
In this video, we will analyze the following FX market: NASDAQ (NQ1!) NAS100
The NASDAQ is is still bullish, despite the leeriness toward AI and tech stocks. Profits were taken Friday, causing a bearish close on the day. But there are supporting structures for higher prices nearby, and I will personally be watching for price to contact those areas and look for valid market shifts to signal buys are in order!
Enjoy!
May profits be upon you.
Leave any questions or comments in the comment section.
I appreciate any feedback from my viewers!
Like and/or subscribe if you want more accurate analysis.
Thank you so much!
Disclaimer:
I do not provide personal investment advice and I am not a qualified licensed investment advisor.
All information found here, including any ideas, opinions, views, predictions, forecasts, commentaries, suggestions, expressed or implied herein, are for informational, entertainment or educational purposes only and should not be construed as personal investment advice. While the information provided is believed to be accurate, it may include errors or inaccuracies.
I will not and cannot be held liable for any actions you take as a result of anything you read here.
Conduct your own due diligence, or consult a licensed financial advisor or broker before making any and all investment decisions. Any investments, trades, speculations, or decisions made on the basis of any information found on this channel, expressed or implied herein, are committed at your own risk, financial or otherwise.
NASDAQ 100 E-MINI FUTURES

NQ; Continuation to lower demand? 📈 Hey Traders!
Here’s a fresh outlook from my trading desk. If you’ve been following me for a while, you already know my approach:
🧩 I trade Supply & Demand zones using Heikin Ashi chart on the 4H timeframe.
🧠 I keep it mechanical and clean — no messy charts, no guessing games.
❌ No trendlines, no fixed sessions, no patterns, no indicator overload.
❌ No overanalyzing the market; use only two time frames.
❌ No scalping, and no need to be glued to the screen.
✅ I trade exclusively with limit orders, so it’s more of a set-and-forget style.
✅ This means more freedom, less screen time, and a focus on quality setups.
✅ Just a simplified, structured plan and a calm mindset.
💬 Let’s Talk:
💡Do you trade supply & demand too ?
💡What’s your go-to timeframe ?
💡Ever tried Heikin Ashi ?
📩 Got questions about my strategy or setup? Drop them below — ask me anything, I’m here to share.
Let’s grow together and keep it simple. 👊

Palantir Teases Bers at Resistance, Nasdaq Looks WeakDespite the fact that Santa's rally could see at least a temporary rise for the stock market, I still think the Nasdaq could be breaking to new cycle lows as we head into the new year. Palantir has also caught my eye for a potential short setup, given its bearish clues around resistance.
Matt Simpson, Market Analyst at City Index

Can PepsiCo Extend Higher Following This Technical Breakout?📈 ASSET OVERVIEW
Asset: NASDAQ:PEP — PEPSICO, INC
Exchange: NASDAQ
Market Type: Stock
Trading Style: Swing Trade
🧠 TRADE THESIS (BULLISH BIAS)
NASDAQ:PEP has activated a bullish structure following a Triangular Moving Average (TMA) breakout, signaling a potential trend continuation phase.
Price action confirms:
Higher lows structure 📊
Momentum expansion after consolidation
Breakout supported by trend-following averages
This setup favors controlled accumulation, not chasing.
🎯 ENTRY PLAN — STEALTH LAYERING STRATEGY
Instead of a single fixed entry, this plan uses a layered limit order approach to manage volatility and improve average price.
🔹 Layered Buy Limits (Example):
150.00
148.00
147.00
146.00
📌 You may add or adjust layers based on personal risk management and market volatility.
📌 Entry can also be taken at any price level depending on confirmation and execution style.
This method helps:
Reduce emotional entries
Improve risk-adjusted positioning
Adapt to pullbacks without panic
🛑 RISK MANAGEMENT (STOP-LOSS)
Protective Stop: 144.00
⚠️ Risk management is always trader-dependent.
This stop is a reference level, not a mandatory rule.
Adjust based on:
Account size
Risk tolerance
Timeframe preference
🎯 PROFIT OBJECTIVE
Primary Target: 158.00
This zone aligns with:
Strong historical resistance
Overbought conditions
Potential liquidity trap area
📌 Partial profit booking is encouraged near resistance.
📌 Capital protection > maximum profit.
🔍 ADDITIONAL CONFIRMATIONS TO WATCH
Volume expansion on continuation
Price holding above breakout structure
No aggressive bearish rejection near resistance
🔗 RELATED SYMBOLS TO WATCH (CORRELATION CHECK)
NYSE:KO (Coca-Cola) → Sector strength confirmation
AMEX:SPY → Overall market risk sentiment
AMEX:XLP → Consumer Staples sector momentum
📊 If AMEX:XLP & NYSE:KO remain strong, probability increases for NASDAQ:PEP follow-through.
⚠️ IMPORTANT NOTES
This is not financial advice
Market conditions can change rapidly
Always align execution with your personal trading plan
✨ “If you find value in my analysis, a 👍 and 🚀 boost is much appreciated — it helps me share more setups with the community!”
Disclaimer: This is a stealth-style trading strategy shared for educational and entertainment purposes only.
#PEP #PepsiCo #SwingTrading #NASDAQ #BullishBreakout
#LayeredEntry #TechnicalAnalysis #Stocks #TradingView

How I Spot Trading Opportunity – Part IILast week, we discussed how to spot trading opportunities using multiple asset classes. I also created multiple tabs for each asset class, such as currencies, commodities, and indices. Within each asset class, there are multiple products.
The whole idea is this: if you already have a trading methodology that is working well for you in a particular asset, say gold or silver, and you have been trading it for a long time, why not apply the same trading methodology across other markets?
It is not too difficult to pick up trading ideas fairly quickly from the market at any point in time. And I am going to share with you how I do that.
Micro E-mini Nasdaq Futures & Options
Ticker: MNQ
Minimum fluctuation:
0.25 index points = $0.50
Disclaimer:
• What presented here is not a recommendation, please consult your licensed broker.
• Our mission is to create lateral thinking skills for every investor and trader, knowing when to take a calculated risk with market uncertainty and a bolder risk when opportunity arises.
CME Real-time Market Data help identify trading set-ups in real-time and express my market views. If you have futures in your trading portfolio, you can check out on CME Group data plans available that suit your trading needs www.tradingview.com

25.12.16 Nasdaq Continues Lower / Short-Only Strategy Explained Welcome to ACID TRADE.
Hello everyone, today is December 16, 2025, and this is my Nasdaq chart analysis.
My name is Acid.
Reference chart:
Monday’s Nasdaq Result
Following the break below the lower boundary of the range, Nasdaq dropped an additional 250 points.
This downside move has continued into the Asian session, confirming sustained bearish momentum.
For those who took short positions, this move represents a profit zone of approximately $5,000 from entry.
Reference chart:
Current Nasdaq Outlook
At this point, I consider Nasdaq to have entered the blue-box range marked on the left side of the chart.
A strong rebound would normally be expected from this area, but so far, there is no clear sign of a meaningful bounce.
If price continues to make lower lows, short positions remain the only valid trading approach at this time.
Downside levels remain open toward 24,564 and 24,331.
For today, I do not see a favorable long setup, so I will not be sharing a buy scenario.
Conclusion
Nasdaq is currently moving in a step-by-step bearish structure with continued lower lows.
Today’s strategy is to focus on short positions only, but limit trades to up to one hour before the U.S. market opens, as economic data will be released at that time.
Market conditions may change after the data release, but at the moment, long positions appear too aggressive.
For those looking for longs, I recommend waiting and observing for now rather than forcing entries.

NQ Bear FlagLooking at the chart here still room down going off my levels from last week would need to break out of this flag to have any room up

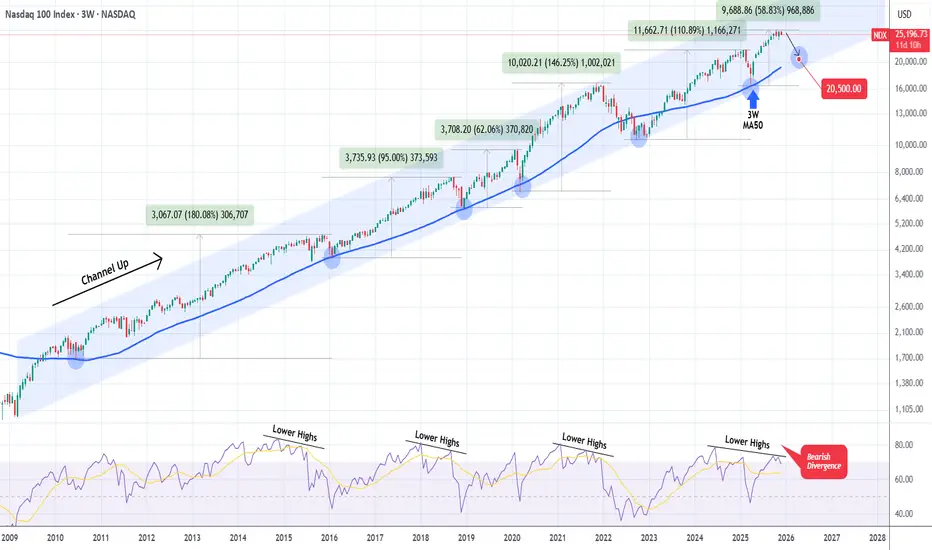
NASDAQ Time to correct hard until it reaches this level again.Exactly 6 months ago (June 20, see chart below), we posted the following analysis on Nasdaq (NDX), which helped us ride the rally following the April 07 2025 market low:
The reasoning behind this was that Nasdaq's low was on its 3W MA50 (blue trend-line), a key Support level which since 2009 and the start of the market's dominant multi-year Channel Up following the 2008 Housing Crisis, has offered 5 perfect long-term buy entries upon contact, only breaking once during the 2022 Inflation Crisis.
Now that the 3W RSI is displaying a Lower Highs Bearish Divergence (against the price's Higher Highs) that has been formed on another 3 prior Cycle Tops, we expect the market to start reversing soon for another cyclical correction. Technically another Bearish Leg for the dominant Channel Up.
Naturally, we expect it to reach at least the 3W MA50 again. Based on its trajectory, it is possible for contact to be made around 20500. Keep in mind again that absolute pricing isn't the important thing here, timing is. The most optimal time to buy based on this high accuracy model, is upon contact with the 3W MA50, regardless of the price it is at, so don't get fixed on 20500, but it is a fair projection based on the trend.
---
** Please LIKE 👍, FOLLOW ✅, SHARE 🙌 and COMMENT ✍ if you enjoy this idea! Also share your ideas and charts in the comments section below! This is best way to keep it relevant, support us, keep the content here free and allow the idea to reach as many people as possible. **
---
💸💸💸💸💸💸
👇 👇 👇 👇 👇 👇
25.12.15 Nasdaq Analysis ScriptWelcome to ACID TRADE.
Hello everyone, today is December 15, 2025, and this is my Nasdaq market analysis.
My name is Acid.
Friday’s Analysis – Result Review
Reference chart:
Let’s begin by reviewing Friday’s analysis.
In the previous briefing, I stated that a break below 25,400 would likely trigger strong downside momentum, with 25,200 as the primary target.
As shown on the chart, Nasdaq dropped approximately 253 points in less than one hour, resulting in a profit zone of roughly $5,000 per contract.
This move confirmed that the downside structure and liquidity below 25,400 were valid.
Daily Chart Outlook
Reference chart:
Now let’s move to the daily timeframe.
Currently, Nasdaq has entered the Ichimoku cloud.
Price action within the cloud suggests that the market has not yet chosen a clear direction, but historically this structure allows for one-directional downside moves once bearish momentum expands.
From the current level, the lower boundary opens downside potential toward approximately 23,990, which represents nearly a 5% decline.
Additionally, Friday’s closing low and today’s early-session low are located at very similar levels.
This makes 25,147 a critical support — a clean break below this level would strongly indicate further downside continuation.
15-Minute Strategy – Long Scenario
Reference chart:
Let’s move on to today’s 15-minute trading strategy, starting with the bullish scenario.
For Nasdaq to resume an upside move, we need a break above the resistance trendline, combined with a break above the upper supply zone.
Following Friday’s sell-off, price is forming a short-term triangle compression.
However, this structure developed over a very short time period, which reduces its reliability.
Because of that, the focus should be on key price levels, not the pattern itself.
A bullish bias becomes valid only if price breaks above 25,400–25,430.
If this level is reclaimed, long positions can be considered.
Upside targets:
25,483 → 25,566 → hold for potential extension.
15-Minute Strategy – Short Scenario
Reference chart:
Now for the bearish scenario.
The short-term ascending trendline currently sits near 25,180, but its reliability is low since it aligns closely with recent lows formed on Friday and today.
From a strategic perspective, the cleaner short setup comes from a break below Friday’s low rather than an early trendline entry.
The downside target is based on the daily structure.
Specifically, the opening price of the strong bullish candle marked by the blue box.
This level is located near 25,027, which also aligns with the daily 60-period moving average.
If this level breaks, a move toward 25,027 within today’s session becomes highly probable.
Conclusion
Nasdaq remains in a high-risk decision zone inside the daily cloud.
A break below 25,147 increases the probability of downside acceleration.
Upside is only valid above 25,400–25,430 with confirmation.
Until a breakout occurs, expect range-bound volatility.
Trade the levels, not the emotion.

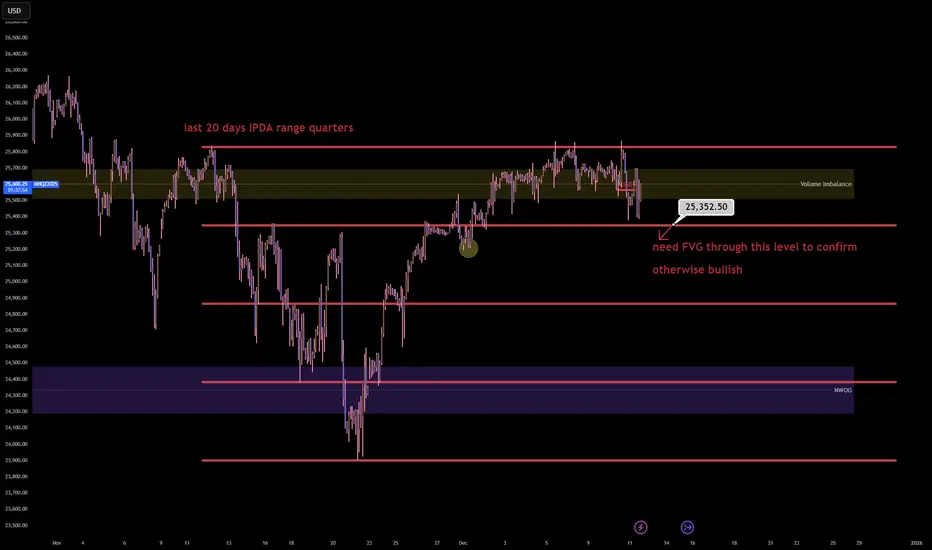
NQ1! (Nasdaq 100) has entered the terminal phaseThe Nasdaq 100 has entered the terminal phase of its 20 day institutional dealing range and is currently executing a distribution program within the premium quartile. The failure to sustain price acceptance above the 25,700.00 Volume Imbalance suggests the algorithm is preparing for a mean reversion event to rebalance the monthly ledger.
The present price action represents a classic 'Bull Trap' at the upper boundary of the range where retail momentum is being absorbed by institutional limit sell orders ahead of a repricing to equilibrium.
Entry: 25,550.00 (Sell Limit)
Stop loss: 25,880.00 (330.00 points)
Take profit: 24,850.00 (700.00 points)
Risk to reward ratio: 2.12R
CME_MINI:NQ1! CME_MINI:MNQ1! IG:NASDAQ
The Opportunity
The 20 day IPDA lookback reveals that price is oscillating within a defined premium distribution block between 25,350.00 and 25,850.00. The market has expended significant energy to reach this valuation but has failed to close the daily candles above the key Volume Imbalance at 25,700.00.
This rejection signature implies that the 'Santa Rally' narrative has been utilized to engineer exit liquidity for smart money positions accumulated at the lows. The algorithm is an efficiency engine and it cannot justify a new macro expansion leg without first revisiting the internal range equilibrium to capitalize the move.
The Entry
Initiating a short position in the 25,550.00 to 25,600.00 zone aligns with the institutional logic of selling the upper 25% of the monthly range. This zone offers the highest statistical edge as it places the entry directly against the 'Ceiling' of the current volatility profile while targeting the 'Floor' of the recent expansion.
The Volume Imbalance acts as a natural defensive barrier for the stop loss as the algorithm will typically respect this array during a distribution phase.
The Invalidation
The bearish causal chain is ontologically corrupted if price achieves a daily close above the 25,880.00 range high. Such an event would signify a 'Blue Sky' breakout and a shift in regime from range bound to trending.
If the market accepts price above this threshold it implies that the premium valuation has become the new floor and the algorithm is targeting the 26,000.00 psychological level.
Key Trajectory Waypoints
Target 1: 25,350.00 | Type: 75% Range Quartile | Probability: 70% | ETA: 24 Hours
Target 2: 24,850.00 | Type: Range Equilibrium (50%) | Probability: 60% | ETA: 2-3 Days
Target 3: 24,400.00 | Type: NWOG / Discount Target | Probability: 40% | ETA: Next Week
The Shadow Reality
A 35% probability exists for the antithetical reality: The Range Expansion.
In this scenario the current consolidation is a 'High Tight Flag' and the algorithm ignores the equilibrium requirement to force a squeeze into the 26,000.00 level immediately.
This reality is confirmed if price holds above 25,650.00 for two consecutive 4 hour closes.
$NQ NASDAQ/US100 Bearish W Pattern Target Hit, Next Quick UpdateHi
The W pattern completed as expected and after that it fell. It reached the first bearish target. I personally am not looking for any more bearishness. I an bullish from the current levels. However I trade what I see and will plan after seeing the latest price action.
There was a big gap let. All these gaps may or may not get filled but they are important levels. So if the markets becomes bullish again, it may try to go higher from the current levels o fill that gap to the upside.
These is a previous gap level which can also provide support if the market falls from the current levels.
Trade what you see, wait for the confirmations and manage the risk as always.
Follow for more. Please support this analysis by liking, commenting, and sharing with friends, colleagues, traders, and trading communities. Thanks👍🙂

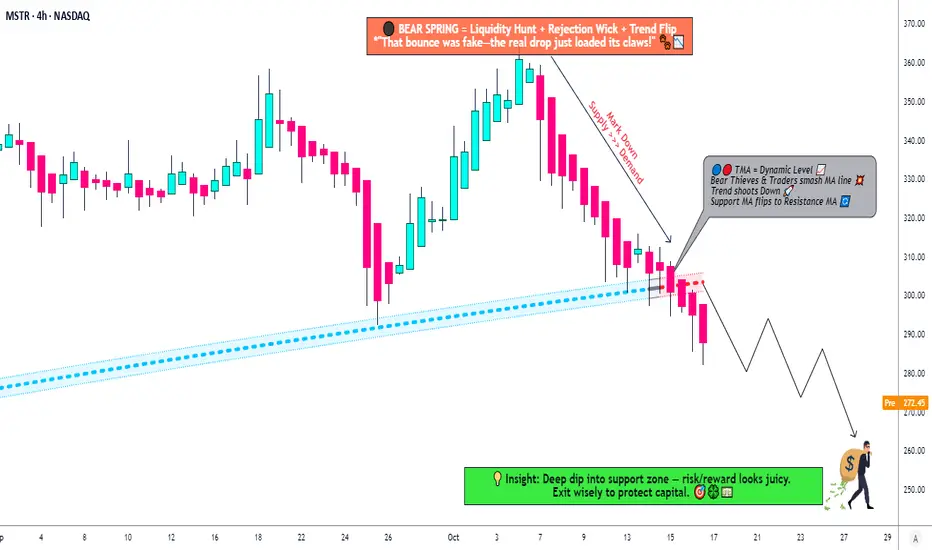
MSTR: Time to Short? Death Cross + Triangle Break Analysis🐻 MSTR "STRATEGY INC." - The Bear's Playground | Thief's Multi-Layer Setup 💰
📊 MARKET SNAPSHOT
Asset: NASDAQ:MSTR (Strategy Inc. - formerly MicroStrategy)
Current Price: ~$291.23 (Oct 17, 2025)
Setup Type: Swing/Day Trade - Bearish Confirmation
Strategy Style: "Thief Method" - Layered Limit Orders 🎯
🔍 THE SETUP - Why This Bearish Play Makes Sense
Ladies and Gentlemen, welcome to the Thief's playbook! 👋 MSTR just gave us a beautiful bearish signal with a triangular moving average breakdown. Here's what the charts are screaming:
🎯 The "Thief" Entry Strategy - Layered Limit Orders
This isn't your typical "buy now" play. We're sneaking in like a thief in the night with MULTIPLE SELL LIMIT LAYERS:
Entry Zones (Layer Your Shorts):
Layer 1: $310 (First resistance retest)
Layer 2: $300 (Psychological level)
Layer 3: $290 (Current consolidation zone)
💡 Pro Tip: Scale into your position! You can add MORE layers based on your risk tolerance (e.g., $305, $295, $285). The "Thief Method" is all about spreading your entries to catch the perfect price zones.
🛑 RISK MANAGEMENT - The Thief's Insurance Policy
Stop Loss: $320 🚨
(This is the Thief's emergency exit - if price breaks above this, the bears lost control)
⚠️ IMPORTANT NOTE:
Dear Thief OG's (Original Gangsters), this is MY stop loss level based on MY analysis. You should set YOUR OWN stop loss based on YOUR risk tolerance. Don't copy blindly - manage YOUR money, take YOUR profits (or losses) at YOUR own risk! This is YOUR trade, not mine. 💯
🎯 PROFIT TARGET - Where the Money's Hiding
Primary Target: $250 🎉
Why $250?
Strong historical support level
Oversold bounce zone (RSI typically rebounds here)
TRAP ALERT: Institutional buyers often accumulate at this level - be ready to ESCAPE with your profits before the bulls wake up! 🐂💤
⚠️ TAKE PROFIT NOTE:
Dear Thief OG's, $250 is MY target based on MY analysis. You can (and should) set YOUR own targets. If you're in profit at $270, $260, or even $280 - TAKE THE MONEY AND RUN! 💰 No shame in banking profits early. Remember: pigs get fat, hogs get slaughtered. This is YOUR trade, YOUR risk, YOUR decision!
🔗 RELATED ASSETS TO WATCH - The Correlation Game
MSTR doesn't trade in a vacuum! Keep your eyes on these correlated assets:
📈 Primary Correlation:
CRYPTOCAP:BTC (Bitcoin): ~$108,625 (Oct 17, 2025) - MSTR holds 640,000+ BTC (3%+ of total supply!)
Correlation Strength: 🔥🔥🔥🔥🔥 ULTRA HIGH
Why It Matters: MSTR is essentially a leveraged Bitcoin play. When BTC sneezes, MSTR catches a cold. Bitcoin's current bearish pressure directly impacts MSTR's valuation.
🔄 Secondary Watchlist:
NASDAQ:COIN (Coinbase): Crypto exchange - sentiment indicator
NASDAQ:RIOT (Riot Platforms): Bitcoin mining stock
NASDAQ:MARA (Marathon Digital): Another BTC-related equity
NASDAQ:CLSK (CleanSpark): Bitcoin mining operations
Key Point: If Bitcoin breaks below $105K support, expect MSTR to accelerate downward. Conversely, if BTC rallies back above $115K, this bearish setup could invalidate. Watch Bitcoin like a hawk! 🦅
📊 THE BIGGER PICTURE - Why MSTR Is Vulnerable Right Now
Bitcoin Pressure: BTC down -2.19% today, testing critical support levels
Institutional Caution: Recent S&P 500 rejection (not included in index) = credibility questions
Valuation Concerns: Trading at significant premium to NAV (Net Asset Value)
Technical Breakdown: Multiple MA crosses + trend reversal signals
Macro Headwinds: Risk-off sentiment in crypto markets (3-day consecutive decline)
🎓 THE THIEF'S WISDOM - Final Thoughts
This setup combines:
✅ Technical confirmation (MA breakout)
✅ Layered entry strategy (better average price)
✅ Clear risk management (defined stop loss)
✅ Realistic profit targets (strong support zone)
✅ Correlated asset monitoring (BTC relationship)
Remember: The market doesn't care about your opinion. Respect the charts, manage your risk, and don't get greedy. The "Thief Method" is about stealing profits intelligently, not gambling recklessly! 🎰❌
💬 TRADE SMART, NOT HARD!
This is a BEARISH SETUP with defined entries, exits, and risk parameters. Whether you're swing trading or day trading, the key is DISCIPLINE. Stick to your plan, don't chase, and protect your capital.
Questions? Thoughts? Drop them below! 👇
Let's build a community of smart traders who help each other win! 🤝
✨ If you find value in my analysis, a 👍 and 🚀 boost is much appreciated — it helps me share more setups with the community!
#MSTR #Bitcoin #BTC #TradingView #SwingTrading #DayTrading #BearishSetup #ShortSetup #CryptoStocks #TechnicalAnalysis #MovingAverages #LayeredEntry #RiskManagement #ProfitTarget #StrategyInc #MicroStrategy #ThiefMethod #TradingStrategy #StockMarket #NASDAQ
Nasdaq - The final blow-off top!⚰️Nasdaq ( TVC:NDQ ) can rally a final +25%:
🔎Analysis summary:
Just this month, we witnessed quite some volatility on the Nasdaq with a correction of about -10%. However, bulls immediately stepped in and clearly pushed price higher. Since there is still bullish pressure, a final blow-off top rally in the near future is quite likely.
📝Levels to watch:
$25,000 and $30,000
SwingTraderPhil
SwingTrading.Simplified. | Investing.Simplified. | #LONGTERMVISION

25.12.12 Nasdaq AnalysisWelcome to Acid Trade.
Hello everyone, as of December 12th, 2025, I will be analyzing the Nasdaq chart today.
This is Acid.
15 Minute Chart Analysis
Let’s first review yesterday’s results.
In the previous video, I mentioned that a long position should be taken once the resistance trendline and the 25,566 level were broken.
That breakout occurred at the white circle, and from that entry, the market climbed approximately 152 points, resulting in a $3,000 profit.
For the short-side opportunity, the entry occurred when the rising trendline after the market opened was broken.
This sell signal appeared at the blue circle and led to a 186-point decline, giving a $3,720 profit.
Therefore, the total profit for December 11th was $6,720.
Daily Chart Analysis
Looking at yesterday’s candle (December 11), the price tapped the daily 20-EMA and bounced back, leaving a long lower wick.
Nasdaq is currently trading inside a previous volume zone, with the downside open toward 25,120 and potentially 24,945 if momentum continues lower.
Today’s Strategy
Today, Nasdaq temporarily broke below the short-term rising trendline, but this happened due to a pre-market gap-down, creating the yellow-box gap zone.
Because the sell-off was not strong and price action remains sideways, the market is effectively consolidating.
At the moment, Nasdaq is forming a larger box range:
Top: 25,879 forming a double top
Bottom: 25,400 forming a double bottom
A breakout from either side will likely determine the next major trend direction.
Today’s trading strategy should focus on identifying that breakout level and reacting once confirmation appears.
Conclusion
Nasdaq is moving within a key range between 25,879 and 25,400, and a breakout will define the next major trend direction.
Watch for a confirmed break with supporting volume before taking a position.
Today’s session is all about timing the breakout and reacting quickly.

NQ is bullish.Let's see if NASDAQ is bullish. Interest rate decision is today (3pm NYT) so NASDAQ is particularly volatile today. If price can break and stay above 25867 then probably it will continue bullish. The volatility after the announcement might add fuel for it to push up further. It's a risk. Happy trading.

NAS100 Retest of POC: Bullish Break or Deeper Correction?I'm keeping a close eye on NASDAQ (NAS100) right now 📉📈. We’re seeing a deep pullback—a strong retracement that makes everyone ask the classic question:
Does this want to keep pushing lower and give us a bearish weekly candle, or is it gearing up to hold a level and rally back with the higher-timeframe trend?
For me, I’m a trend-continuation trader. Even if the weekly candle prints bearish, I’m not interested in selling into higher-timeframe strength. I’d rather stay patient and stick with the bigger trend direction 🧭.
Here’s the key level I’m watching:
If NAS100 can break back above the Volume Profile POC (Point of Control) — which is basically the high-value area acting as support right now — then I’ll be looking for long opportunities.
But if price breaks below the POC, that invalidates the idea and I’ll step aside. No need to force anything 👍.
Not financial advice ⚠️

NQ1! — Fed Week: 25,650 Inflection | Tight Decision📊 NQ1! NASDAQ 100 E-MINI FUTURES
December 9, 2025 | by officialjackofalltrades
🟡 CAUTIOUS |Fed Week Special Edition
EXECUTIVE SUMMARY - THE PRE-FED SETUP
Current Price: $25,651.50 | Date: December 9, 2025 | Change: -$48.25 (-0.19%)
The Nasdaq 100 E-mini futures are consolidating in a tight range between 25,000-26,300 as markets brace for tomorrow's Federal Reserve decision. After December E-mini Nasdaq futures rose +0.10% on Tuesday, the index is now sitting in a critical decision zone with massive implications for tech stocks.
The Technical Picture:
Pattern: Range-bound consolidation (4 weeks)
Current Position: Middle of range at 25,650
Resistance: 26,200-26,300 (tested multiple times, rejected)
Support: 24,700-24,900 (solid floor since November)
Key Level: 25,200 (bull/bear line)
The Fundamental Backdrop:
Big Tech was mixed at the close: Amazon booked a modest gain, while Apple, Meta and Microsoft finished slightly in the red. More importantly, These industry titans have consistently outpaced the broader S&P 500, with the S&P 500 Top 10 rising over 600% in total since January 1, 2016.
But here's the tension: AI capex coming from tech companies listed in the S&P 500 is $400 billion or more per year, going forward. The biggest AI company OpenAI has disclosed revenues of just $13 billion for 2025.
The Trade: Long from 25,200-25,600, target 26,500-27,200, stop 24,650. Risk/reward: 1:2.5 .
MARKET CONTEXT - WHAT'S REALLY HAPPENING
The Pre-Fed Paralysis
Stock indexes gave up early gains and settled mixed on Tuesday as bond yields climbed after the Oct JOLTS report showed job openings unexpectedly rose to a 5-month high.
This is classic pre-FOMC behavior : markets waiting for the catalyst before committing.
Investing.com - U.S. stock futures inch down ahead of the start of trading for December, with investors keeping tabs on a possible rate cut.
The AI Valuation Debate
Here's what's creating the consolidation: AI optimism vs. valuation concerns .
BULLISH CAMP:
Nvidia leads the tech sector with a market cap of $4.4 trillion
24/7 Wall St. forecast projects Nvidia revenue rising from $121 billion in 2025 to more than $265 billion by 2030
For the Mag 7 group, total earnings are expected to increase by +12.6% on +9.5% higher revenues in 2025
BEARISH CAMP:
OpenAI may have lost $12 billion in the third quarter of 2025 alone, according to a disclosure by Microsoft
806 Russell 2000 companies (40%) have no earnings or negative earnings
The revenues currently being generated by AI companies are far smaller than the amount of capex being directed at them
My Take: This is why NQ is stuck in range. Bulls see AI growth, bears see bubble. Fed decision tomorrow will tip the scale.
TECHNICAL ANALYSIS - THE RANGE-BOUND BATTLE
Pattern: Consolidation Rectangle (4 Weeks)
Your purple boxes perfectly capture the support/resistance clusters . Let me break down what the chart is telling us:
Key Technical Levels:
🔴 RESISTANCE (Selling Zones):
26,200-26,300: Tested 4 times since November, strong rejection zone
26,500-26,700: If we break above, this is next target
27,000-27,200: Extension target if Fed is dovish
🟢 SUPPORT (Buying Zones):
25,200-25,400: Minor support, current price zone
24,900-25,100: Major support cluster (your bottom purple box)
24,700-24,800: Absolute floor, tested Nov 19
24,300-24,500: Nuclear support if range breaks
Current Position: The Nasdaq 100 Futures price has ranged from 25,657.50 to 25,693.75 today extremely tight range showing indecision.
Technical Indicators:
Moving Averages:
50-day MA: ~25,400 (acting as support)
200-day MA: ~24,200 (long-term uptrend intact)
Golden Cross: Active since October = bullish
Volume:
The current trading volume for Nasdaq 100 Futures is 6,395 very low , typical pre-Fed paralysis.
RSI:
Currently: ~52-55 (neutral)
Not overbought (room to run)
Not oversold (no panic)
MACD:
Flat, coiling for breakout
Waiting for directional catalyst
SCENARIO ANALYSIS - THREE FED OUTCOMES
SCENARIO A: Dovish Cut (55% Probability) - BULLISH
What Happens:
Fed cuts 25bps ✓
Dot plot shows 3-4 more cuts in 2026 ✓
Powell emphasizes "labor market concerns" ✓
Tech gets green light to continue AI spending ✓
Market Reaction:
Immediate: NQ pumps 1.5-2% to 26,000-26,200
Day 1-3: Breakout above 26,300, test 26,700
Week 1-2: Rally to 27,000-27,500
Month 1: Target 27,800-28,200 (+9-10%)
Winners:
Nvidia (NVDA), AMD (AMD), Broadcom (AVGO) lead
Mag 7 outperform
High-growth tech rallies hard
Trade Setup:
Enter: Current 25,650 OR breakout above 26,300
Add: On pullback to 26,000 after breakout
Target: 27,500 (+7.2%)
Stop: 25,100 (-2.1%)
Risk/Reward: 1:3.4
SCENARIO B: Hawkish Cut (35% Probability) - CHOPPY
What Happens:
Fed cuts 25bps ✓
BUT dot plot shows only 1-2 cuts in 2026 ❌
Powell says "inflation still concerning" ❌
Tech valuations questioned ❌
Market Reaction:
Immediate: NQ drops 1-1.5% to 25,200-25,400
Day 1: Volatility, test 24,900 support
Week 1-2: Choppy recovery to 25,800-26,000
Month 1: Grind back to 26,200-26,500 (+2-3%)
Losers:
High-valuation AI stocks hit hard
Stocks with high capex vs. revenue scrutinized
Small caps underperform
Trade Setup:
DO NOT chase before Fed
Buy: Dip to 24,900-25,100 (support)
Target: 26,000-26,300 (+5-6% from dip)
Stop: 24,650 (-2%)
Risk/Reward: 1:2.5
SCENARIO C: No Cut OR Very Hawkish (10% Probability) - BEARISH
What Happens:
Fed HOLDS at 3.75-4% ❌
OR cuts but says "this is the last one" ❌
Powell cites AI bubble concerns ❌
Tech sell-off accelerates ❌
Market Reaction:
Immediate: NQ crashes 2-3% to 24,700-25,000
Day 1: VIX spikes, panic selling
Week 1-2: Test 24,300-24,500
Month 1: Bottom around 23,800-24,200 (-7-8%)
Trade Setup:
Exit ALL longs immediately
Wait for capitulation
Buy: 24,000-24,300 (major support)
Target: Recovery to 25,500-26,000 (+6-8%)
High stress, high reward
THE TRADE SETUP - PROFESSIONAL EXECUTION
🟢 PRIMARY LONG SETUP: BUY NQ1!
Entry Strategy (Scale In):
Option A: Conservative (Wait for Dip):
25,000-25,200 (IF hawkish dip)
24,800-25,000 (IF deeper dip to support)
Best for: Risk-averse traders
Stop Loss: 24,650 (HARD STOP)
Below 24,650 = range break on daily
Below this = technical structure invalidated
Max loss from 25,650 entry:
Take Profit Targets:
TP1: 26,200-26,500
Range breakout + resistance retest
Action: Take 40% profit, move stop to 25,200
Gain: +2.1-3.3% | Risk/Reward: 1:2
TP2: 27,000-27,500
Momentum continuation post-Fed
Technical indicators show Strong Buy signal
TP3: 27,800-28,200
Full breakout, AI optimism returns
Long-term forecast shows potential to $28,452
Entry Confirmation Checklist:
Before entering, CHECK:
✅ Price holding above 25,200 (bull/bear line)
✅ Volume spike on bounce (15K+ contracts on 4H)
✅ Fed announces 25bps cut (as expected)
✅ Powell's tone dovish or neutral (not hawkish)
✅ Mag 7 stocks holding up (NVDA, MSFT, AAPL)
✅ VIX below 16 (fear contained)
WAIT FOR 4/6 BEFORE FULL POSITION
Use Micro E-minis (MNQ) for Better Sizing:
MNQ = $2/point (vs NQ $20/point)
Same moves, 1/10th capital
Better for risk management
Fed Day Protocol (December 10):
2:00 PM ET - Fed Statement:
Tighten stops to 25,100 before announcement
READ statement immediately
Ignore first 5 minutes (algo chaos)
2:30 PM ET - Powell Press Conference:
WATCH LIVE - tone matters more than words
Dovish = add to position on dip
Hawkish = cut 50%, tight stops
5. Emergency Exits:
❌ Daily close below 24,650 = EXIT ALL
❌ VIX spikes above 22 = EXIT 50%
❌ Fed announces NO cut = EXIT ALL
❌ Powell says "last cut for 6+ months" = EXIT 50%
❌ Mag 7 stocks crash 3%+ = EXIT 50%
FUNDAMENTAL ANALYSIS - THE AI CONUNDRUM
CATALYST #1: The Magnificent 7 Dominance
Nvidia, Microsoft, and Apple make up 20.7% of the S&P 500 and 43.6% of the Vanguard Information Technology ETF.
This concentration means:
NQ lives or dies by Mag 7 performance
Fed policy directly impacts these valuations
Any weakness cascades fast
Current Status:
Nvidia: $4.37T market cap
Apple: $4.20T market cap
Microsoft: $4T+ market cap
CATALYST #2: The AI Spending Paradox
Here's the $400 billion question :
AI capex from S&P 500 tech companies is $400 billion or more per year. The biggest AI company OpenAI has disclosed revenues of just $13 billion for 2025.
The Math Doesn't Add Up:
Spending: $400B/year
Revenue: $13B/year
Gap: $387B/year of unprofitable spending
"Can the 10 AI companies generate enough revenue to justify the capex?"
says Torsten Sløk, chief economist at Apollo Global Management.
BUT: Nvidia revenue projected to rise from $121B in 2025 to $265B by 2030 revenue IS growing, just not fast enough yet.
CATALYST #3: Earnings Growth Remains Strong
Mag 7 earnings expected to increase +12.6% on +9.5% higher revenues in 2025.
Excluding the Mag 7, total earnings for remaining S&P 500 companies expected to grow +8.7% in 2025.
Translation: Even without AI hype, earnings are solid.
CATALYST #4: Fed Policy is CRITICAL
With U.S. 10-year Treasury yields hovering just above 4% and the Fed set to decide on a widely expected rate cut, growth stocks remain sensitive to even small changes in rate expectations.
Why This Matters:
Lower rates = higher valuations for growth
Higher rates = multiple compression
Tech has highest duration risk
RISK FACTORS - THE BEAR CASE
RISK #1: AI Bubble Concerns
Nvidia's Jensen Huang says he doesn't believe we're in an AI bubble. Amazon's Jeff Bezos says we probably are in one. OpenAI's Sam Altman has invoked a bubble, adding, "I do think some investors are likely to lose a lot of money".
Even AI leaders are split!
RISK #2: Valuation Stretched
OpenAI may have lost $12 billion in Q3 2025 alone, yet is valued at $500 billion by VCs.
If valuations reset, NQ drops 15-20%.
RISK #3: Concentration Risk
Since October 2022, roughly 75% of gains in S&P 500 have come from just seven stocks.
If Mag 7 stumbles, entire index falls .
RISK #4: Technical Breakdown
Break below 24,650 = target 23,800-24,200 (-6-7%)
THE BOTTOM LINE
Here's what I KNOW on December 9, 2025:
✅ Fed expected to cut 25bps tomorrow
✅ NQ technical indicators show Strong Buy
✅ Mag 7 earnings growing +12.6% in 2025
✅ NQ in consolidation range 25,000-26,300
✅ Support at 24,900 has held 4 times
✅ Your purple boxes show clear support/resistance
Here's what I DON'T know:
Will Powell be dovish or hawkish?
How many 2026 cuts will dot plot show?
Will AI bubble concerns accelerate?
But here's the MATH:
Risk: 25,650 → 24,650
Reward: 25,650 → 27,500
Extended: 25,650 → 28,200
The Play:
Small position NOW 25,650
IF hawkish dip to 24,900-25,100
IF dovish → ADD on breakout above 26,300
Stop 24,650
Target 27,500, then 28,200
Position accordingly.
Follow officialjackofalltrades for institutional-grade futures analysis, Fed-day strategies, and professional risk management.
Drop a 📊 if you're trading NQ through the Fed decision.
Drop a 🎯 if this analysis helped your setup.
Drop a 💰 if you're ready for 27,500+ breakout.
Disclaimer: This is not financial advice. This post is for educational and informational purposes only. Always do your own research and manage your own risk.

AMD Hull MA Pullback: Strong Upside Projection Ahead!🔥 AMD Profit Playbook — Hull MA Pullback Power Move 🔥
Asset: AMD – Advanced Micro Devices Inc.
Market: NASDAQ
Style: Day/Swing Trade Profit Playbook
📈 Trade Thesis
The bullish structure stays intact with a clean HULL Moving Average pullback confirming continued upside momentum. The flow remains constructive as long as price respects trend behavior and avoids deep retracements.
🎯 Entry Plan
You can enter at any valid price zone based on your personal system, confirmation signals, or preferred demand levels. Traders use different timing tools — choose what aligns with your process. ⚙️📊
🛑 Stop Loss Zone
SL: 160.00
This is the “Thief SL” level — tight, sharp, and designed for aggressive traders only.
Note: Dear Ladies & Gentlemen (Thief OG’s), this is not a mandatory SL. Choose your own SL based on your risk appetite. Your money = your responsibility. Stay smart, stay safe. 💼⚠️
🎯 Take Profit Targets
Target 1 → 236.00
📌 Strong resistance + trap + liquidity pocket — smart place to escape with clean profits.
Target 2 → 260.00
📌 Heavy resistance + overbought zone + trap formation — high-reaction level, so secure profits before the crowd reacts.
Note: Dear Ladies & Gentlemen (Thief OG’s), TPs are guidance only. You decide your exits. You make money → you take money at your own risk. 💸🫡
👀 Related Pairs to Watch (Correlated / Sector Influence)
These tickers often react together due to semiconductor sector rotation, AI-demand cycles, and ETF weightings:
NASDAQ:NVDA
– Direct peer. Moves with AI spending cycles. Large swings can influence AMD sentiment.
NASDAQ:SMH (VanEck Semiconductor ETF)
– Sector trend indicator. If SMH pumps, AMD usually follows.
NASDAQ:SOXX (iShares Semiconductor ETF)
– Broad chip-market strength gauge. Market-wide chip themes impact AMD direction.
NASDAQ:QCOM
– Tech-chip correlation, especially during macro chip-cycle expansions.
NYSE:TSM
– Manufacturing leader. Capacity signals often impact AMD pricing expectations.
Watching these pairs helps you gauge risk-on/off behavior across semiconductors and improves timing on AMD entries/exits. ⚡📊
📘 Final Notes
This setup is crafted for fun with a “thief-style trading twist”, but still aligned with proper technical structure and TradingView’s rules.
Nothing here is a financial recommendation — just pure charting vibes, strategy style, and technical storytelling. 🎨📉📈
✨ “If you find value in my analysis, a 👍 and 🚀 boost is much appreciated — it helps me share more setups with the community!”
Disclaimer:
This is thief-style trading strategy just for fun. Not financial advice. Trade responsibly.
#AMD #NASDAQ #SwingTrade #DayTrade #HULLMA #BullishSetup #LiquidityZones #Semiconductors #SMH #SOXX #NVDA #TSLAstyleCharts #PriceAction #TechnicalAnalysis #ThiefStyleTrader 🚀🔥

Bearish Scenario on NQEyeing a bearish scenario on NQ after retracing it to 0.5 to 0.618 fib levels.
Bearish points
- Bearish Divergence on daily
- Rising wedge broken and retested
- Head n shoulder forming
Just waiting on breaking 24000 level to take a legendary short. And I beleive it should retrace back to atleast 0.5 fib level which is close to 21430.
Let's see....
Currently it seems it is going to pump from here to make a LH and then drop from there since it's oversold on Daily timeframe.
Please share your thoughts.

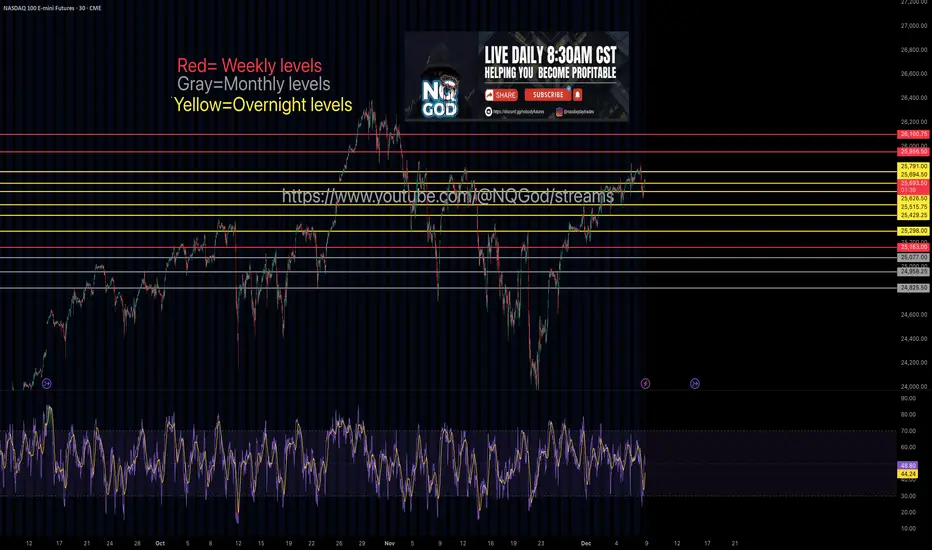
NQ Weekly, monthyl, Overnight levels from a Funded traderPing me with any quetions pretty straight forward levels here
NASDAQ formed its 1st 4H Golden Cross in 7 months!Nasdaq (NDX) completed last Friday its first 4H Golden Cross formation in more than 7 months (since May 01). This is taking place while the index is inside a Channel Up, making a V-shaped recovery from the November 21 Low.
The last time all the above conditions were fulfilled was exactly during the May Golden Cross. With the 4H MA200 (orange trend-line) as its Support, the index eventually hit its previous All Time High (ATH).
As we've entered the Fed week, we can finally see this move to the ATH Resistance, so our short-term Target on Nasdaq remains 26200.
---
** Please LIKE 👍, FOLLOW ✅, SHARE 🙌 and COMMENT ✍ if you enjoy this idea! Also share your ideas and charts in the comments section below! This is best way to keep it relevant, support us, keep the content here free and allow the idea to reach as many people as possible. **
---
💸💸💸💸💸💸
👇 👇 👇 👇 👇 👇

NASDAQ 100 (NQ1!): Bullish! Look For Valid Buys Only!Welcome back to the Weekly Forex Forecast for the week of Dec. 8 - 15th.
In this video, we will analyze the following FX market: NASDAQ (NQ1!) NAS100
The NASDAQ is showing bullish order flow, and it has been strong over the past couple of weeks.
Trading above 25,600 is making looking for shorts a no no.
A weakened US Dollar supports the idea of higher prices.
Wait for valid buy setups.
Enjoy!
May profits be upon you.
Leave any questions or comments in the comment section.
I appreciate any feedback from my viewers!
Like and/or subscribe if you want more accurate analysis.
Thank you so much!
Disclaimer:
I do not provide personal investment advice and I am not a qualified licensed investment advisor.
All information found here, including any ideas, opinions, views, predictions, forecasts, commentaries, suggestions, expressed or implied herein, are for informational, entertainment or educational purposes only and should not be construed as personal investment advice. While the information provided is believed to be accurate, it may include errors or inaccuracies.
I will not and cannot be held liable for any actions you take as a result of anything you read here.
Conduct your own due diligence, or consult a licensed financial advisor or broker before making any and all investment decisions. Any investments, trades, speculations, or decisions made on the basis of any information found on this channel, expressed or implied herein, are committed at your own risk, financial or otherwise.

NAS100 Trade Opportunity: Will Buyers Defend the Pullback?📊 NAS100 (NASDAQ-100) Swing Trade Opportunity 🚀
Bullish Pullback Setup | Super Trend ATR + TMA Confirmation
🎯 TRADE SETUP OVERVIEW
Instrument: NAS100 (NASDAQ-100 Index)
Timeframe: Swing Trade (4H-Daily)
Bias: BULLISH ✅
Setup Type: Super Trend ATR Line Pullback + Triangular Moving Average (TMA) Confirmation
🎬 ENTRY STRATEGY - "LAYERING METHOD" 📍
This strategy employs multiple limit order placement (Layer Entry Technique) to optimize entry points during the pullback phase.
Recommended Layer Entry Points:
🔵 Layer 1: 24,500
🔵 Layer 2: 24,600
🔵 Layer 3: 24,700
🔵 Layer 4: 24,800
⚡ Pro Tip: Scale layers based on your account size and risk tolerance. Each layer reduces average entry price.
🛑 STOP LOSS (SL)
Primary SL Level: 24,300
Strategy: Placed below the latest swing low + Super Trend confirmation
⚠️ DISCLAIMER: This SL is a guideline only. You must adjust based on your personal risk management strategy and account equity. Risk is YOUR responsibility.
🎁 PROFIT TARGETS (TP)
PRIMARY TARGET (TP1): 25,700 🎯
First resistance zone
Ideal for taking partial profits
Recommended exit: 30-50% position
SECONDARY TARGET (TP2): 26,200 🔥
Strong resistance + Historical overbought zone
⚠️ TRAP ALERT: Expect potential reversal or consolidation
Recommended exit: Remaining 50-70% position
Use trailing stop for final portion
📈 TECHNICAL CONFIRMATION
✅ Super Trend ATR: Aligned bullish
✅ TMA (Triangular MA): Pullback to key level confirmed
✅ Higher Lows Pattern: Intact
✅ Volume Analysis: Supporting move
🔗 RELATED PAIRS TO WATCH 💡
Positive Correlation (Move Together):
🔴 SPY (S&P 500 ETF) - $380-395 Range
Correlation: +0.92 | Often leads NAS100 lower-cap stocks
Key Point: If SPY breaks $390, expect NAS100 momentum confirmation
Watch for divergence signals
🔴 QQQ (Invesco QQQ Trust - Nasdaq 100 ETF) - $450-470 Range
Correlation: +0.99 | DIRECT tracking of NAS100
Key Point: Primary barometer for Nasdaq sentiment
Use for volume + volatility confirmation
🔴 TECH Sector ETF (XLK) - $205-215 Range
Correlation: +0.88 | Tech-heavy holdings overlap
Key Point: Tech rotation affects Nasdaq flow
Monitor for sector strength/weakness
Inverse Correlation (Move Opposite):
🔵 DXY (US Dollar Index) - $103-106 Range
Correlation: -0.65 | Stronger dollar = Risk-off mood
Key Point: If DXY spikes, expect NAS100 pullback extension
Monitor Fed rate expectations
🔵 TLT (20+ Year Treasury ETF) - $75-80 Range
Correlation: -0.58 | Rising yields hurt growth stocks
Key Point: Check 10Y yield trend for rate pressure
Watch Fed policy announcements
Key Monitoring Points:
📌 Earnings Season Impact: Tech earnings can create ±2% moves
📌 Fed Minutes/Announcements: Watch for rate guidance changes
📌 Market Breadth: Compare Advance/Decline lines for confirmation
📌 Volatility Index (VIX): Levels above 20 = Caution; Below 15 = Risk-on
📋 BEFORE YOU TRADE - CHECKLIST ✅
Is price currently at/near Layer 1 entry (24,500)?
Does current 4H chart show TMA pullback + Super Trend confluence?
Is volume confirming the setup?
Have you set your SL below 24,300?
Do you understand you're risking X to make Y?
Is this aligned with your trading plan?
🎓 FINAL NOTES
This is a mechanical swing trade setup designed for traders who use limit orders and layering technique. The confluence of Super Trend ATR + TMA creates higher probability entries during bullish pullbacks.
Remember: Trading involves substantial risk of loss. This idea is shared for educational analysis. Your trading decisions are YOUR responsibility alone.
Happy Trading! 🚀💎
