#Tata PowerDate: 12-02-2026
#TATAPower
Pivot: ₹361.88
Support: ₹349.99
Resistance: ₹373.86
Upside Levels:
L1 ₹388.12 | L2 ₹402.38 | L3 ₹417.56 | L4 ₹432.75
Downside Levels:
L1 ₹335.68 | L2 ₹321.38 | L3 ₹306.19 | L4 ₹291.00
#TATAPower #TradingView #TATA
Nse

KALYANKJIL SHORT SQUEEZ LONG SETUP FOR INTRADAYMore than 2.5RR Trade Idea.🚨 KALYANJIL primed for SHORT SQUEEZE breakout!
📊 Setup:
- Heavy volume support held lows
- Short squeeze building (volume spike)
- Bias: BULLISH above ₹425
🎯 Plan (2.5+ RR):
- Entry: Buy Stop ₹425
- SL: ₹415 (tight risk)
- TP: ₹450 (₹35 reward vs ₹10 risk)
INTRADAY ONLY hold | #KALYANJIL #NSE #ShortSqueeze #IndiaStocks

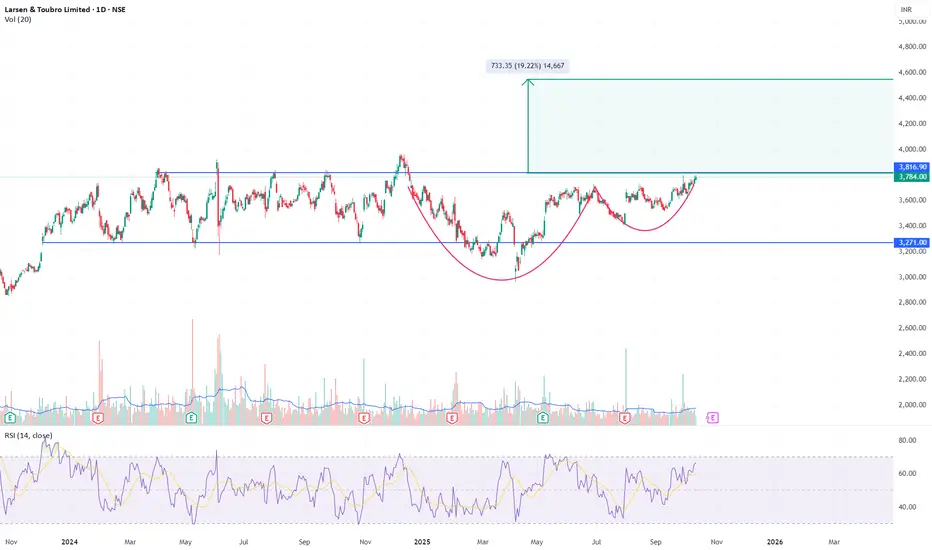
L&T - Cup and Handle Formation Near Breakout ZoneChart Structure:
Larsen & Toubro is forming a textbook Cup and Handle pattern that’s now testing its neckline around ₹3,780–₹3,800. The base extends nearly 10 months, creating a strong accumulation structure with a shallow handle - ideal for a breakout continuation.
Technical Highlights:
Cup Base: ₹2,950–₹3,000
Neckline: ₹3,780–₹3,800 (currently being tested)
Handle: Tight consolidation with declining volume, now showing early expansion
RSI: Rising towards 70, confirming strengthening momentum
Volume: Reaccumulation behavior - lighter on corrections, heavier on upswings
Trade Setup:
Breakout Confirmation: Close above ₹3,820 with strong volume
Target: ₹4,500–₹4,550 (≈19% upside from breakout)
Stop-Loss: ₹3,600 (below handle low)
Technical Verdict:
A sustained move above ₹3,820 would mark a major bullish continuation, potentially initiating a new leg in L&T’s long-term uptrend. Pattern reliability is high given the depth, duration, and structure of the base.
Disclaimer:
This analysis is for educational and informational purposes only and does not constitute investment advice or a recommendation to buy or sell any security. Markets involve risk, and past performance does not guarantee future results. Conduct your own due diligence or consult a qualified financial advisor before making investment decisions.
GMR Power — Extended Wave-3, Contracting Wave-4… Resolution📉 GMR Power & Urban Infra — Weekly Context and Daily Wave-4 / Wave-5 Structure (Elliott Study)
This publication presents an educational Elliott Wave structure study 📚 using the Weekly timeframe for the overall market context and the Daily timeframe to analyse the ongoing Wave-4 correction , its probable termination area, and the conditional Wave-5 projection .
On the Weekly chart , GMR Power shows a clear impulsive advance from the 2023 base into the ₹169.25 region , labelled as Wave-(3) . Fibonacci extension analysis shows that this move exceeded the 3.618 extension and approached the 4.0 level , confirming that Wave-3 is the extended wave . After this peak, price behaviour shifted from strong trending action to overlapping and corrective movement , signalling the development of Wave-(4) .
On the Daily chart , Wave-(4) is unfolding as a contracting triangle (A–B–C–D–E) 🔺. Each leg is corrective and overlapping, volatility has contracted, and momentum has faded. This behaviour is typical of a Wave-4 triangle following an extended Wave-3 , where the market corrects more through time than price ⏳.
From a structural and Fibonacci perspective 📐, the Wave-E termination zone is identified between approximately ₹85–95 . This region aligns with the 0.618–0.786 retracement band of the prior advance. In Elliott Wave studies, Wave-E of a triangle often resolves quietly and may not show a dramatic breakdown, which matches the current behaviour.
Because Wave-3 is extended , Elliott alternation principles suggest that Wave-5 is more likely to be contracted rather than extended . Therefore, Wave-5 expectations are best framed using triangle thrust measurement and reduced Fibonacci relationships to Wave-1 , rather than equality or extension relative to Wave-3.
Using these methods, the primary Wave-5 reference zone lies in the ₹120–140 region . A move toward the ₹160–170 area would be considered a lower-probability stretch scenario and would require clear impulsive behaviour and momentum expansion. A truncated Wave-5 remains possible but is not the base expectation.
This study focuses on structure, probability, and wave behaviour 🧠 rather than prediction. Discussion of Wave-5 becomes relevant only after the triangle completes and price clearly transitions from corrective overlap to impulsive movement .
This publication is shared strictly for educational and analytical discussion 📚⚠️ and does not constitute investment advice.

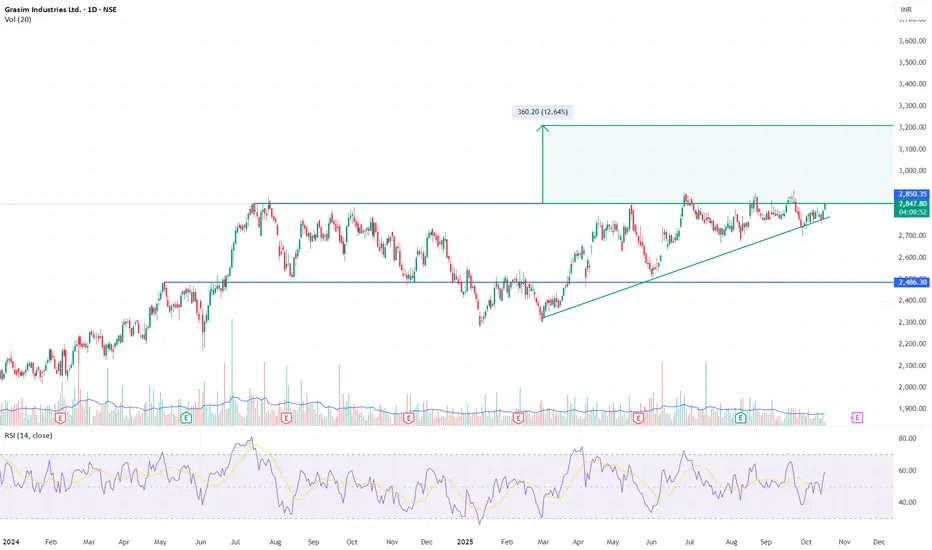
GRASIM – Base Pressure Building for Breakout Above ₹2,850Price has spent almost a year trapped between ₹2,480 and ₹2,850. Each dip since mid-2025 has formed higher lows, compressing against the same horizontal ceiling. Today’s candle closes right at ₹2,850 with RSI rising toward 60 — the structure is tightening for resolution.
A decisive close above ₹2,900 with strong volume will confirm breakout and open the path toward ₹3,200–₹3,250 (~12–13% measured move).
Setup: Ascending Triangle re-attempt
Entry Trigger: ₹2,900+ close with volume confirmation
Target Zone: ₹3,200–₹3,250
Support: ₹2,700
Invalidation: ₹2,680
Price has respected this structure for nearly a year; compression is mature, volatility contraction visible, and the next move should define direction.
Disclaimer: Not a recommendation. For educational purposes only.
Another Multibagger
Natcopharma is almost 50% down from it's recent high and made a base at around 800 price. The stock forms a double bottom chart pattern and clearly gives a breakout at around 850 price.
Now is the right time to buy this stock, it has all the fundamental and technical reasons to become a multibagger from here.
With a marketcap of 16,272 cr Natcopharma is going to the moon.

Multibagger
Belrise has been double since it's listing, I started accumulating belrise from 110 and now it's 180 and I am adding more shares of it.
Belrise clearly had all the things that I want to look for a long term investment, with a market cap of 15964 cr this stock isngoing to the moon.

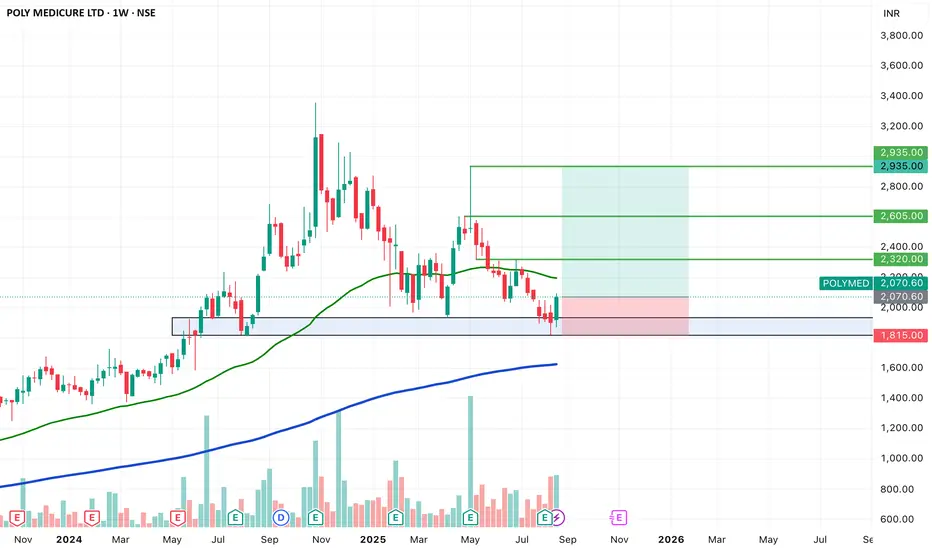
SWING IDEA - POLY MEDICUREPoly Medicure , a leading Indian medical devices manufacturer with a strong global footprint, is currently offering a favorable swing trading setup backed by strong technical confluence.
Reasons are listed below :
1,950 zone acting as a strong support base
Bullish engulfing candle on the weekly timeframe, signaling reversal strength
Marubozu candle on the daily chart, supported by strong volumes
Golden Fibonacci retracement zone providing support in the larger trend
Price comfortably above the 200 EMA, showing long-term trend strength
Target - 2320 // 2605 // 2935
Stoploss - weekly close below 1815
DISCLAIMER -
Decisions to buy, sell, hold or trade in securities, commodities and other investments involve risk and are best made based on the advice of qualified financial professionals. Any trading in securities or other investments involves a risk of substantial losses. The practice of "Day Trading" involves particularly high risks and can cause you to lose substantial sums of money. Before undertaking any trading program, you should consult a qualified financial professional. Please consider carefully whether such trading is suitable for you in light of your financial condition and ability to bear financial risks. Under no circumstances shall we be liable for any loss or damage you or anyone else incurs as a result of any trading or investment activity that you or anyone else engages in based on any information or material you receive through TradingView or our services.
@visionary.growth.insights
$NSE:NIFTY Make or Break Area ! Optimism Level For Me.NSE:NIFTY
Your focus on 25,788 on the weekly candle is a "Make or Break" zone for several reasons:
The 50-Day EMA Connection: The 50-day Exponential Moving Average (EMA) is currently positioned near 25,763. A weekly close below your level (25,788) would mean the index has decisively broken this crucial medium-term support.
Bullish Case (Stay Above 25,788): If the weekly candle closes above this mark, it confirms a "buy on dips" structure. It suggests that despite global headwinds, domestic liquidity is strong enough to keep the uptrend intact. The next targets would be a retest of 26,200 and potentially 26,500.
Bearish Case (Close Below 25,788): A weekly closing below this level would likely trigger a shift in market psychology. Technical analysts would view this as a Lower High, Lower Low pattern on the daily/weekly charts, potentially opening the doors for a correction toward 25,500 or even the psychological 25,000 mark.
🏗️ What’s Driving the Index?
Sectoral Support: PSU Banks and Metal stocks are currently providing a buffer, while IT and Private Banks are seeing some profit booking.
Macro Factors: The Indian Rupee recently crossed the 91 per Dollar mark, which is putting pressure on FII (Foreign Institutional Investor) sentiment, leading to the current "tug-of-war" at the 25,800 level.

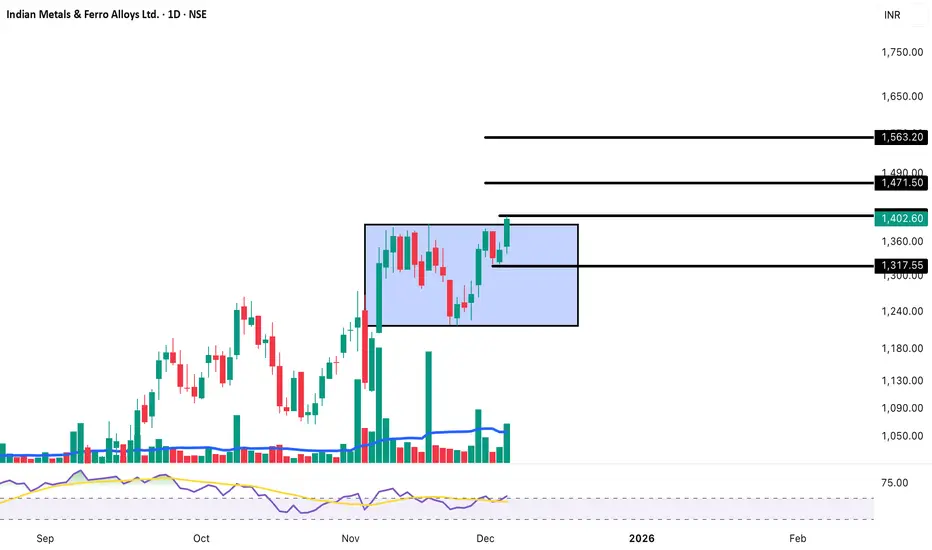
Indian Metals: +4% Surge Breaking Rectangle | Target 1,563-1,700Entry: ₹1,402-1,415 (Current Level)
Target 1: ₹1,471-1,490
Target 2: ₹1,563-1,580
Target 3: ₹1,650-1,700+ (Extended Breakout Target)
Stop Loss: ₹1,317
Disclaimer: For educational purposes only. Not SEBI registered.
IIFLIIFL FINANCE LTD has breakout hand and shoulder pattern TGT up to ATH resistance level, and this is just for educational purpose not any buy and sell recommendation

MAHINDRA & MAHINDRA FINM&M FINANCIAL SERVICES LTD has breakout 7 years long resistance so TGT are mation in chart, and this is just for educational purpose not any buy and sell recommendation

Nifty50 4hr Chart Analysis-Nov 30, 2025Nifty50 4hr Chart Analysis-Nov 30, 2025
Case1:
*Expecting 4hr to drop to Daily Support Level (iFVG-D), which almost 50% of current range.
Case2:
*If nifty goes for a deeper retracement then expecting 0.79 which is also a 4hour Support level (+OB-4hr)

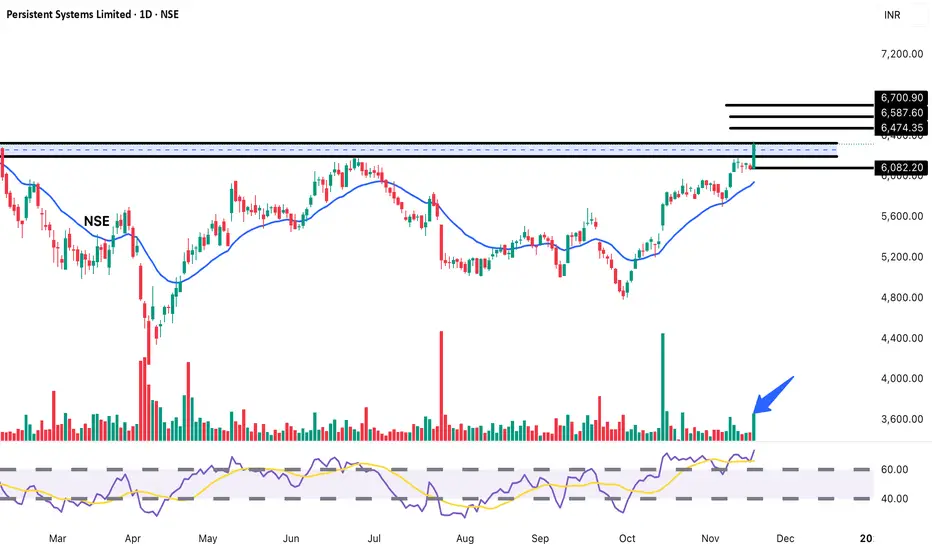
Persistent Systems: Explosive Breakout | Digital Transformation STRONG BUY Setup 💻
Entry: ₹6,316-6,340 (Current Level)
Target 1: ₹6,474-6,500
Target 2: ₹6,587-6,620
Target 3: ₹6,700-6,750
Target 4: ₹6,900-7,000+ (Extended Breakout Target)
Stop Loss: ₹6,082
Technical Rationale:
MASSIVE BREAKOUT from year-long resistance at 6,250 (horizontal black line at top)
Explosive +3.89% surge with exceptional volume spike (874.8K - highlighted with blue arrow)
Breaking above major resistance zone decisively on daily chart
Trading above long-term horizontal resistance after multiple tests throughout 2025
Volume is highest in months - institutional buying evident
Strong uptrend intact - trading above rising EMA (blue curve)
RSI around 65-70 - strong bullish momentum with room for upside
IT Services sector showing strength - digital transformation demand
Multiple resistance levels mapped: 6,474, 6,587, 6,700
Clear support established at breakout zone 6,250 and 6,082
Previous all-time high territory being challenged
Pattern shows consistent higher lows since October bottom
Risk-Reward: Excellent 1:2.5 to 1:4+ ratio depending on targets
Pattern: HORIZONTAL RESISTANCE BREAKOUT on DAILY Chart - breaking year-long ceiling with exceptional volume
Strategy: Medium-term swing to positional (weeks to months)
Book 20% at T1 (6,490), 20% at T2 (6,600), 20% at T3 (6,725)
Hold remaining 40% for extended target 6,900-7,000+
Trail SL to 6,320 after crossing T1
Disclaimer: For educational purposes only. Not SEBI registered.
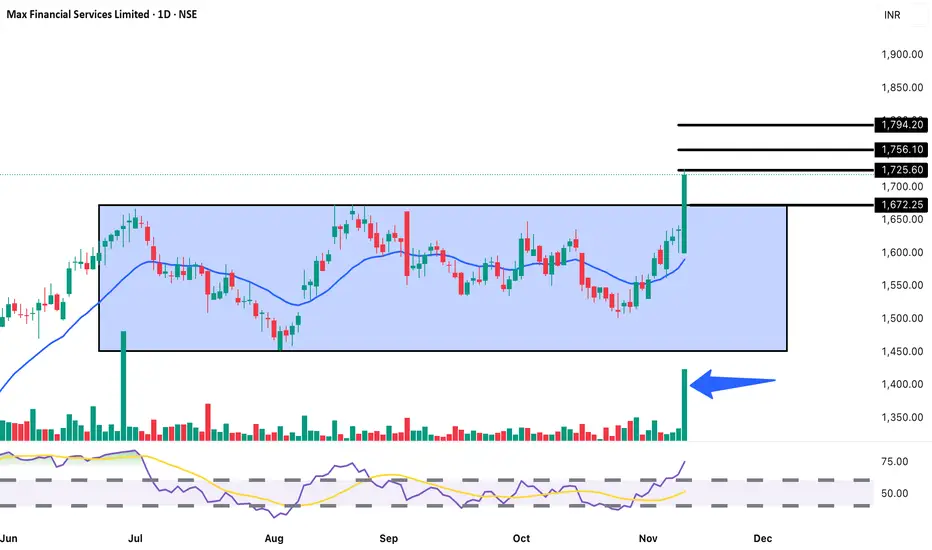
MAXFINSERV: Massive Breakout After 6 Months | Target 1,900+STRONG BUY Setup 💰
Entry: ₹1,718-1,730 (Current Level)
Target 1: ₹1,756-1,770
Target 2: ₹1,794-1,810
Target 3: ₹1,850-1,880+ (Extended)
Stop Loss: ₹1,672
Technical Rationale:
EXPLOSIVE BREAKOUT from 6-month rectangle consolidation (1,450-1,680 range - blue shaded)
Massive +5.09% surge with exceptional volume spike (4.18M - highlighted with blue arrow)
Breaking above long-term resistance at 1,672-1,680 convincingly
Trading well above rising EMA - strong bullish trend
RSI spiking above 75 - very strong momentum (but watch for overbought)
Volume is highest since July - institutional buying evident
Financial services/insurance sector showing strength
Price action similar to July breakout (noted with green volume bars)
Multiple resistance levels mapped: 1,725, 1,756, 1,794
Clear support established at breakout zone 1,672-1,680
Rectangle breakout pattern - measured move suggests 1,900+ target
Risk-Reward: Excellent 1:4+ ratio for extended targets
Pattern: Rectangle Consolidation Breakout on Daily Chart - highly reliable bullish pattern after 6 months of base building
Strategy: Medium-term swing to positional (weeks to months)
Book 25% at T1 (1,765), 25% at T2 (1,800), trail remaining 50% with SL at 1,730 after T1
Strong momentum could lead to gap-up continuation
Key Levels:
Breakout Zone: 1,672-1,680 (now critical support)
Strong Resistance: 1,725, 1,756, 1,794
Major Support: 1,672, 1,650
Timeframe: Daily chart - suitable for swing/positional traders
Volume Analysis: 4.18M volume - exceptional and highest since July breakout attempt. This confirms strong institutional accumulation
Sector: Financial Services/Life Insurance - Max Life Insurance parent company, benefits from insurance growth story
Measured Move: Rectangle height (~230 points) added to breakout = Target of 1,900-1,910
Historical Context: Similar volume breakout in July led to rally but failed. This time breaking with even stronger momentum and cleaner base.
Disclaimer: For educational purposes only. Not SEBI registered.
SBI Life Insurance: Breaking 420-Day Consolidation BUY Setup 🛡️
Entry: ₹1,936-1,945 (Current Level)
Target 1: ₹1,984-1,990
Target 2: ₹2,019-2,030
Target 3: ₹2,056-2,075 (Extended)
Stop Loss: ₹1,910
Technical Rationale:
MAJOR BREAKOUT after 420 days of consolidation (highlighted in cyan)
Breaking above long-term resistance at 1,930 level with strong momentum
Weekly chart showing powerful +5.27% surge
Volume buildup visible (highlighted) - institutional accumulation
Price breaking above descending trendline from 2024 highs
Trading above both EMAs indicating strong bullish trend
Rounding bottom formation on weekly - classic bullish reversal
High volume (5.03M) confirming breakout authenticity
RSI trending upward with room for further upside
Insurance sector showing relative strength
Clear support base at 1,876-1,910 zone
Risk-Reward: Excellent 1:4+ ratio
Pattern: Multi-month base breakout + Rounding bottom - extremely reliable bullish setup on weekly timeframe
Strategy: Positional/long-term - Book 25% at T1 (1,990), 25% at T2 (2,025), trail remaining 50% with SL at 1,950 after T1 achieved
Key Levels:
Breakout Zone: 1,930-1,945 (critical resistance broken)
Strong Resistance: 1,984, 2,019, 2,056
Major Support: 1,910, 1,876
Major Catalyst:
420-day consolidation breakout = huge pent-up energy
Volume accumulation phase complete
Financial sector strength
Disclaimer: For educational purposes only. Not SEBI registered. 420-day base breakout is significant - these typically lead to sustained moves. Weekly chart for medium to long-term position. Manage risk appropriately and conduct thorough research before investing.

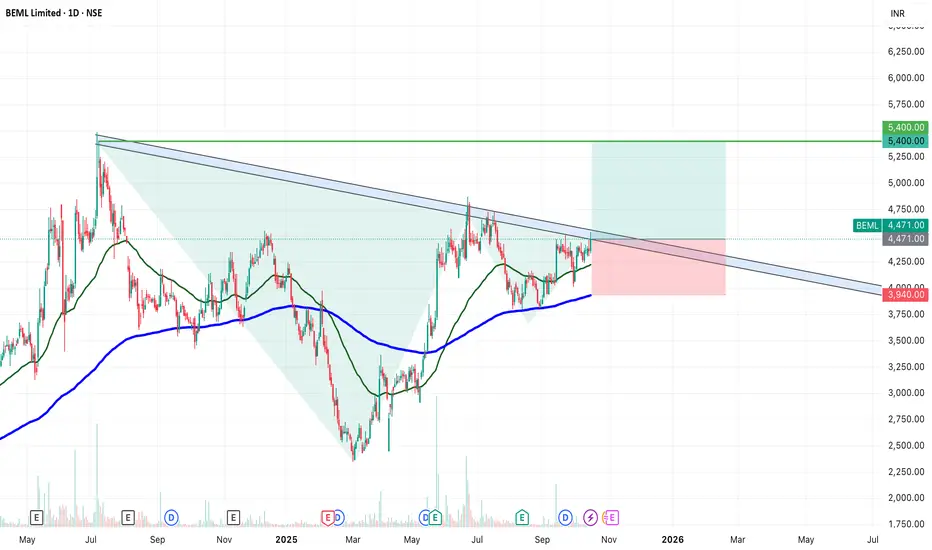
SWING IDEA - BEMLBEML Ltd , a key player in India’s defence and heavy equipment sector, is displaying a strong bullish breakout setup supported by multiple technical confirmations.
Reasons are listed below :
Breakout of a long-term trendline after multiple retests
Cup and Handle breakout, signaling continuation strength
VCP (Volatility Contraction Pattern) breakout indicating accumulation
Bullish engulfing candle on the daily timeframe confirming momentum
Higher highs and higher lows structure intact
Trading above 50 & 200 EMA, reinforcing trend strength
Target - 5400
Stoploss - daily close below 3940
DISCLAIMER -
Decisions to buy, sell, hold or trade in securities, commodities and other investments involve risk and are best made based on the advice of qualified financial professionals. Any trading in securities or other investments involves a risk of substantial losses. The practice of "Day Trading" involves particularly high risks and can cause you to lose substantial sums of money. Before undertaking any trading program, you should consult a qualified financial professional. Please consider carefully whether such trading is suitable for you in light of your financial condition and ability to bear financial risks. Under no circumstances shall we be liable for any loss or damage you or anyone else incurs as a result of any trading or investment activity that you or anyone else engages in based on any information or material you receive through TradingView or our services.
@visionary.growth.insights
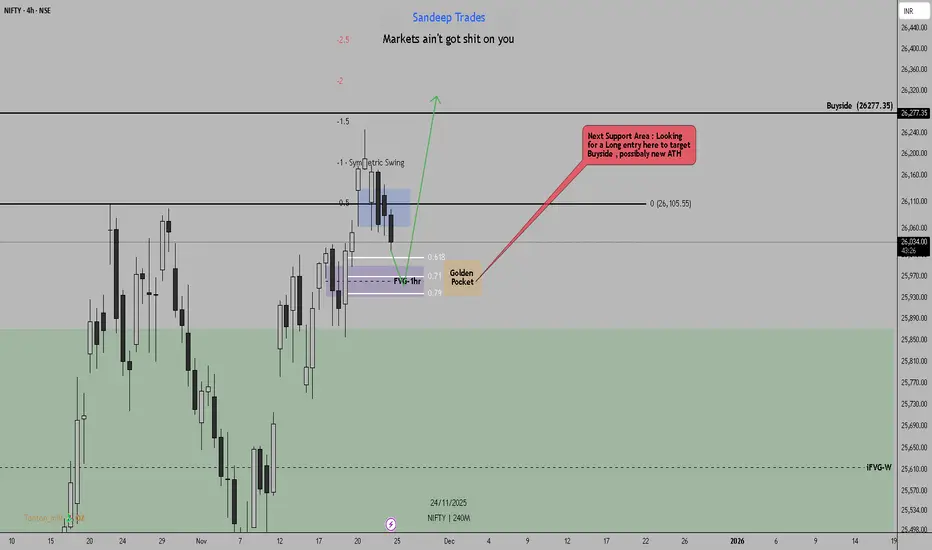
Nifty50 4Hour Chart Analysis: Setup Longs Nifty50 4Hour Chart Analysis: Setup Longs
*4hr iFVG(Purple rectangle) which is also Golden Pocket area on Fib retracements.
*Will be looking for a long setup there to target Buyside(previous ATH)
Eicher Motors – Breakout Trade SetupPrice has broken out of a 2-month consolidation range (₹6,880–₹7,200) with strong volume.
This indicates momentum continuation toward upper resistance levels.
✅ Buy Above: ₹7,200 (Breakout confirmation zone)
🎯 Targets (Swing / Short-Term):
T1 – ₹7,227
T2 – ₹7,336
T2 – ₹7,468
🛡️ Stop-Loss: ₹6,880 (below range support + 20EMA area)
⏳ Duration:
5–10 trading sessions (short-term swing trade)
📈 Reasoning (Professional View):
Breakout from a long consolidation box
Strong bullish candle + volume expansion
RSI breakout above 60 shows momentum shift
Above 20EMA after a sharp reversal
education purpose only

How I frame my Bias on Stocks? Part 1. Showing multiple examples of stock delivery and how you can do the same on a 5min timeframe

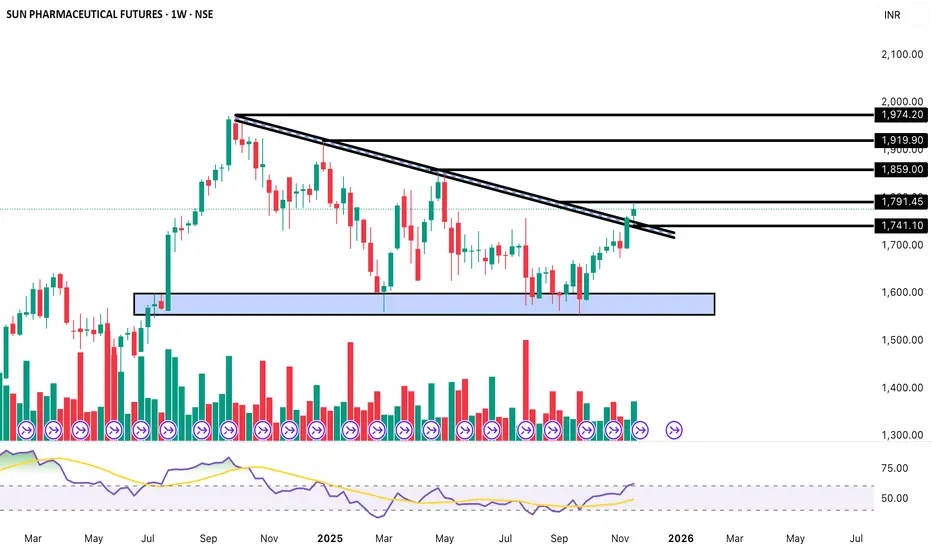
Major Trendline Breakout on Weekly | Multi-Month Rally Setup📌 Buy Zone (Weekly Breakout Confirmation):
₹1,780 – ₹1,795
🎯 Targets (Positional):
T1 – ₹1,859
T2 – ₹1,919
T3 – ₹1,974
🛡️ Stop-Loss (Weekly):
₹1,740 (below retest + trendline confluence)
⏳ Duration:
4–8 weeks (Positional swing)
Based on our fundamental analysis of Monolithisch India Ltd.Recommendation: NEUTRAL / HOLD
Rationale:
The company's fundamentals are strong—demonstrating phenomenal growth, high profitability, and a lean balance sheet. However, the current stock price has already discounted a significant amount of this future growth. The valuation is very rich (P/E of ≈71.9x), which leaves little room for error or unexpected slowdowns.
For an existing investor, holding the stock is reasonable to capture the expected growth. For a new investor, we recommend a Neutral stance, suggesting it is best to wait for a better entry point (a pullback in price) that offers a more favorable risk-to-reward balance.
Price Target and Duration
Since the market is currently rewarding the exceptional growth with a high multiple, we anchor our near-term target to a slight premium on the current valuation based on sustained financial performance.
Target Price: ₹550
Target Duration: 12-15 Months (This is a long-term view that factors in the execution of the company's current expansion plans).

Hero Motocorp: Major Weekly Breakout | Auto Sector Leader
STRONG BUY Setup 🏍️
Entry: ₹5,798-5,820 (Current Level)
Target 1: ₹5,899-5,920
Target 2: ₹6,033-6,060
Target 3: ₹6,251-6,280
Target 4: ₹6,400-6,500+ (Extended Breakout Target)
Stop Loss: ₹5,588
Technical Rationale:
BREAKING OUT from year-long rectangle consolidation (5,588-5,899 range - blue shaded area)
Powerful +4.69% weekly surge showing strong bullish momentum
Testing upper boundary of rectangle at 5,899 (marked "3d 21h" - breakout imminent)
Weekly chart showing major pattern completion
Trading above descending channel (black trendlines) - channel broken
Volume at 1.77M - strong for weekly timeframe confirming breakout
RSI trending upward around 70-75 - strong momentum (overbought but in uptrend)
Trading well above rising EMA - bullish trend confirmed
Auto sector leader - largest two-wheeler manufacturer globally
Multiple resistance levels clearly marked: 5,899, 6,033, 6,251
Strong support established at 5,588 (rectangle base)
Previous consolidation for 12+ months = powerful breakout potential
Pattern similar to 2024 rally from 3,500 to 6,000+
Risk-Reward: Excellent 1:3 to 1:5+ ratio depending on targets
Pattern: RECTANGLE CONSOLIDATION BREAKOUT on WEEKLY Chart - extremely powerful continuation pattern after year-long base building
Strategy: Medium to long-term positional (weeks to months)
Book 20% at T1 (5,910), 20% at T2 (6,045), 20% at T3 (6,260)
Hold remaining 40% for extended target 6,400-6,500+
Trail SL to 5,820 after crossing T1
Disclaimer: For educational purposes only. Not SEBI registered.
