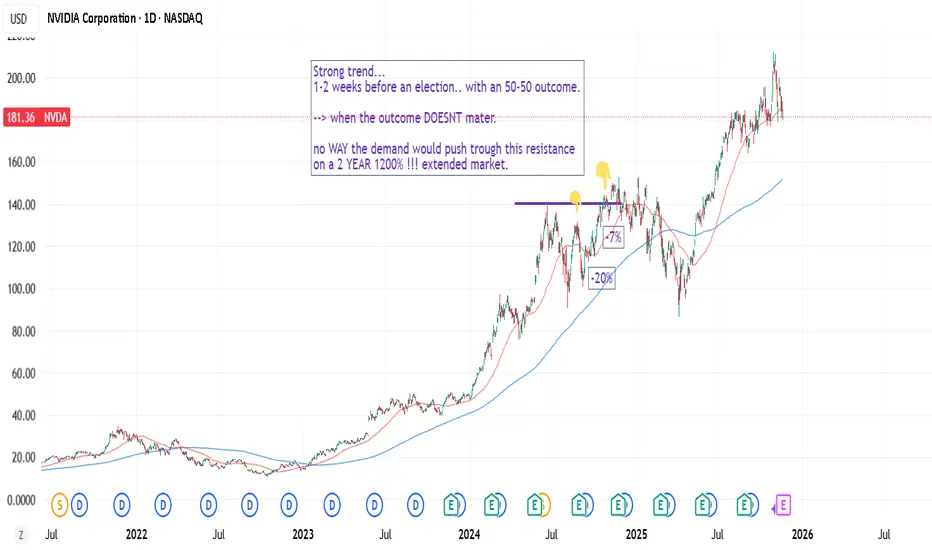
Markets are predictable. Trading S/D imbalances.Pre-election. 1200% extension after a 2-year rally. Facing ATH with strong trend and expectations.
This is a rule or factorial based approach. What most people think - is usually how most people are positioned, or usually also is the logical truth.
When something extends... and some risks emerge -- you can't really trust charts (ie demand strength). that's a prejudgement? ie sloppy way to look at things.
Also somewhat predictable is the 2 year rally, 3rd year weakness. If markets stall -- markets sells off on expectations of that "rule" lol
NVDA
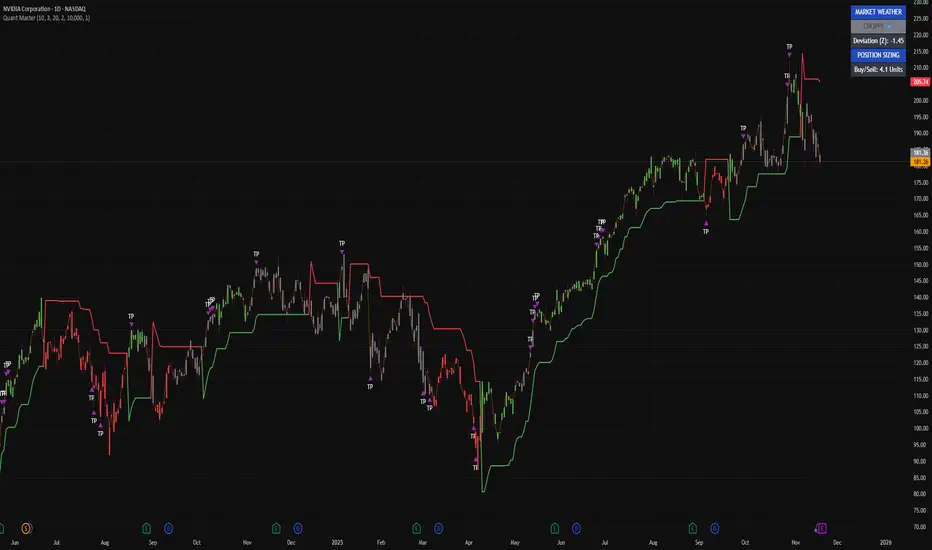
I’m reading NVIDIA through pure structureThis is NVDA on the 1-day with my Quant Master Trend System, and right now the message is simple: we’ve transitioned from impulse to instability.
The ribbon is still red from the recent flip, and every candle since that flip has respected the stop level. That’s the part most people miss — when the ribbon turns red while Market Weather is CHOPPY, it means the trend engine isn’t aligned. There’s pressure, but not clean momentum.
That’s exactly what you’re seeing here.
NVDA topped, printed a string of TP clusters during distribution, and then lost its green momentum base. Once that base broke, it instantly acted as resistance — a classic behavior in this model. The current deviation reading at Z ≈ -1.45 confirms price is stretched, but not in capitulation. This is structural unwind, not panic selling.
Look back at the last time NVDA printed this signature:
Green ribbon → long rally → heavy TP clustering → red flip → CHOPPY weather → multi-week digestion phase.
The system is showing the same rhythm right now.
So here’s how I see it:
The uptrend is no longer intact.
Momentum has shifted from expansion to dispersion.
Market Weather says don’t trust breakouts, don’t trust dips.
The clean trend is gone — this is recalibration.
And until NVDA builds a fresh green momentum base and holds above it, I’m treating every bounce inside red conditions as a continuation of the unwind.
NVDA Earnings Breakout Setup — QuantSignals V3 | Bullish CallNVDA QuantSignals V3 Earnings 2025-11-18
Instrument: NVDA
Date: 2025-11-18
Signal Type: Earnings (Pre-Earnings Position)
Model: QuantSignals V3
Direction: Calls
Confidence: 65%
Conviction: Medium
Earnings Date: 2025-11-19
Earnings Estimate: $1.27
Expiry: 2025-11-21
Options Setup
Strike Focus: $185.00
Entry Range: $6.45 – $6.55
Implied Move: $14.15 (7.7%)
Profit Target: $13.00
Stop Loss: $3.25
IV: 106.5% (elevated due to earnings)
PCR (Flow Intel): 0.37 (bullish)
24h Move: –1.91%
Price & Technicals
Current Price: $183.79
Katy Prediction Target: $184.60 (+0.44%)
Trend Classification: Neutral (50% confidence)
RSI: 31.3 (near oversold)
MACD: +2.17
Momentum (ROC): –7.42%
Support: $179.65
Resistance: $187.55
AI Forecast (Katy Model)
• Time-series predicts steady upward movement
• Range projection: $183.79 → $184.80 (+0.55%)
• Confidence moderate, trajectory shows bullish bias despite neutral label
Fundamental & News Notes
• Strong historical earnings performance (100% beat rate)
• Mixed news sentiment but leaning optimistic
• Nvidia positioned as key market driver for earnings week
• Pre-earnings selling pressure suggests potential reversal
Risk Notes
• Moderate risk due to high implied volatility
• Earnings event introduces binary outcome
• Premiums elevated; smaller sizing recommended
• Monitoring pre-market on 11/19 essential
NVDA: 1 week before earnings effect. Supply-demand imbalance.Parretto principle (20-80): small important things can have great influence in grand scheme of things. Some events have greater weight, than say 80-90% of daily events.
Stocks move based on Supply-demand dynamics (disbalance etc), patterns or trends are just a feedback.
The problem with using charts as a feedback for strength (or feedback for S-D strength) is that: (1) on a expensive market, with extended prices (with high supply too), (2) during important NVDA earnings, it's almost predictable how markets would sink, or at least be volatile.
Demand stalls. Supply gets worried. Price down.
//People are risk averse. Hence.. predictable.

NVDA HAGIA SOPHIA!The Hagia Sophia pattern has now fully formed; it just needs the crack! and the Hook!
No matter what your vague hunches and feelings are about AI, the charts will always win.
You can't "buy the dip" unless you know when to "Sell the Rip"!
If you can't see this resistance area, I don't know what to tell you.
Everyone is bullish at the top of a bubbliotious market without exception!
Click boost, Like, Subscribe! Let's get to 5,000 followers. ))
NVDA Earnings Setup – Massive Opportunity AheadNVIDIA NASDAQ:NVDA has surged +48% since our last analysis, continuing to lead the AI rally with exceptional momentum. Now, all eyes are on earnings—and the setup is massive. The options market is pricing in a ±7.5% implied move, which could mean a $345B shift in market cap. That’s one of the biggest potential earnings moves in history.
🔥 Key Catalysts:
Strong institutional buying
AI/data center demand in focus
Sky-high expectations priced in
💡 Trade Setup:
Entry: $180–$182
Take Profit Targets: $200 / $210
Stop Loss: $174
This is a high-volatility event. Manage risk accordingly and size positions carefully.

BTC: Careful out there.Bitcoin has lost it's momentum, also evident in GOLD/BTCUSD graph (meaning, gold has stole the show from btc). Lower Lows in this graph would mean bear market or a deeper correction Imo.
Other bad sign is SOXX/SPX lower highs, underperforming. Could be a sign for market top but lets see.

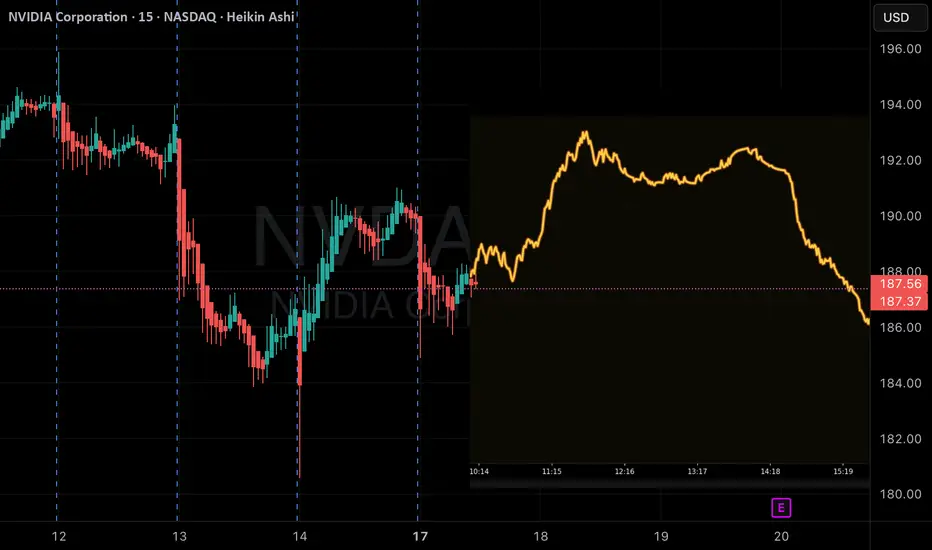
Nvidia (NVDA) Price Action Statistics Around EarningsWith Nvidia set to release earnings after the US close on Wednesday, I take a look at recent price action around past reports, the Nvidia chart and the Nasdaq.
Matt Simpson, Market Analyst at City Index.

NVDA QuantSignals V3 — Katy Flags Subtle Reversal MoveNVDA (QuantSignals V3)
Market Structure:
NVDA is showing neutral-to-weak momentum with price hovering near short-term resistance at $189–190. Buyers are losing strength, and the tape shows lower high formations, signaling potential exhaustion.
Trend Outlook:
The Katy 1M model flags soft downside pressure. Despite the neutral trend reading, intraday structure leans toward a controlled pullback, supported by moderate volatility (16.5%).
Order Flow Insight:
Momentum flow appears to be slowing, with reduced upward volume. The micro-trend suggests fade-the-rip behavior—small rallies may get sold into.
Key Levels:
Resistance: $189.40 / $191.70
Support: $188.00 / $186.80
Short Trigger Zone: $188.50–$189.00
Vision Summary:
NVDA shows lower momentum, weak buyer conviction, and a short-biased micro-shift. Best setup aligns with a tight short scalp targeting the next liquidity pocket below $188.00.
17/11/25 Weekly OutlookLast weeks high: $107,526.18
Last weeks low: $93,034.53
Midpoint: $100,280.35
Bitcoins downtrend continues as price reaches a 6-month low of $93,000. This price action came as a result of a failed attempt to flip the $107,000-$108,000 level, as this area rejected the bears gained momentum sending BTC sub $100k big even level and the most worrying part of all for the bulls losing the $97,000-$98,000 level. On the Higher timeframes this new lower low sets up for a trend shift. Should any reaction from the bulls fail to flip the weekly high and rollover, I would then have confirmation of a bearish trend and trade accordingly.
Despite the US Government shut down coming to an end, it appears this has not been enough to get the market in a risk-on mood, at least not yet. This compounded with Nvidia earnings in midweek and the larger question mark about the AI industry as a whole has meant buyers are just not will to step in yet. My opinion is that IF Bitcoin trades into the $89,000-$92,000 area that is where support may be found, that's because we have an area of imbalance that broke the previous downtrend in April earlier this year during the tariff war.
This week I expect Wednesday 19th November to be a day of volatility, and some formation of a local bottom in Bitcoin, at least in the short term.
Good luck this week everybody!

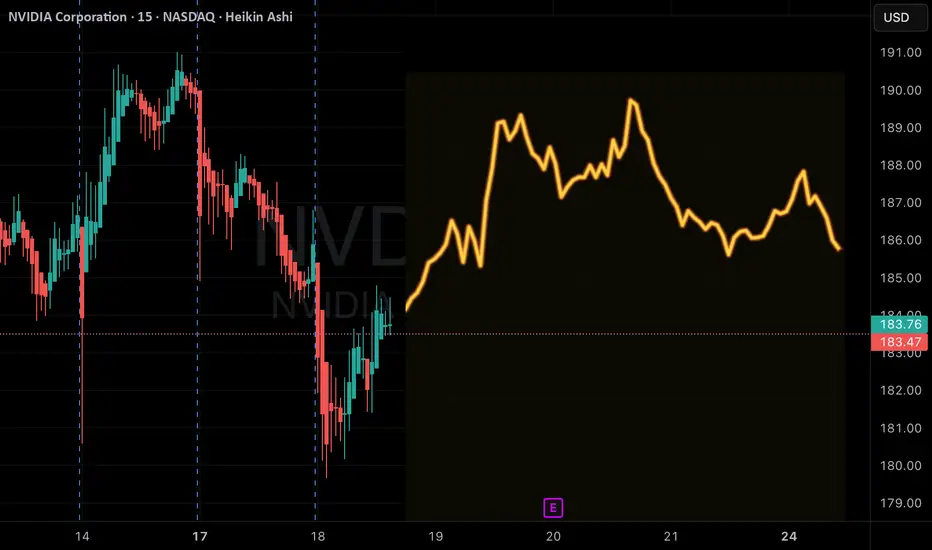
NVDA earnings thsi week - will that be catalyst for a move?Its been another few months of great bullish moves on NVDA, however the last couple of weeks have been choppy. We rejected the $200 level and now find ourselves sat above $180 and the Weekly 20MA.
If the numbers are good then I'm sure the giddiness will take us higher. If the numbers are poor the you have to ask will $180 and the Weekly 20MA act as support, or will they collapse? If they do, what will happen to tech and US markets in general? It means that its going to be an interesting week!

Ahead of Nvidia’s (NVDA) Earnings: How the Price Could MoveAhead of Nvidia’s (NVDA) Earnings: How the Price Could Move
On Wednesday, after the close of the main US trading session, Nvidia will release its quarterly results — a report seen not merely as another batch of corporate data but as a crucial test for the entire AI-driven bull run.
NVDA shares are up more than 40% since the start of the year, and the company must now prove that this surge is justified and that the AI revolution is still accelerating. According to media reports, Wall Street analysts remain optimistic:
→ Revenue: forecast around $54.9bn, implying roughly 56% year-on-year growth.
→ Earnings per share (EPS): about $1.25 (previous quarter: $1.05).
What should investors focus on?
Of particular importance will be:
→ data on Data Centre revenue, a key indicator of whether the AI boom remains intact;
→ forward guidance, as the market is looking for reassurance that Big Tech will continue to spend heavily on AI.
Technical Analysis of the Nvidia (NVDA) Chart
Recent price action in NVDA points to a sequence that can be interpreted as bearish:
→ 28 October: a strong rally above the psychological $200 level;
→ a failure to hold above that barrier;
→ a pullback on rising volumes (Nasdaq data) with expanding candles in early November.
In the broader market context, it is notable that early November has seen NVDA underperforming major equity indices, signalling firm resistance from sellers around $200.
From a bullish perspective, the decline from the all-time high resembles a correction pattern (shown in red) within a larger uptrend.
However, there is a risk that the market’s high expectations will not be met when the earnings report is published. If that happens, NVDA could extend its decline towards the lower boundary of the rising channel, where support lies near $165.
This article represents the opinion of the Companies operating under the FXOpen brand only. It is not to be construed as an offer, solicitation, or recommendation with respect to products and services provided by the Companies operating under the FXOpen brand, nor is it to be considered financial advice.

NVDANVIDIA is still in an uptrend. Last week, the price hit a new high of $210, but the price was unable to break through this level, so it adjusted down. It is expected that the price will likely test the important support zone at $167-155. If the price cannot break through $155, the price still has a chance to rise.
However, if the price continues to rise in the near future, a correction may also occur.
Long-term trading plan: Wait for the correction to complete before buying.
** This is not financial advice.
🔥Trading futures, forex, CFDs and stocks carries a risk of loss.
Please consider carefully whether such trading is suitable for you.
>>GooD Luck 😊
❤️ Like and subscribe to never miss a new idea!

Stock Market Forecast | TSLA NVDA AAPL AMZN META MSFTStock Market Forecast | SP:SPX NASDAQ:NDX CME_MINI:ES1! CME_MINI:NQ1!
Mag 7 | TSLA NVDA AAPL AMZN META MSFT GOOGL

SPY MAJOR CORRECTION INCOMINGWhat up, fam? I'm back on my market Nostradamus grind, and I got a feeling y'all gotta hear about. Time to drop some knowledge! 🧠
Listen, rewind to February 14, 2025 🗓️. That day, my trading system was ringing the alarm bells like crazy. It gave me a super early heads-up that a major U-turn, a reversal, was about to hit the market.
Where did that heat check come from? Nvidia (NVDA) stock.
I saw it sitting high, maybe around $140, and I dropped a bomb: I said Nvidia was taking a trip down to $90. 💣
Y'all remember that? I got roasted! People called me all types of crazy names—clown, dummy, you know, the usual investor insults when you try to call the market's shot. But guess what? My system came through. The proof is in the pudding. 🧾
📉 Time for the Next Big Drop: SPY
Now, I'm dropping another prophecy, and it's for the big dog: SPY (that's the S&P 500 ETF, for those sleeping).
I'm calling for a major correction—a big ol' dip—just like the one we saw back in March and April 2025.
I'm predicting this correction is gonna take us all the way back down to the $480 level we saw in 2025. If it gets real ugly, we might even erase all the gains of 2025 and re-test those earlier 2025 lows. Don't say I didn't warn you! ⚠️
💡 The Secret Sauce: It Ain't Luck
Why am I posting this now? For two reasons:
For the Records: This post is my time stamp. I can send people back here when it happens and say, "I told you so!" 😉
To Show You This: The market is predictable. You can get early warnings and see the signs before a big move hits. 🔔
But here’s the real talk: you gotta put in the work. You can't just wish upon a star. To get to this level, you have to master:
Reading the Charts
: Being a boss at understanding the flow. 📊
Math
: Understanding the numbers game. ➕
Self-Worth
: Believing in your own study and research skill. 💪
That's all for today. Don't be mad when it happens.
See you at $485 in the SPY! Before summer 2026 target. Peace out. ✌️

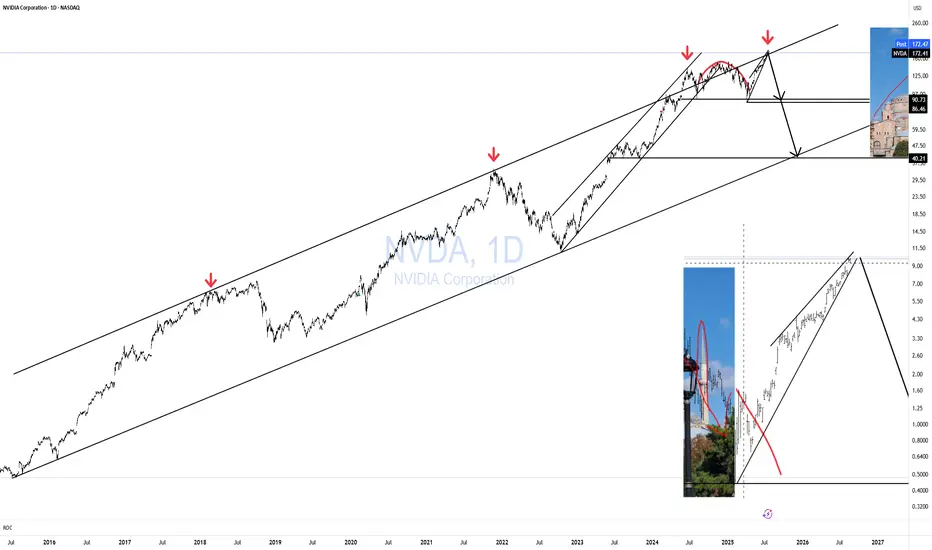
Continuation of the "AI Bubble" A chart for NVDA that illustrates the parabolic curve on this very large timeframe
To expect a curve like this to break is unlikely
AI will have huge implications
The potential of AGI aswell is huge for humanity in general. I don't see a bubble at all.
Weekly timeframe

RENDER: Slightly higherRENDER recently managed to push higher once again. Currently, within the larger turquoise wave Y—which is developing as a five-wave move in magenta—it is expected to continue its upward momentum in the near term. As a key initial step, price should break above resistance at $5.51.

S&P At The End Of The Trend?Seems like on the weekly and monthly charts, the S&P has completed a 5 wave Elliott which started in fall 2022, exactly 3 years ago. The indicators also seem getting weaker on both time frames. Probably there is a distribution going on. Everybody you see is talking about a recession in 2026, mostly towards the middle of the year and we will have a Christmas rally this year. Well, by now we have learned that if everybody is expecting something to happen, either it doesn’t happen or it happens earlier . We’ll see because nobody knows the future. Though, as I see, most people now are in the mood that every fall is a buying opportunity and “this time it’s different” with ai. So many cocky opinions flying around. Maybe this time it’s different but for now, I am thinking that we will have a 3 wave Elliott downwards. Actually, I didn’t like the sentiment that is going around. We’ll see if we will wear our shorts in winter.

NVDA Weekly Call Alert — AI Recovery + Institutional Flow🧭 Overview
Ticker: NVDA
Current Price (Entry): $187.50
Trend: Bullish (Analyst + AI recovery)
Expiry: 2025-11-21 (7D)
Strike: $187.50 (ATM, Delta 0.521)
Position Size: 4% of portfolio
📊 AI & Technical Forecast
Katy AI Target: Recovery sequence $185 → $190, timing for momentum reversal
Analyst Price Target: $250
PCR / Flow Intel: 0.33 → bullish institutional positioning
RSI: 80.9 → overbought, expect short-term dip before upward move
VIX: 19.84 → favorable volatility entry before expansion
Insights:
Friday entry captures weekend theta premium
Light weekly volume (0.6x) → monitor for institutional confirmation
Dip to $185.50 may provide optimal entry for maximum upside
🎯 Trade Setup
Parameter Value
Direction CALL
Strike $187.50
Entry $7.50
Target 1 $12.00 (+60%)
Target 2 $15.00 (+100%)
Stop Loss $4.50 (–40%)
Expiry 2025-11-21
Position Size 4% portfolio
Confidence 60%
⚡ Key Advantages
ATM call → balanced risk/reward vs OTM alternatives
Tight stop aligns with AI critical support at $184.44
Institutional bullish flow + AI recovery pattern → asymmetric reward potential
Timing advantage: Monday-Tuesday momentum reversal
🚨 Risk Notes
Low AI confidence (50%) → disciplined sizing required
Overbought RSI → short-term upside may be capped
Rising VIX → daily premium decay risk, consider scaling entry
Avoid holding past Wednesday if Target 1 isn’t reached
Summary
NVDA presents a medium-conviction weekly call leveraging AI recovery trajectory, institutional flow, and analyst support. Ideal for disciplined traders seeking timed momentum entry into a 7-day horizon.
It looks so gloomyWhat I’m Watching:
Reaction to the trendline on the next retest
Whether volume confirms a true bounce or a breakdown
Price behavior as it re-approaches the highlighted green zone, which has repeatedly acted as both support and resistance

Elliott Waves Don’t Lie: NVDA’s Path to $26,000Summary: “Elliott Waves, Fibonacci, and Smart Money align perfectly — NVIDIA’s long-term chart points to an AI-powered Supercycle with massive upside." 💎📊
🚀 NVDA | The Supercycle of the AI Era! 💚
🌀 Elliott Wave Supercycle Breakdown
NVIDIA’s price action over the past two decades is a textbook example of a multi-decade Elliott Wave Supercycle — where technical , fundamentals , and Smart Money flows perfectly align to form a once-in-a-generation structure 🌎
Let’s break it down step-by-step 👇
Super Cycle Wave (1) — launched in the early 2000s, marking NVDA’s first growth phase during the birth of consumer GPUs 🎮.
Super Cycle Wave (2) — deep correction into 2002, retracing a 0.786 Fibonacci, cleansing early euphoria and creating the foundation for institutional accumulation 💼.
Then began the Super Cycle Wave (3) — the most powerful phase of all. Within it, we have distinct macro sub-waves:
1️⃣ Macro Wave (1) — ended in 2007 , aligning with the first institutional wave of adoption.
2️⃣ Macro Wave (2) — retraced 0.618 in 2008 , coinciding with the global financial crisis (perfect Smart Money shakeout).
3️⃣ Macro Wave (3) — the current dominant leg, fueled by exponential AI and data center growth . It’s extending toward the 3.618 Fibonacci extension (~$256) , confirming wave strength and institutional conviction.
4️⃣ Macro Wave (4) — expected between 2026–2027, likely retracing 0.236–0.382, a natural cooling period before the next breakout.
5️⃣ Macro Wave (5) — projected to rally toward 4.618 extension (~$2,500) , completing Super Cycle Wave (3) near 2029 🏁
From there, a larger Super Cycle Wave (4) correction could unfold before the final parabolic Super Cycle Wave (5) run to the 5.618 Fibonacci extension (~$26,000) — the climax of NVDA’s decades-long AI expansion super-trend 🌕
💰 Smart Money Concept (SMC) Perspective
The chart structure clearly shows Smart Money accumulation patterns in every correction phase:
Re-accumulation ranges appeared at every 0.618 retracement level 📊
Liquidity grabs below previous swing lows before strong impulsive moves ⚡
Fair Value Gaps (FVGs) filled during corrections, creating perfect liquidity imbalances that institutional players exploit
Currently, NVDA trades near a premium zone of Macro Wave (3), but Smart Money will likely reaccumulate during the upcoming Macro Wave (4) discount phase (2026–2027).
Expect Order Block re-tests and liquidity sweeps around discounted Fibonacci retracement zones (0.236–0.382) before the next major rally 📉➡️📈
📈 Price Action Structure
NVDA’s macro structure remains strongly bullish:
The multi-decade trend has respected every higher high and higher low sequence since 2008.
Each impulse is followed by a healthy re-accumulation range, never breaking long-term structure.
Expect distribution near the $250–$300 (split-adjusted) region as Wave (3) matures, followed by a macro correction that offers generational entries for long-term investors 🧠
🔢 Fibonacci Confluence & Technical Harmony
Fibonacci has been the invisible hand guiding NVDA’s growth 👇
0.786 retracement (2002) → deep liquidity reset
0.618 retracement (2008) → institutional re-entry
3.618 extension (256) → current macro resistance target
4.618 extension (2500) → Super Cycle Wave (3) final target
5.618 extension (26K) → ultimate Super Cycle Wave (5) projection
Each impulse and retracement aligns perfectly with Fibonacci’s geometric rhythm , proving the power of confluence between time, price, and sentiment.
🧠 Fundamentals — The Energy Behind the Waves
Behind the technicals lies unmatched fundamental growth :
💾 AI & Data Centers: NVIDIA is the core infrastructure for modern AI compute and cloud training workloads.
🧩 CUDA Ecosystem: A software moat that ties developers and enterprises directly to NVIDIA’s architecture.
🌐 Omniverse & Robotics: Positioning NVDA as a leader in 3D simulation, robotics, and digital twins — future trillion-dollar markets.
⚙️ Strategic Partnerships: Expanding across hyperscalers, automotives, and enterprise AI.
Each innovation wave fuels a new Elliott Wave impulse , with the AI revolution now driving the strongest macro leg in NVDA’s history.
⚡ Macro Outlook & Timeline
✅ Now (2025): Completing Macro Wave (3) of Super Cycle (3) → heading toward $256 target
⚠️ 2026–2027: Macro Wave (4) correction to 0.236–0.382 (Smart Money entry)
🚀 2028–2029: Macro Wave (5) push → Super Cycle (3) peak near $2,500
🌊 2030–2032: Super Cycle (4) correction — consolidation phase
💎 2035–2040+: Super Cycle (5) → ultimate 5.618 target near $26K
💬 Final Thoughts
"Every correction is a setup for the next expansion. Smart Money buys fear — not euphoria."
NVIDIA is the heartbeat of the AI revolution , the core of data-driven computing , and a living Fibonacci sequence in motion.
As long as fundamentals stay aligned with the wave rhythm, NVDA’s Supercycle will continue to redefine what’s possible in long-term growth. 🌌
#NVDA #ElliottWaveAnalysis #SmartMoneyConcept #PriceActionTrading #FibonacciMagic #AIRevolution #StockMarket #Investing #TradingViewCommunity #TechSupercycle #NVDAtoTheMoon #LongTermInvesting
💬 Traders, analysts, and wave watchers — your insights matter!
Have you spotted NVDA’s next move? Drop your Elliott Wave counts, confirmations, or constructive critiques below 👇 Let’s discuss NVIDIA’s structural evolution, AI-driven Supercycle, and long-term growth potential together 🚀💚
Every comment adds perspective — let’s decode this massive wave as a community! 🌊📈
— Team FIBCOS ⚡💎

Nvidia - Squeezing every single bear!🧯NVidia ( NASDAQ:NVDA ) is finally breaking out:
🔎Analysis summary:
Over the course of the past couple of months, Nvidia has been rallying +125%. Considering the market cap of Nvidia, this is already an insane move but clearly not the end. We can still see another +25% from here, before Nvidia will then retest the next resistance.
📝Levels to watch:
$250
SwingTraderPhil
SwingTrading.Simplified. | Investing.Simplified. | #LONGTERMVISION

Swing-trading positions using SOXX (NVDA).If all Risk-on is correlated to NVDA, probably make sense to use NASDAQ:SOXX sector.
Upsloping 10/20 using qullemaggie methodology.
"Tight price range".
Be in small caps with falling VIX, falling yields, falling dollar. And in big tech, with bullish vix.
