NVDA: Corrective Structure Toward 207 GapFrom an Elliott Wave perspective, NVDA appears to be developing a corrective sequence.
The decline from the recent all-time high to the 169.50 area unfolded as a three-wave ABC correction. Notably, this move lacked impulsive characteristics, as neither wave A nor wave C subdivided into a five-wave structure. This strongly supports the interpretation of the decline as corrective rather than impulsive.
Based on this structure, price may now form another corrective three-wave move to the upside. This potential advance is highlighted on the chart with a purple arrow, projecting toward the 207 area, where a previously unfilled gap remains. The gap is considered additional confluence, not the primary driver of the setup.
Once this corrective move completes, I will be watching for renewed downside development. From that point, two alternative scenarios are possible, both outlined on the chart using the green and orange arrows.
This analysis is focused on wave structure and corrective sequencing, rather than trend continuation or directional bias.
Nvdalong

Rebound from support on Nvidia?Despite the recent narrow range for the NVDA Stock, there is a lot going on from a technical standpoint. Starting with the basics, you will acknowledge that price rebounded from a 1M support area between US$170.01 and US$174.65 in December last year and subsequently engulfed nearby 1M resistance at US$185.23, which is now being retested as support. In terms of overhead resistance, there is limited stopping the Stock from respecting the current support and targeting the 1M resistance seen at US$207.98. Note that this level is set just south of the all-time high of US$212.19.
Adding to this bullish focus, chart pattern enthusiasts may recognise the double-bottom pattern that formed in November/December from the noted support zone. The neckline has been taken out, and the pattern’s profit objective resides around the 1M resistance pencilled in above at US$207.98.
Written by the FP Markets Research Team

NVDA Bullish Setup | Structure, Momentum & Risk Defined🔥 NVDA Bullish Layered Accumulation Playbook (Swing Trade)
Asset:
NVDA – NVIDIA Corporation
NASDAQ Exchange | US Equities
🧭 Trade Thesis (Bullish Bias)
NVDA remains structurally strong within the broader AI, data-center, and semiconductor leadership cycle. Price action shows healthy pullback behavior within a dominant bullish trend, offering swing traders an opportunity to accumulate via layered entries instead of chasing breakouts.
This plan is designed using a layered limit-order approach (“thief-style accumulation”), allowing flexibility and improved average pricing during volatility.
🟢 Entry Strategy – Layered Accumulation (Thief Style)
Instead of a single entry, this plan uses multiple buy-limit layers to manage volatility and avoid emotional entries.
📌 Layered Buy Zones (example):
Buy Limit 1: $190.00
Buy Limit 2: $185.00
Buy Limit 3: $180.00
👉 Traders may add or adjust layers based on their own risk tolerance, timeframe, and volatility expectations.
👉 This structure allows participation from any price level, while improving cost basis if price dips.
🔴 Risk Management – Stop-Loss Zone
🛑 Protective Stop-Loss: $175.00
⚠️ Important Note (Risk Awareness):
Dear Ladies & Gentlemen (Thief OGs), this stop-loss level is not mandatory. Risk management is a personal decision — manage size responsibly and secure profits according to your own trading plan.
🎯 Target Zone – Profit Protection Area
🚧 Target: $205.00
This level aligns with:
Prior strong resistance (police barricade zone)
Signs of potential overbought conditions
Possible liquidity traps near highs
📌 The plan is to escape with profits, not to predict tops. Partial profit-taking is encouraged as price approaches resistance.
⚠️ TP Reminder:
This take-profit level is guidance only. Traders are free to secure gains based on their own strategy and market conditions.
📊 Technical Context (Clean & TradingView-Friendly)
Bullish higher-timeframe structure intact
Pullback within trend = accumulation opportunity
Layered entries reduce timing risk
Resistance overhead justifies disciplined exits
🌍 Fundamental & Economic Factors Supporting NVDA
Fundamental Drivers:
NVIDIA remains a core leader in AI chips, data centers, and accelerated computing
Strong demand from cloud providers, AI infrastructure, and enterprise compute
Ongoing investment in next-gen GPUs and AI platforms
Macro & Economic Considerations:
US tech sector strength tied to AI capex cycles
Market sensitivity to interest-rate expectations and inflation data
Risk-on sentiment generally benefits high-growth semiconductor leaders
📌 Watch upcoming:
US CPI / PPI inflation data
Federal Reserve rate guidance
Earnings or forward-looking statements impacting AI demand expectations
🔗 Related Symbols to Watch (Correlation Check)
NASDAQ:SOXX / NASDAQ:SMH – Semiconductor ETFs (sector health confirmation)
NASDAQ:QQQ / NASDAQ:NDX – Nasdaq strength supports NVDA momentum
NASDAQ:AMD – Peer comparison and sentiment gauge
NASDAQ:MSFT / NASDAQ:GOOGL – AI infrastructure demand correlation
📈 Strength in these symbols often confirms bullish continuation in NVDA.
🧠 Master Trader Note (Correction & Guidance)
You’re not “wrong” in asking for layered entries at any price level — this is a valid accumulation methodology. The key improvement is clarity, structure, and risk framing, which ensures the idea remains educational, compliant, and professional rather than promotional or misleading.
✨ “If you find value in my analysis, a 👍 and 🚀 boost is much appreciated — it helps me share more setups with the community!”
⚠️ Disclaimer: This is a thief-style trading strategy just for fun. This analysis is for educational purposes only and does not constitute financial advice. Trade responsibly.

NVIDIA Strengthens AI Stack With SchedMD AcquisitionNVIDIA (NASDAQ: NVDA) has expanded its software and infrastructure footprint with the acquisition of SchedMD, the developer of Slurm — the world’s most widely used open-source workload manager for high-performance computing (HPC) and AI. The move reinforces NVIDIA’s strategy of controlling not just compute hardware, but also the software layers that orchestrate large-scale AI workloads.
Slurm plays a critical role in scheduling, queuing, and allocating resources across massive compute clusters, and is currently used in more than half of the world’s top supercomputers. As AI model training and inference grow more complex and resource-intensive, efficient workload management has become essential. By acquiring SchedMD, NVIDIA gains deeper integration between its accelerated hardware and the software infrastructure that powers AI and HPC environments.
Importantly, NVIDIA confirmed that Slurm will remain open-source and vendor-neutral. This signals a clear effort to strengthen the broader AI ecosystem rather than lock customers into proprietary software. NVIDIA plans to continue investing in Slurm’s development while expanding its compatibility across heterogeneous clusters, cloud providers, and enterprise systems. This positions NVIDIA as a central enabler of next-generation AI infrastructure across industries such as healthcare, autonomous driving, finance, manufacturing, and government research.
From a technical perspective, NVDA is currently consolidating after a strong multi-month rally. Price has pulled back from recent highs near the $210 area and is trading below short-term resistance around $180–$185. The chart highlights a key demand zone near the $150 region, which previously acted as a breakout level and aligns with strong historical support. A deeper retracement toward this zone could offer a technical reset before the next leg higher.
If buyers successfully defend support and reclaim $185, NVDA could resume its broader uptrend toward prior highs. Overall, the fundamentals remain firmly bullish, with the SchedMD acquisition strengthening NVIDIA’s long-term AI dominance as the stock navigates a short-term technical consolidation.

Nvidia (NASDAQ: $NVDA) Eyes H200 Output Boost on China DemandNvidia (NASDAQ: NVDA) is weighing a major expansion of its H200 AI chip production after demand from Chinese companies exceeded current supply, according to Reuters sources. The surge in interest follows the U.S. government’s recent decision to allow Nvidia to export H200 processors to China under a 25% tariff, reigniting competition for access to high-performance computing hardware.
Chinese tech giants—including Alibaba and ByteDance—reportedly contacted Nvidia almost immediately after the announcement, eager to secure bulk orders of the H200. However, the situation remains fluid. The Chinese government has not yet approved inbound H200 shipments and held emergency meetings this week to determine whether to allow the chip into the country.
Limited supply is another complication. Nvidia is prioritizing production of its next-generation Blackwell and upcoming Rubin architectures, leaving only small quantities of H200 units available. This scarcity has intensified demand because the H200 is currently the most powerful AI chip legally accessible to Chinese companies—nearly six times stronger than the downgraded H20 version released in 2023.
Industry analysts warn that allowing the H200 into China could slow the growth of China’s domestic AI chip ecosystem. Chinese regulators are considering conditions such as requiring each H200 purchase to be bundled with locally produced chips to support homegrown semiconductor development.
Technical Analysis
The NVDA chart currently shows price consolidating below the recent high near $212. After a strong multi-month rally, the stock has pulled back into a key short-term support zone around $175–$185. Holding this range could position NVDA for a retest of its highs, supported by strong demand catalysts and ongoing AI infrastructure investment.
If price breaks below $175, a deeper correction toward the $150 demand zone becomes likely. Volume is stabilizing, and RSI sits mid-range, indicating a neutral momentum backdrop awaiting a directional catalyst. Traders should watch for reclaiming the $190–$195 area to confirm bullish continuation.

Nvidia: Downside Pressure Nvidia has recently faced notable downward pressure, but so far has managed to hold above the support level at $176.21. As a result, we continue to anticipate an imminent rally as part of the beige wave V, which should lift the stock into the now-red Target Zone between $227.38 and $260.60. However, if the stock immediately drops below the $176.21 mark, we would expect a new low for the beige wave alt.IV, with the lower $145.50 level still likely to hold.

Elliott Waves Don’t Lie: NVDA’s Path to $26,000Summary: “Elliott Waves, Fibonacci, and Smart Money align perfectly — NVIDIA’s long-term chart points to an AI-powered Supercycle with massive upside." 💎📊
🚀 NVDA | The Supercycle of the AI Era! 💚
🌀 Elliott Wave Supercycle Breakdown
NVIDIA’s price action over the past two decades is a textbook example of a multi-decade Elliott Wave Supercycle — where technical , fundamentals , and Smart Money flows perfectly align to form a once-in-a-generation structure 🌎
Let’s break it down step-by-step 👇
Super Cycle Wave (1) — launched in the early 2000s, marking NVDA’s first growth phase during the birth of consumer GPUs 🎮.
Super Cycle Wave (2) — deep correction into 2002, retracing a 0.786 Fibonacci, cleansing early euphoria and creating the foundation for institutional accumulation 💼.
Then began the Super Cycle Wave (3) — the most powerful phase of all. Within it, we have distinct macro sub-waves:
1️⃣ Macro Wave (1) — ended in 2007 , aligning with the first institutional wave of adoption.
2️⃣ Macro Wave (2) — retraced 0.618 in 2008 , coinciding with the global financial crisis (perfect Smart Money shakeout).
3️⃣ Macro Wave (3) — the current dominant leg, fueled by exponential AI and data center growth . It’s extending toward the 3.618 Fibonacci extension (~$256) , confirming wave strength and institutional conviction.
4️⃣ Macro Wave (4) — expected between 2026–2027, likely retracing 0.236–0.382, a natural cooling period before the next breakout.
5️⃣ Macro Wave (5) — projected to rally toward 4.618 extension (~$2,500) , completing Super Cycle Wave (3) near 2029 🏁
From there, a larger Super Cycle Wave (4) correction could unfold before the final parabolic Super Cycle Wave (5) run to the 5.618 Fibonacci extension (~$26,000) — the climax of NVDA’s decades-long AI expansion super-trend 🌕
💰 Smart Money Concept (SMC) Perspective
The chart structure clearly shows Smart Money accumulation patterns in every correction phase:
Re-accumulation ranges appeared at every 0.618 retracement level 📊
Liquidity grabs below previous swing lows before strong impulsive moves ⚡
Fair Value Gaps (FVGs) filled during corrections, creating perfect liquidity imbalances that institutional players exploit
Currently, NVDA trades near a premium zone of Macro Wave (3), but Smart Money will likely reaccumulate during the upcoming Macro Wave (4) discount phase (2026–2027).
Expect Order Block re-tests and liquidity sweeps around discounted Fibonacci retracement zones (0.236–0.382) before the next major rally 📉➡️📈
📈 Price Action Structure
NVDA’s macro structure remains strongly bullish:
The multi-decade trend has respected every higher high and higher low sequence since 2008.
Each impulse is followed by a healthy re-accumulation range, never breaking long-term structure.
Expect distribution near the $250–$300 (split-adjusted) region as Wave (3) matures, followed by a macro correction that offers generational entries for long-term investors 🧠
🔢 Fibonacci Confluence & Technical Harmony
Fibonacci has been the invisible hand guiding NVDA’s growth 👇
0.786 retracement (2002) → deep liquidity reset
0.618 retracement (2008) → institutional re-entry
3.618 extension (256) → current macro resistance target
4.618 extension (2500) → Super Cycle Wave (3) final target
5.618 extension (26K) → ultimate Super Cycle Wave (5) projection
Each impulse and retracement aligns perfectly with Fibonacci’s geometric rhythm , proving the power of confluence between time, price, and sentiment.
🧠 Fundamentals — The Energy Behind the Waves
Behind the technicals lies unmatched fundamental growth :
💾 AI & Data Centers: NVIDIA is the core infrastructure for modern AI compute and cloud training workloads.
🧩 CUDA Ecosystem: A software moat that ties developers and enterprises directly to NVIDIA’s architecture.
🌐 Omniverse & Robotics: Positioning NVDA as a leader in 3D simulation, robotics, and digital twins — future trillion-dollar markets.
⚙️ Strategic Partnerships: Expanding across hyperscalers, automotives, and enterprise AI.
Each innovation wave fuels a new Elliott Wave impulse , with the AI revolution now driving the strongest macro leg in NVDA’s history.
⚡ Macro Outlook & Timeline
✅ Now (2025): Completing Macro Wave (3) of Super Cycle (3) → heading toward $256 target
⚠️ 2026–2027: Macro Wave (4) correction to 0.236–0.382 (Smart Money entry)
🚀 2028–2029: Macro Wave (5) push → Super Cycle (3) peak near $2,500
🌊 2030–2032: Super Cycle (4) correction — consolidation phase
💎 2035–2040+: Super Cycle (5) → ultimate 5.618 target near $26K
💬 Final Thoughts
"Every correction is a setup for the next expansion. Smart Money buys fear — not euphoria."
NVIDIA is the heartbeat of the AI revolution , the core of data-driven computing , and a living Fibonacci sequence in motion.
As long as fundamentals stay aligned with the wave rhythm, NVDA’s Supercycle will continue to redefine what’s possible in long-term growth. 🌌
#NVDA #ElliottWaveAnalysis #SmartMoneyConcept #PriceActionTrading #FibonacciMagic #AIRevolution #StockMarket #Investing #TradingViewCommunity #TechSupercycle #NVDAtoTheMoon #LongTermInvesting
💬 Traders, analysts, and wave watchers — your insights matter!
Have you spotted NVDA’s next move? Drop your Elliott Wave counts, confirmations, or constructive critiques below 👇 Let’s discuss NVIDIA’s structural evolution, AI-driven Supercycle, and long-term growth potential together 🚀💚
Every comment adds perspective — let’s decode this massive wave as a community! 🌊📈
— Team FIBCOS ⚡💎

Nvidia - Squeezing every single bear!🧯NVidia ( NASDAQ:NVDA ) is finally breaking out:
🔎Analysis summary:
Over the course of the past couple of months, Nvidia has been rallying +125%. Considering the market cap of Nvidia, this is already an insane move but clearly not the end. We can still see another +25% from here, before Nvidia will then retest the next resistance.
📝Levels to watch:
$250
SwingTraderPhil
SwingTrading.Simplified. | Investing.Simplified. | #LONGTERMVISION

Nvidia: Acceleration Toward New Highs Nvidia gained strong upward momentum shortly after our last update, surging past the $196.45 mark, which had previously served as resistance. As a result, our prior short-term alternative scenario was triggered, and we have now adjusted the chart accordingly (with minor modifications). We now view the green wave as complete and believe that the joint top of green wave and beige wave III, as well as the low of wave IV, have already been established. The Target Zone we had initially set for the wave- low has therefore been removed. In our updated short-term alternative scenario, we still see a 30% probability of a new low for beige wave alt.IV below the $176.21 support level. In this case, however, price would likely rebound above the lower $145.50 level.

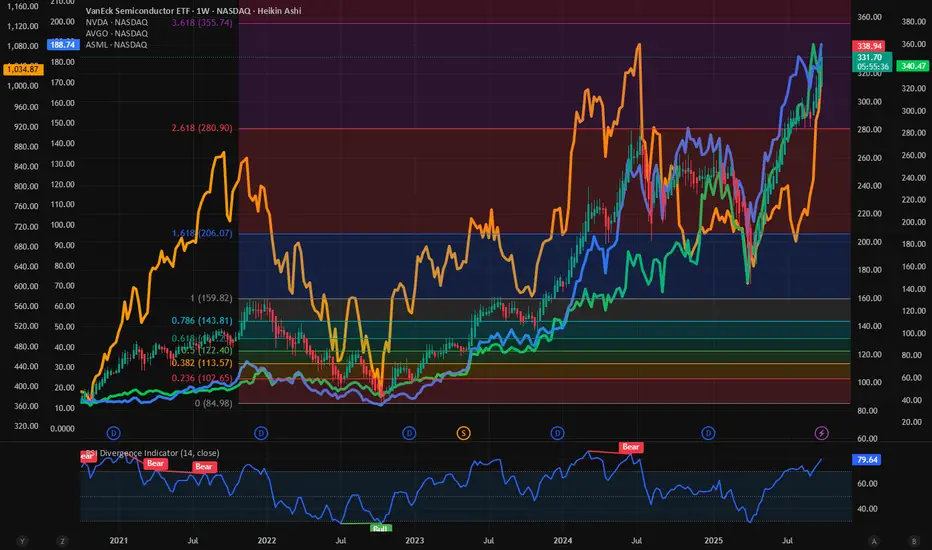
$SMH historic highs. $NVDA dominance stalled. Expect more upsideHi all, I am back after a quick 2 weeks of holiday to bring you the latest on the charts. Today we look at our favorite sector, the Semis. ETF NASDAQ:SMH is approaching the 3.618 Fib Retracement level which lies at 360 $ is within the reach. I predicted in my blog on 5th Oct that the year end target on NASDAQ:SMH is 360 $.
NASDAQ:NVDA & NASDAQ:AVGO powering higher. NASDAQ:ASML to 1000 $. NASDAQ:SMH has wings. for NASDAQ:SMH by RabishankarBiswal — TradingView
It seems that this target is reachable in the next couple of weeks, if the market volatility remains subdued and CBOE:UVXY remains below 20.
But what I am observing is that the Semiconductor index is making new highs even if the ratio $NVDA/ NASDAQ:SMH is making a short-term low. This is good for the internals within the Semiconductor sector which indicates intrasector rotation. Recently other stocks like NASDAQ:AVGO and NASDAQ:AMD have taken over the baton. The ratio $NVDA/ NASDAQ:SMH after hitting a peak of 0.62 has retreated to 0.52 indicating a 10% drop in its dominance in $SMH. If NASDAQ:NVDA must regain its dominance, then the stock must go up by 20% which will take it back to 220 $.
Verdict : Strong momentum in $SMH. 360 $ reachable in a few weeks. NASDAQ:NVDA dominace set to go higher with price upto 220 $ to 250 $.

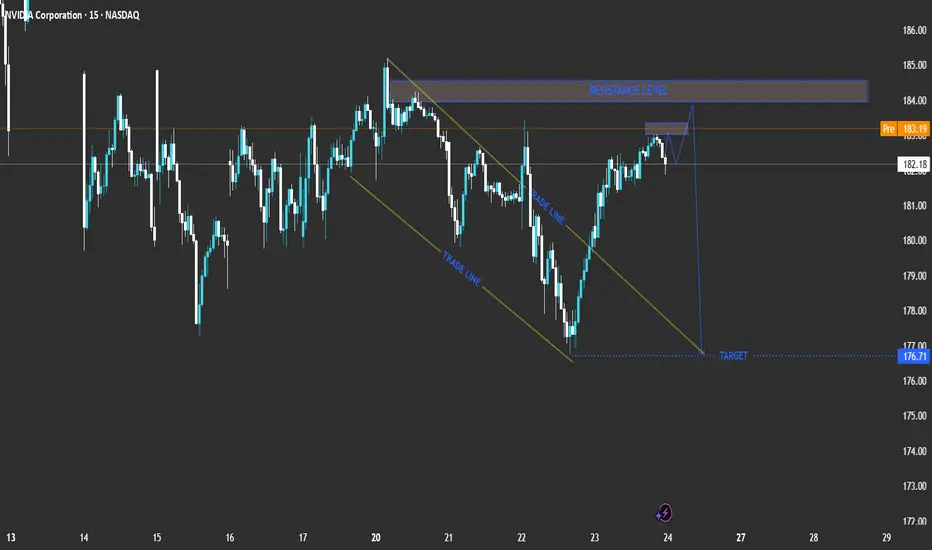
r NVIDIA Corporation (NVDA) based on your chart:Current Price: 182.18
Pre-Market Price: 183.21
Trend: Short-term bullish recovery inside a broader corrective phase.
Technical Breakdown
Descending Channel (Trade Line)
NVDA recently traded inside a downward-sloping channel, showing controlled selling pressure.
The breakout above the upper trade line suggests a short-term bullish correction phase.
Resistance Zone
A strong resistance level lies between 183.00 and 184.00.
This zone aligns with previous highs and may act as a reversal area if the price fails to break above it.
Expected Move
The chart projection shows a potential rejection near the resistance level, followed by a pullback towards the 176.71 target area.
This indicates that the current upward move might be corrective before another bearish swing.
Trade Scenarios
📉 Bearish Reversal Scenario (Primary Setup)
Entry Zone: 183.00 – 184.00 (resistance area)
Confirmation: Bearish rejection candlestick pattern or a failed breakout.
Target: 176.71
Stop Loss: Above 184.50
Comment: Ideal short setup if price rejects resistance.
📈 Bullish Breakout Scenario (Alternative)
Entry: Above 184.50 with strong bullish momentum.
Target: 186.50 – 187.00
Comment: A breakout and hold above resistance would invalidate the short setup and indicate further upside.
Summary Table
Bias Key Level Confirmation Target Notes
Bearish (Primary) 183 – 184 Rejection candle 176.71 Short setup
Bullish (Alternative) Above 184.50 Breakout candle 186.5 – 187 Upside continuation
Conclusion
NVIDIA (NVDA) is approaching a crucial resistance level. The most probable scenario is a bearish reversal from the 183–184 zone, targeting 176.71. However, a confirmed breakout above 184.50 would signal bullish continuation toward 187.00. NASDAQ:PLTR NASDAQ:AMD NASDAQ:AMZN NASDAQ:AAPL NASDAQ:TSLA OMXCOP:BAVA OMXCOP:GN OMXCOP:DNORD OMXCOP:TRMD_A OMXCOP:MAERSK_B OMXCOP:NKT OMXCOP:PNDORA OMXCOP:NSIS_B OMXCOP:DSV OMXCOP:ORSTED OMXCOP:GMAB
Nvidia - The next rally of +33% started!🚀Nvidia ( NASDAQ:NVDA ) just broke out:
🔎Analysis summary:
Over the past couple of months, Nvidia has been rallying an expected +100%. However, just objectively looking at the chart, this rally is not over yet. After the confirmed all time high breakout, Nvidia can rally another +33% until it will retest a substantial resistance level.
📝Levels to watch:
$250
SwingTraderPhil
SwingTrading.Simplified. | Investing.Simplified. | #LONGTERMVISION

Nvidia - Starting a clear +20% rally!🧲Nvidia ( NASDAQ:NVDA ) rallies higher now:
🔎Analysis summary:
About one decade ago, Nvidia broke out of a major bullish triangle pattern. Following this remarkable breakout, Nvidia continued with a rally of about +35.000%. But looking at all these previous cycles, Nvidia remains bullish with another potential +20% move towards the upside.
📝Levels to watch:
$200, $250
SwingTraderPhil
SwingTrading.Simplified. | Investing.Simplified. | #LONGTERMVISION

$NVDA : The Rally’s Writing Its Own Headline! 10/9/2025NASDAQ:NVDA is making steady strides toward its wave C target of $235, following a challenging 13-month correction that found its bottom at $95 in April.
The bullish momentum could push prices even higher, eyeing a potential $321.
Sit tight and enjoy the ride! 🚀👌

$NVDA & $AVGO powering higher. $ASML to 1000 $. $SMH has wings.A quick update on our favorite sector and the favorite stocks within the sector before we go to the weekend. Previously in this space multiple times we have provided price targets on the Semiconductor sector ETF NASDAQ:SMH and the individual stocks like $NVDA. NASDAQ:AVGO and $ASML. We have reiterated our targets for NASDAQ:SMH and the stocks multiple times. In fact, NASDAQ:SMH is above my long term target which is bullish.
NASDAQ:NVDA rolling over. NASDAQ:SMH looks vulnerable for NASDAQ:NVDA by RabishankarBiswal — TradingView
NASDAQ:AVGO above its previous ATH and holding on. 400 $ reachable. for NASDAQ:AVGO by RabishankarBiswal — TradingView
NASDAQ:ASML : Is the stock primed for upside? Indicators are aligned. for EURONEXT:ASML by RabishankarBiswal — TradingView
We stick to our targets from the posts above. NASDAQ:NVDA to 250 $. AVGO to 400 $ and ASML to 980 $ - 1000 $. New target NASDAQ:SMH to 360 $ to 3.618 Fib level.
Verdict: Semis have a good momentum. Stay long and strong. NASDAQ:SMH to 360 $ before year end.
Nvidia - The rally is still not over!🔌Nvidia ( NASDAQ:NVDA ) still heads much higher:
🔎Analysis summary:
For the past decade, Nvidia has perfectly been respecting a major bullish rising channel formation. Currently, Nvidia is still far away from the upper red resistance trendline, which indicates another potential move higher. Just understand that the trend is your closest friend.
📝Levels to watch:
$200
SwingTraderPhil
SwingTrading.Simplified. | Investing.Simplified. | #LONGTERMVISION

NVDA $182 Weekly CALL Setup – Cheap Premium, Big Upside?
# 🚀 NVDA Weekly Options Trade Idea (2025-09-03)
### 📊 Multi-Model Recap
* **Daily RSI**: 📉 34.3 (weak)
* **Weekly RSI**: 🔻 73.2 (falling)
* **Volume**: +1.3x → institutional distribution signs
* **Options Flow**: 🔥 C/P = 1.96 (bullish skew)
* **Gamma/Theta**: ⚡ High risk (2 DTE)
👉 Models Split:
* 🐻 Bearish: Claude, Gemini → favor \$165 PUT
* 🐂 Bullish: Llama, Grok → favor \$175 CALL
* 😶 Neutral/No Trade: Claude (low confidence)
---
### 🧭 Consensus Read
* Price & volume = bearish ⚠️
* Options flow & VIX = bullish 📈
* Net: **Mixed bias → tactical bullish bounce possible**
---
### ✅ Trade Setup (Viral Play)
```json
{
"instrument": "NVDA",
"direction": "CALL",
"strike": 175,
"expiry": "2025-09-05",
"entry_price": 0.68,
"profit_target": 1.36,
"stop_loss": 0.34,
"size": 1,
"confidence": 0.65,
"entry_timing": "market open"
}
```
---
### 🎯 Trade Details
* 📌 **Strike**: \$182 CALL
* 💵 **Entry**: 0.68 (ask, open)
* 🎯 **Target**: 1.36 (+100%)
* 🛑 **Stop**: 0.34 (-50%)
* 📅 **Expiry**: Sep 5 (2 DTE)
* 📈 **Confidence**: 65%
* ⏰ **Hold Policy**: Close by Thu EOD (don’t ride Friday gamma bomb)
---
⚠️ **Risks**:
* 2 DTE = 🔥 high gamma / fast theta decay
* Divergent signals → whipsaws possible
* Tight stop discipline required 🚨

NVDA Earnings Play | \$190C– Don’t Miss Out
# 🚀 NVDA Earnings Play | \$190C @ 2.49 | 200–400% Target 🎯
### 📝 Quick Take (TL;DR)
* **Bias:** Moderate-Bullish (78% confidence).
* **Rationale:** Fundamentals 🔥 + Options flow skewed bullish 📈 + Technicals constructive.
* **Main Risk:** China export \~\$8B headwind in guidance.
---
### 🎯 Trade Idea
* **Buy** NVDA **2025-08-29 \$190 Call**
* 📌 Entry: \$2.49 (ask) — enter **pre-earnings close** (Aug 26 AMC).
* 🛑 Stop: \$1.25 (−50%).
* 🎯 Targets:
* +200% → \$7.47
* +300% → \$9.96
* ⏳ Exit Rule: If neither stop/target hit, **close within 2h post-earnings open**.
* ⚖️ Risk: \$249 per contract (max loss).
---
### 📊 Why This Setup?
**Fundamentals (9/10)**
* Revenue growth: +69% TTM 🚀
* Margins elite (gross 70%, net 52%) 💰
* Beat history: 8/8 last quarters ✅
* Balance sheet strong (cash \~\$54B).
**Options Flow (8/10)**
* Implied move ~~5.9% (~~\$10.5).
* Call OI heavy @ \$185–\$200 (gamma cluster).
* Liquidity excellent at \$190 strike (OI >64k).
**Technicals (8/10)**
* Price \$179.83, holding above 20/50/200 MAs.
* RSI neutral (53).
* Resistance: \$184.5 / \$190 / \$200.
* Coiling under highs 🔄.
**Macro (6/10)**
* AI/data center demand = secular tailwind.
* China ban risk headline.
* VIX \~15 → complacency = bigger gap risk.
---
### ⚠️ Risks
* Guidance may highlight China hit (\$8B) → bearish gap.
* IV crush 30–50% post-print.
* Gap risk may bypass stop.
* Single-leg naked = high variance → **size small (≤2% portfolio).**
---
### 📌 Execution Checklist
✅ Confirm ask = 2.49 @ close.
✅ Expiry = 2025-08-29 (weekly).
✅ Size ≤ 2% acct.
✅ Close within 2h post-earnings if no trigger.
---
### 📊 TRADE JSON
```json
{
"instrument": "NVDA",
"direction": "call",
"strike": 190.0,
"expiry": "2025-08-29",
"confidence": 78,
"entry_price": 2.49,
"stop_loss": 1.245,
"profit_target": 7.47,
"size": 1,
"entry_timing": "pre_earnings_close",
"earnings_date": "2025-08-26",
"earnings_time": "AMC",
"expected_move": 5.9,
"iv_rank": 0.75,
"signal_publish_time": "2025-08-26 14:00:37 UTC-04:00"
}
```
---
### 🔖 Hashtags
\#NVDA #EarningsPlay #OptionsTrading #CallOptions #StockMarket #AIStocks #Futures #SwingTrade #TradingSignals #RiskReward #OptionsFlow #SP500 #TechStocks

NVDA \$200C→ Big Move Loading?
# 🚀 NVDA Weekly Options Setup | \$200 Call 🎯 (High Risk / High Reward)
📊 **TRADE SNAPSHOT**
* **Ticker**: NVDA
* **Direction**: 📈 CALL (LONG)
* **Strike**: \$200
* **Entry Price**: \$1.44
* **Profit Target**: \$2.16 (50% gain)
* **Stop Loss**: \$0.58 (40% risk)
* **Expiry**: 2025-08-29
* **Confidence**: 65%
* **Timing**: Enter at Open
* **Signal Time**: 2025-08-23 11:11 EDT
---
### 🔎 Market Analysis
✅ **Weekly RSI**: 87.2 (RISING → Strong Bullish)
⚠️ **Daily RSI**: 63.3 (FALLING → Short-term caution)
📉 **Volume**: 0.9x last week (Weak confirmation)
🔥 **Options Flow**: Calls 617k vs. Puts 383k → **1.61 ratio (Bullish Bias)**
---
### 📈 Bias & Strategy
* **Overall Sentiment**: **Moderate Bullish** 🚀
* Bullish institutions loading Calls → supports upside.
* Weak daily momentum + low volume = ⚠️ caution.
* High gamma risk → manage tight with stop loss.
🏷 **Tags**:
\#NVDA #OptionsTrading #SwingTrade #WeeklyOptions #TradingView #StockMarket #EarningsPlay #MomentumTrading #OptionsFlow #GammaRisk
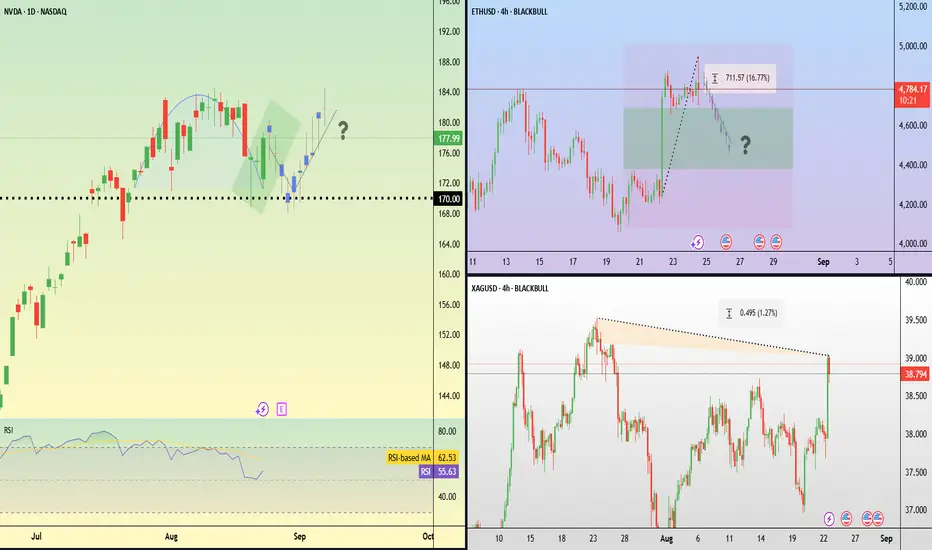
Traders caught off guard --- Now NVDA's Reverse Cup and HandleTraders were caught off guard by Federal Reserve Chairman Jerome Powell’s unexpectedly dovish tone at the Jackson Hole symposium.
In his keynote, Powell highlighted softening inflation risks and growing concerns over the labour market, boosting market expectations of a 25-basis point rate cut in September.
The speech ignited a strong cross-asset rally. Equities surged, with the S&P 500 up 1.5% and the Nasdaq advancing 1.9%. Ethereum led digital assets higher, soaring 15%, climbing as high as $4,950 and surpassing its previous November 2021 high of $4,866. Silver also rallied, touching $39 per ounce and moving closer to its 14-year peak of $39.5 reached at the end of July.
Looking ahead, U.S. markets will turn their focus to Nvidia’s upcoming earnings results. Price action shows a series of higher highs and higher lows, but the stock has recently faced resistance near $190. Price potentially remains supported around $170, which aligns with the breakout zone from early August.
Nvidia - This is clearly not the end!📐Nvidia ( NASDAQ:NVDA ) will simply rally more:
🔎Analysis summary:
Yes, over the past couple of months, Nvidia has been rallying another +100%. But looking at the higher timeframe, this is still not the end of the unbelievable bullrun. Following the rising channel pattern, Nvidia can rally another +20% before we might see a potential retracement.
📝Levels to watch:
$250
SwingTraderPhil
SwingTrading.Simplified. | Investing.Simplified. | #LONGTERMVISION

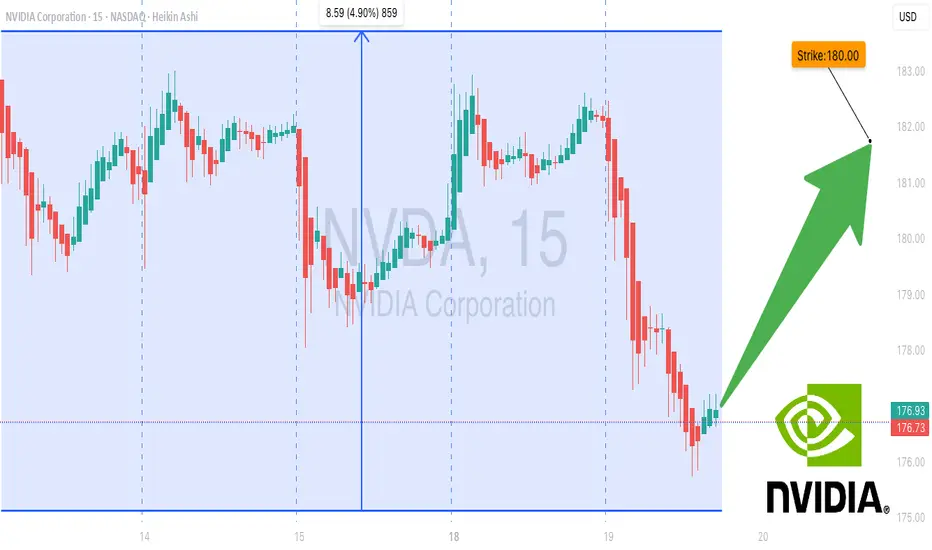
Strong Bullish Flow in NVDA: $180 Calls Primed for Breakout! 🚀 NVDA Weekly Options Bullish Flow – Aug 19, 2025
**Market Sentiment:**
📈 Total calls: **632,689** | Total puts: **334,721**
💥 **Call/Put Ratio: 1.89 → Strong Weekly Bullish Flow**
⚠️ Gamma Risk: Moderate – watch volatility closely.
**Technical Indicators:**
* **Daily RSI:** 63.3 → slight pullback signs
* **Weekly RSI:** 87.2 → 🚀 strong weekly momentum
* **Weekly Volume Ratio:** 0.9x → weak institutional activity, caution advised
**Options Highlights:**
* Key strikes: **\$180** (OI: 65,649), **\$187.50** (liquid and premium-friendly)
* Expiration in **3 days** → time decay accelerating
**Risks to Monitor:**
* Weak weekly volume
* Daily RSI trending down
* Price support at **\$175.90–\$176.00**
**Consensus & Trade Setup:**
* **Overall Bias:** Moderate Bullish
* **Recommended Trade:** **Single-leg Call**
* **Strike:** \$180.00
* **Entry:** \$3.60
* **Stop Loss:** \$1.80
* **Profit Target:** \$6.00–\$7.50 (80%-100% potential)
* **Confidence:** 65%
**Trade JSON Snapshot:**
```json
{
"instrument": "NVDA",
"direction": "call",
"strike": 180.0,
"expiry": "2025-08-22",
"confidence": 0.65,
"profit_target": 6.00,
"stop_loss": 1.80,
"size": 1,
"entry_price": 3.60,
"entry_timing": "open",
"signal_publish_time": "2025-08-19 13:15:57 EDT"
}
NVDA Ready to Break Higher – $187.50 Calls Flashing Opportunity!
# 🚀 NVDA Weekly Options Analysis (2025-08-17) – Don’t Miss Out!
### 🔎 Model Insights Recap
**Grok/xAI Report**
* 📊 RSI: Falling (daily & weekly → potential exhaustion)
* 📈 Call/Put Ratio: **2.00 (Bullish flow)**
* 🔊 Volume: Weak
* ✅ Decision: Moderate bullish → suggested **\$190 Call**
**Gemini/Google Report**
* 📊 RSI: Declining
* 📈 Options Flow: Strong, but weak trend & volume
* 🛑 Decision: **Pass** (low confidence)
**Claude/Anthropic Report**
* 📊 Technical: Overbought with negative divergence
* 🔊 Volume: Flat weekly
* 🛑 Decision: **No trade** (bearish momentum indicators)
**Llama/Meta Report**
* 📊 Bias: Neutral-bullish (options flow positive)
* 🔊 Volume: Weak
* ✅ Decision: **\$187.50 Call** with caution
**DeepSeek Report**
* 📊 Market: Bearish divergence despite bullish flow
* 🔊 Volume: Weak institutional support
* 🛑 Decision: **No trade**
---
### 📌 Key Agreements
✔️ Declining daily & weekly RSI = potential momentum exhaustion
✔️ Strong call/put ratio = bullish sentiment from options traders
✔️ Weak volume = lack of support for sustained upside
### 📌 Key Disagreements
⚖️ Grok/xAI & Llama/Meta → potential bullish calls
⚖️ Gemini/Claude/DeepSeek → caution/pass
⚖️ Bullishness varies depending on options flow vs volume
---
## 📊 Recommended Trade Setup
* **Direction:** CALL (Long)
* **Strike:** \$187.50
* **Expiry:** 2025-08-22
* **Entry Price:** \$0.85
* **Stop Loss:** \$0.34 – \$0.425 (40-50% of premium)
* **Profit Target:** \$1.50 (50-100% return)
* **Entry Timing:** Market Open
* **Confidence:** 65%
---
### ⚠️ Key Risks
* **Momentum Exhaustion:** Falling RSI could signal reversals
* **Weak Institutional Support:** Volume may limit upside
* **Event Risk:** Upcoming earnings may introduce volatility
---
📊 **TRADE DETAILS JSON**
```json
{
"instrument": "NVDA",
"direction": "call",
"strike": 187.50,
"expiry": "2025-08-22",
"confidence": 0.65,
"profit_target": 1.50,
"stop_loss": 0.34,
"size": 1,
"entry_price": 0.85,
"entry_timing": "open",
"signal_publish_time": "2025-08-17 09:26:30 EDT"
}
```
