NVIDIA shooting up- Trump Presidency favouring to upside to $200Markets are loving the election results so far.
And it looks like it's been pricing in upside and a rally for some time now. Starting in Early October.
So, technically AI stocks are showing all time highs on it's way with the markets.
First the price broke above the W Formation (Breakout pattern)
Second, Price> 20 and 200
Third, any American company that is in Crypto or AI has the upper hand for investors right now with Trumps idea of keeping everything American by increasing tariffs worldwide (especially in China of over 60%).
He is inviting more local manufuacturers and businesses to excel within America.
So target for Nvidia will be set first to $200
Nvidia

Elliott Wave View Expects NVDA (Nvidia)To Extend HigherShort Term Elliott Wave View in NVDA (Nvidia) suggests further upside in daily bullish sequence. It is trading in bullish weekly sequence at all time high and expect continuation against August-2024 low. In 4-Hour, it placed (1) at $131.26 high and (2) correction at $100.95 low. Above there, it favors upside in (3) of impulse sequence. It placed 1 of (3) at $120.79 high, 2 at $112.78 low, 3 at $144.50 high and 4 at $132.11 low. Currently, it favors upside in 5 of (3) from 31-October low and expect one more push higher to finish it, while dips remain above $143.57 low.
Above $132.11 low, it placed ((i)) of 5 at $139.99 high, ((ii)) at $135.35 low, ((iii)) at $149.95 high and ((iv)) at 143.57 low as double correction. Within ((iv)), it placed (w) at $146.26 low, (x) at $148.85 high and (y) as ((iv)) ended at $143.57 low. Above ((iv)) low, it favors pullback in (ii), while placed (i) at $146.49 high and expect continuation in ((v)), which confirm above $149.95 high. It expects ((v)) to extend towards $151.47 – $153.90 area as minimum extension to finish (3) started from 6-September low. Alternatively, if it breaks below $143.57 low, it should extend ((iv)) before resuming higher in ((v)) to finish (3). Later, it should pullback in (4) in 3, 7 or 11 swings sequence and buyers expect to enter again from extreme areas to resume daily bullish sequence. Alternatively, if it extends higher and erase the momentum divergence, then it should turn out to be nest in (3) and see more upside.

Nvidia Daily UpdateNvidia Daily Update – We’ve broken out of a triangle pattern, and now the market is pulling back. If we see a breakout from the top of this pullback, it could present a strong entry point. My projected target for this move is the green level. Let’s keep a close watch on this setup!

Still counting this advance as an irregular (B) waveI have long stated that the upcoming earnings catalyst will develop into a sell event. When I last updated I was anticipating an incremental new high and possible double top for intermediate (B) into the confluence area of the larger and shorter term 100.0% fibonacci extension areas.
Although we have exceeded that area for a double top, we're still in the target box I had included on the chart. With the markets acting somewhat parabolic to the upside, I think it says volumes that the AI standard bearer has only marginally benefitted.
Next Wednesday will certainly be interesting. I am expecting price to make it's way down closer to $100 area...if not, then my alternative purple count is playing out and complete the larger wave I for a long term top in Nvidia.
Best to all,
Chris

Nvidia Bearish again! [S2]----------------------------------------------------------------------------------------------
***ALL ANALYSIS, SIGNALS, AND ANY CONTENT IS FOR EDUCATIONAL PURPOSES
ONLY AND ARE NOT MEANT TO BE PROFITED OFF.***
----------------------------------------------------------------------------------------------
I called the top last time, and now I call it again. Last time we hit TP1 and going towards TP2 but then the election interfered. Now lets see what will happen!
Nvidia is bearish once again, the TA remains the same. Got some bear flags showing along with bearish divergences. Also some custom indicators are pointing down as well.
Nvidia pumped and made a new high thanks to Donald J. Trump.
But I believe the FOMO in the market caused from the election is weaning down plus TA is point down too we should see a decent dump.
$146.50-$148.50
TP1: $142.93
TP2: $134.65
TP3: $131.75
Tight Stop Loss: $149.50
Good Stop Loss: $151.25
Loose Stop Loss:$154.50
----------------------------------------------------------------------------------------------
***ALL ANALYSIS, SIGNALS, AND ANY CONTENT IS FOR EDUCATIONAL PURPOSES
ONLY AND ARE NOT MEANT TO BE PROFITED OFF.***
----------------------------------------------------------------------------------------------

NVIDIA breakout to 190$After a 65$ price surge from April to June, NVIDIA was experiencing some consolidation in the range of 140S to 90$. The price broke out of this consolidation zone which formed a symmetric triangle pattern in mid October.
The next target price for NVIDIA is 65$ up from breakout point at 125$, which makes the price target of 190$. This target level coincides with Fibonacci extension level of 2.
We expect some resistance and sell off at this level, however, the company has huge potential and will probably break 190$ level after some consolidation.

Taiwan Semiconductor - Riding the Nvidia bullish waveNYSE:TSM has been on an uptrend and the recent correction has been a weak bearish downside, forming a bullish flag instead. Yesterday's bullish bar break above the flag has been confirmed and long-term MACD has been rising, supporting the long-term uptrend.
We believe that the stock is likely to continue to edge up higher in the longer-term. SHort-term target is at 230.00 while long-term we are eyeing beyond 280.00-300.00

NVDA Set to Make Waves: Big Levels Ahead!Update:
Good morning, trading family. Here to break this down nice and easy for you. Let’s ride the NVDA waves together:
1️⃣ First scenario: NVDA climbs to $154–$156. From there, it could either break higher or pull back to $150, maybe lower. Watch for a bounce if it dips.
2️⃣ Second scenario: A move to $168 is on the table, but expect a pullback to $164 before the next push higher. If the pullback goes deeper, it’s just a chance to reset.
3️⃣ Third scenario: If NVDA powers through all those levels, $179 is next, with a potential correction back to $168 along the way.
Mindbloome Trading/ Kris
Trade What You See

Navigating the Surge: Entry Now or Await a Pullback ?Overview: NVIDIA Corporation (NASDAQ: NVDA)
Current Price: $146.43 (as of November 7, 2024)
Sector/Industry: Technology / Semiconductors
NVIDIA has experienced a significant surge, reaching new highs. Investors are now contemplating: Is it prudent to enter at current levels, or should one wait for a potential pullback to optimize the risk/reward profile?
Key Levels and Price History
52-Week Range: $108.13 - $146.43
One-Month Range: $130.25 - $146.43
Support Level: $135.00
Resistance Level: $150.00
Upcoming Dates to Watch
Next Earnings Date: December 15, 2024
Dividend Payment Date: December 20, 2024
Ex-Dividend Date: December 5, 2024
Valuation and Metrics
P/E Ratio: 65.55 (above industry average)
Free Cash Flow:
Recent Quarter: $1.5 billion
TTM: $6 billion
Dividend Yield: 0.02%
Institutional Holdings: 70%
Short Interest: 3% of float
Recent Price Action & Technical Indicators
Weekly Trend: +5%
Monthly Trend: +10%
RSI: 68 (approaching overbought territory)
Moving Averages:
50-Day: $140.00
200-Day: $125.00
MACD: Positive divergence, indicating upward momentum
The RSI nearing overbought levels suggests caution, as a pullback may be imminent.
Comparative Valuation
P/E Ratio (NVDA): 65.55 vs. Industry Average: 30.00
P/B Ratio (NVDA): 20.00 vs. Industry Average: 8.00
EV/EBITDA (NVDA): 40.00 vs. Industry Average: 15.00
NVIDIA's premium valuation underscores its growth potential but also indicates higher risk if market sentiment shifts.
Growth & Financial Health
Revenue Growth (3-Year CAGR): 25%
Projected Revenue Growth (Next 2 Years): 20% annually
Debt-to-Equity Ratio: 0.3 (moderate leverage)
Cash Reserves: $10 billion
Current Ratio: 2.5
Notable News & Social Sentiment
News Highlight: November 6, 2024 – NVIDIA announced a strategic partnership with a leading cloud provider, boosting investor confidence.
Social Buzz: Positive discussions on platforms like Twitter and Reddit, with investors optimistic about NVIDIA's future prospects.
Competitive Comparison
Advanced Micro Devices, Inc. (AMD): $145.07, P/E 40.00, Revenue Growth 30%
Intel Corporation (INTC): $24.95, P/E 15.00, Revenue Growth 5%
Investment Analysis: Entry Now or Wait for a Pullback?
1. Entry at $146.43 (Current Price)
Target Price (TP): $160.00
Potential Upside: $160.00 - $146.43 = $13.57
Percentage Gain: ~9.27%
Stop Loss (SL): $135.00
Potential Downside: $146.43 - $135.00 = $11.43
Percentage Loss: ~7.80%
Risk/Reward Ratio: 9.27% (reward) / 7.80% (risk) ≈ 1.19
Entering at $146.43 offers a moderate risk/reward ratio, with potential gains slightly outweighing potential losses. However, the proximity to overbought RSI levels suggests a cautious approach.
2. Entry at $135.00 (Wait for Pullback)
Target Price (TP): $160.00
Potential Upside: $160.00 - $135.00 = $25.00
Percentage Gain: ~18.52%
Stop Loss (SL): $125.00
Potential Downside: $135.00 - $125.00 = $10.00
Percentage Loss: ~7.41%
Risk/Reward Ratio: 18.52% (reward) / 7.41% (risk) ≈ 2.50
Waiting for a pullback to $135.00 provides a more favorable risk/reward ratio, offering greater potential gains relative to potential losses. This strategy aligns with a more conservative investment approach.
Price Forecast Scenarios
Optimistic: $160.00 (assuming continued bullish momentum)
Neutral: $150.00 (aligning with current resistance levels)
Pessimistic: $125.00 (testing lower support levels)
Conclusion
NVIDIA's recent performance reflects strong growth and positive market sentiment.
Aggressive Entry (Today's Price, $146.43): Offers potential for short-term gains but carries higher risk due to near overbought conditions.
Conservative Entry (Pullback to $135.00): Provides a better risk/reward balance, ideal for those seeking a more cautious approach.
Verdict: While both strategies have merit, waiting for a pullback to $135.00 offers a more balanced entry point, allowing investors to capitalize on NVIDIA's growth potential with reduced risk.
Disclaimer: This analysis is for informational purposes only and does not constitute financial advice. Investing in stocks involves risk. Always conduct your own research and consult with a financial advisor before making any investment decisions. Use this information at your own risk; I am not responsible for any outcomes that do not align with expectations.

The 3 New Rules For Trading Nvidia StockIts been a long night i really feel
the night was very long and tiring.
I had a cup of coffee around 17 hours
Almost before the sunset.
I knew I should not drink coffee near
The sunset its a bad habit of mine.
I was trying to convince myself
that by the time
When the market closes I will have enough
energy to sleep
Of course, I will do a little exercise before
bedtime to help
With insomnia.
Watching the financial market can be a stress
especially if you
are doing it full-time like myself.
But with a system things become easier
The only challenge is in the
beginning because you have to develop this
mindset of always studying the market
And then finally once you know the market you
seem not to want to stop
This is why I have developed the 3 rules for
trading NASDAQ:NVDA
Rule 1:The price has to be above the 50 ma
Rule 2:The price has to be above the 200 ma
Rule 3:The price should gap up in a trend
Now I do love dip-buying stock prices
but sometimes you need a strategy that
can adapt to the market
this strategy is called the rocket booster
it will help you adapt to any market
like seriously
any market
This is the basis strategy for beginners
and experts
To learn more Rocket boost
this content
Disclaimer: Trading is risky you will
lose money whether you like it or not
Please learn risk management and profit-taking
strategies, Because you will lose money
whether you like it or not.

Nvidia Is Following This Simple 3 Step SystemThe time has come again for NASDAQ:NVDA
to shine again..you see it was
during the pandemic when This
stock started to shine..everyone was talking
about it...i still remember it
like yesterday..it was the A.I. Boom!!
It was crazy..people were buying
it and making money
It was crazy times..last week I saw Amazon
Hit new highs..
So this year Nvidia
is left behind but there's still hope
With this 3-step system
you can still hop on the Nvidia train
to profit taking.
The 3-step system is very simple
and yes it works.
Its as follows:
Step#1 - The price has to be above the 50 EMA
Step#2 - The price has to be above the 200 MA
Step#3 - The price has to gap up
Now on this chart, you will see
the William % This indicator
is an oscillator
Meant to show you whether the price
is undervalued or not
In this case, Nvidia is undervalued--meaning its
cheap this is why you won't hear about it
In mainstream media.
Because when the stock price is cheap no one talks about it
in mainstream media
In fact you may actually even
get huge backlash for recommending it
on mainstream media.
By the time the stock hits mainstream media
it's too late to profit from it am sorry
Anyway, if you want to learn more
rocket boost this content
Disclaimer: Trading is risky
please learn risk management and profit taking
strategies
because you will lose money whether
you like it or not.

NVDA (NVDL) BIG MOVE BREWING, BUY THE DIP! 100%+ MOVE INBOUNDNASDAQ:NVDA NASDAQ:NVDL
BIG MOVE BREWING, BUY THE DIP! 100%+ MOVE INBOUND
In this video, we discuss the following:
1.) My #HIGHFIVESETUP trading strategy which incorporates charting patterns, volume profiles, MACD, RSI, and TREND.
Notable recent winners with my strategies include NASDAQ:TSLA NASDAQ:SOFI NASDAQ:MBLY NASDAQ:AMZN NYSE:HIMS
2.) Go in-depth on how to tell when an investment or trade will go against you and what you should be looking for. We go over my favorite indicator for this, which is the Williams R%.
We primarily discuss the 2X levered ETF NASDAQ:NVDL which has the same setup as it's parent NASDAQ:NVDA . So feel free to use this setup for either one depending on your risk tolerance.
Thanks for all the support! Over 500 TV followers in such a short period of time, you all are amazing!
LIKE l FOLLOW l SHARE for more great content and analysis!
NFA

Nvidia [NVDA] Top is in!! [S #1]----------------------------------------------------------------------------------------------
**First off, I have not posted in a while but the good news is I plan to become active and post consistently!
I will be providing high quality signals, and only signals and analysis that I personally find worth showing. Any smaller less likely to succeed trades I will be avoiding.
This will be a new series of content, I will label posts depending on category:
= Signal (Expect clear and direct post, I will not be showing or explaining much of the TA)
= Educative Post (I will be showing my Technical Analysis (TA) and teaching how it works)
Since this is a new series of posts, I will label this post as the first signal (S #1)
----------------------------------------------------------------------------------------------
***ALL ANALYSIS, SIGNALS, AND ANY CONTENT IS FOR EDUCATIONAL PURPOSES
ONLY AND ARE NOT MEANT TO BE PROFITED OFF.***
----------------------------------------------------------------------------------------------
----------------------------------------------------------------------------------------------
Current Price which is $140,25 at market close, and $140.30 during the pre market.
It is already starting to dip a bit during the pre market!
This Signal is based from bearish divergences, price action, miscellaneous bear flags, and my special indicator.
$135.24
$127.87
$122.71
Tight Stop loss: $142.52
Good Stop loss: $144.50
Loose Stop loss: $146.20
----------------------------------------------------------------------------------------------
***ALL ANALYSIS, SIGNALS, AND ANY CONTENT IS FOR EDUCATIONAL PURPOSES
ONLY AND ARE NOT MEANT TO BE PROFITED OFF.***
----------------------------------------------------------------------------------------------

NVIDIA on the Move: Key Levels to Watch! NVIDIA’s setting up for some action: we’re looking at a run to $143.60, but if we break through, we could be cruising up to the $150–$153 range! On the flip side, if we slip below $129.72, brace yourself—$117 could be on deck. Let’s keep it simple and see how it plays out!"
Easy Breakdown for the Trade
Current Target: $143.60
Right now, NVIDIA’s aiming at $143.60. If buyers keep stepping in, this is the first level we’re likely to hit. Think of it as the “first checkpoint” for our bullish move.
The Bullish Range: $150–$153
Breaking past $143.60 could open up a fresh wave of momentum. If we get through this level with some energy, then NVIDIA could quickly head up to the $150–$153 range. This is the zone where we’d see if buyers are still strong, so keep it on your radar if we reach it.
Critical Support at $129.72
Now, here’s the key to the downside. $129.72 is the level holding NVIDIA up right now. If we lose this support, it’s a signal that sellers have taken control. This could mean a strong dip is in the works.
Downside Target: $117
If we break $129.72, the next realistic target to the downside is $117. It’s a significant drop, but definitely within range if support doesn’t hold.
Trading Tip
Mark your levels and watch for those breaks! $143.60 is our short-term target, and if we clear it, we’re looking up to $150–$153. But if NVIDIA slips below $129.72, $117 becomes a real possibility. Keep it flexible, and trade the levels!
Mindbloome Trading / Kris
Mindbloome Exchange

Nvidia So close to earnings report ! here is my analysis... In this chart, I haven't moved anything at all since my previous analysis of Nvidia. The price is making its natural movement just as we’ve been predicting.
As you can see, the last candle closed by bouncing off my order block and following the pattern of my forecast arrow.(yellow dotted arrow) Based on the price behavior, we can predict that as it gets closer to November 20 — the earnings report date — it will simply be accumulating.
Nvidia's last earnings reports have been phenomenal, and I don’t doubt that this report will be a trigger for the price to make a decision.
But for now, we’ll only see the price in a range until a few days before the report, when we’ll see those high-volume candles that will drive the price in a single direction.
Which direction? The one the report indicates.
Best regards!

NVDA lets go DOWNNASDAQ:NVDA
I would like to ask you to support me and subscribe to me on tg. The link is in the signature.
I continue to believe that the short on this stock will quite reach the lower values. Let's open shorts and take our profit soon.

NVDA Revving Engine UpA nice Consolidation over the last 2 weeks with declining Volume.
An easy move to 155-160 is imminent.
#nvda #NVIDIA #semis #chips #nasdaq

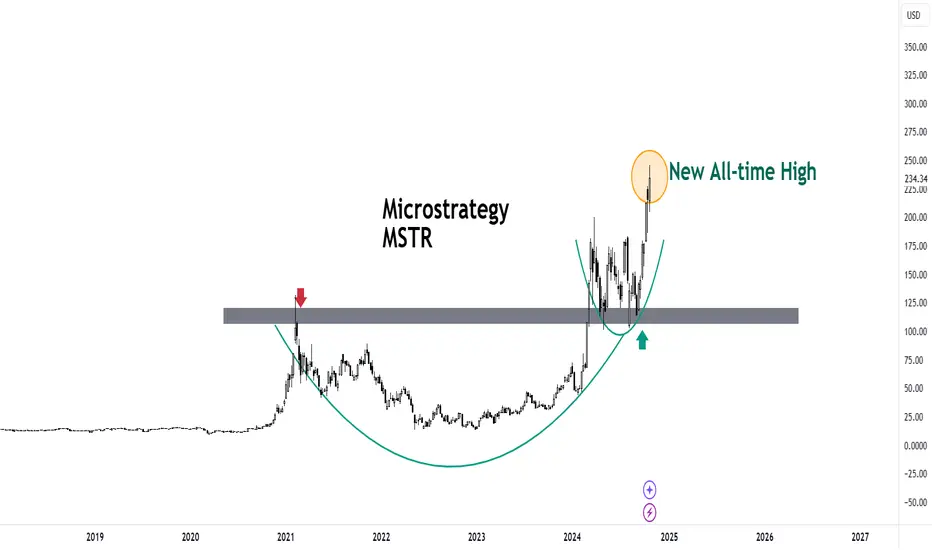
Since incorporating the Bitcoin StrategySince incorporating the Bitcoin Strategy, Michael Saylor has outperformed every single stock in the entire S&P500, including Nvidia. Big shoutout to him, well done sir.
NVIDIA Waiting for the big day !!!! Although we closed last week with a candlestick pattern called an 'Inside Candle,' the following candle was green, but it didn’t exceed the last high (see slanted yellow arrow).
Nvidia is stronger than ever, but that doesn’t mean the price won’t take a pause or make a small pullback before its report; rather, the price is likely entering an accumulation phase, as everyone expects Nvidia’s upcoming quarterly report to show excellent earnings results.
So my forecast for Nvidia is that it will fluctuate between my point of interest as resistance and the yellow order block as support, but the most important moment here will be its earnings report day—that’s when the price will make a decision and direction.
Thank you for supporting my analysis.
TRADE SAFE
Best regards!"

NVIDIA weekly and logHello,
A quick look at the past.
Well, it's been going up since 2012!
A short-term trend has resumed in the long-term trend as shown by the regression line channels.
The orange line represents the 200-period simple average.
Make your own opinion, before placing an order.
► Thank you for boosting, commenting, subscribing!

Take 40% profit and going downNASDAQ:NVDA
The stock has reached our target zone, bringing us a 40% profit.
For long-term holders – don’t sell; after a correction, it will generate more returns as it’s trending and set for further growth.
For swing traders, consider closing positions as a correction is likely to push prices down. I’ll give you a buy signal again afterward.

MicroStrategy's Bullish Run: A Closer LookMicroStrategy, a business intelligence company, has been making significant strides in the cryptocurrency market, particularly with its substantial Bitcoin holdings. The company's market capitalization is inching closer to that of Coinbase, a major cryptocurrency exchange. This surge in valuation has sparked interest and speculation among investors and analysts alike.
A Strategic Bitcoin Bet
MicroStrategy's aggressive Bitcoin buying strategy, spearheaded by CEO Michael Saylor, has positioned the company as a major player in the cryptocurrency space. The company's belief in Bitcoin's long-term potential as a store of value and a hedge against inflation has driven its decision to allocate a significant portion of its treasury to the cryptocurrency.
This strategic move has paid off handsomely, as Bitcoin's price has soared recently. As a result, MicroStrategy's stock price has also experienced substantial growth, attracting the attention of investors seeking exposure to the cryptocurrency market without directly owning Bitcoin.
Market Cap Milestone Looms
With its market capitalization steadily rising, MicroStrategy is on the cusp of a major milestone: overtaking Coinbase's market cap. At the time of writing, MicroStrategy is just $3.9 billion away from achieving this feat. This would be a significant achievement for a company that was once primarily known for its business intelligence software.
Factors Driving MicroStrategy's Success
Several factors have contributed to MicroStrategy's impressive performance:
1. Bitcoin's Price Appreciation: The continued rise in Bitcoin's price has directly benefited MicroStrategy, as the company's Bitcoin holdings have increased in value.
2. Institutional Adoption of Bitcoin: Growing institutional interest in Bitcoin has legitimized the cryptocurrency and increased its appeal to mainstream investors.
3. MicroStrategy's Strong Balance Sheet: The company's solid financial position has enabled it to weather market volatility and continue its Bitcoin accumulation strategy.
4. Investor Confidence in Michael Saylor's Vision: Saylor's unwavering belief in Bitcoin and his ability to execute on his strategy have instilled confidence in investors.
Technical Analysis: A Bullish Outlook
Technical analysis of MicroStrategy's stock chart reveals a bullish trend. The stock has been forming higher highs and higher lows, indicating a strong uptrend. Additionally, the recent surge in trading volume relative to Nvidia, a tech giant, suggests increased investor interest and potential for further price appreciation.
The MicroStrategy stock-to-BTC ratio has also hit an all-time high, surpassing the levels seen during the 2021 bull run. This indicates that investors increasingly value MicroStrategy's Bitcoin holdings, which could further drive the stock price higher.
Potential Risks and Challenges
While MicroStrategy's future looks promising, it is important to acknowledge the potential risks and challenges that could impact the company's performance:
1. Bitcoin Price Volatility: Bitcoin's price is highly volatile, and any significant decline could negatively impact MicroStrategy's valuation.
2. Regulatory Uncertainty: Changes in cryptocurrency regulations could create uncertainty and hinder the company's operations.
3. Competition from Other Bitcoin-Focused Companies: Other companies may emerge as strong competitors, challenging MicroStrategy's dominance in the Bitcoin investment space.
Conclusion
MicroStrategy's impressive performance and its strategic focus on Bitcoin have positioned it as a major player in the cryptocurrency market. As the company continues to execute its strategy and benefit from Bitcoin's long-term growth potential, its market capitalization could surpass that of Coinbase, marking a significant milestone. However, investors should be mindful of the inherent risks associated with cryptocurrency investments and conduct thorough research before making any investment decisions.

We can extend into the Target Box, But below $128.73 = $95 BucksNvidia has arrived in the target box for our intermediate (B) wave high. Can we extend in the target box? Yes.
However, two things are top of mind to this analyst.
1) The earnings catalyst mid-November is a "keep hope alive event". Therefore, I do not see big trader commitments prior to that. If we go up further into the target box...it will be an overlapping grinding pattern. I see the earnings catalyst as positive fundamentally, but a technical sell event.
2) If price breaches $128.74...that should yield us $95.
If this is how the price action plays out...then at $95, you would do well consider NVDA longs.
Best to all,
Chris
