Nvidia - The correction just started!💉Nvidia ( NASDAQ:NVDA ) is now heading lower:
🔎Analysis summary:
Just recently, Nvidia once again retested the major rising channel resistance trendline. Together with November's bearish engulfing candle, Nvidia is slowly shifting bearish. And before Nvidia will retest the next major support area, we can see a drop of another -15%.
📝Levels to watch:
$150
SwingTraderPhil
SwingTrading.Simplified. | Investing.Simplified. | #LONGTERMVISION
Nvidia

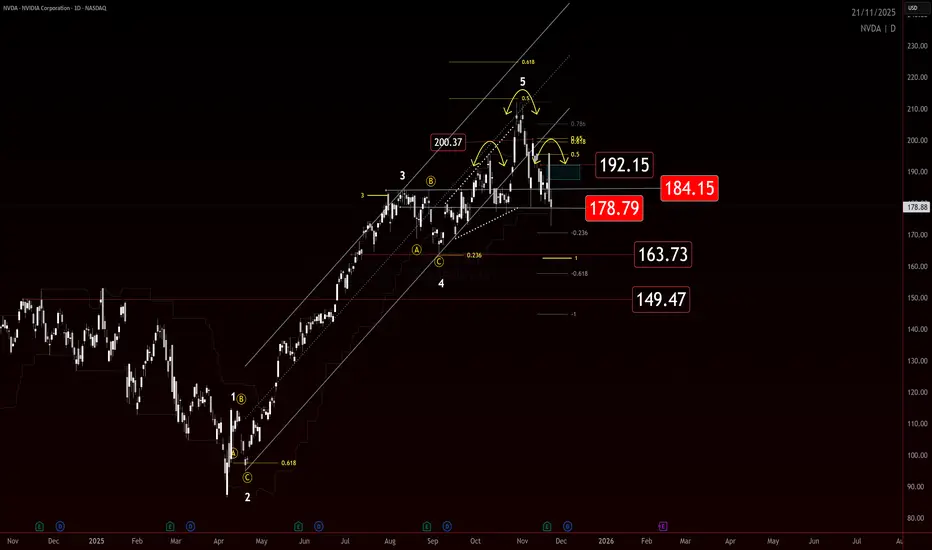
NVIDIA This is how it can reach $100 and the Supports involved.NVIDIA Corporation (NVDA) had a strong red 1M candle last month, the first one after a rally of 7 straight green months. This is not the first time we present you this 12-year Channel Up, in fact we used this in late October to give a sell signal.
The reason is that Nvidia almost reached the top of that pattern, a technical Higher High, successive if you count the late 2024 one. Such Double Tops have been previously consistent with the start of strong corrections (Bearish Legs) which in both cases (2018 and 2022) bottomed on the 1W MA200 (orange trend-line).
The key element that we added on the chart this time is the (green) Support Zone, which stemmed every time from the last consolidation (blue circle) before the Top.
It is no surprise that this time it also falls on the 1W MA200 and a potential contact with the price towards Q3 2026 and beyond. Even then, it will still be above the 0.382 Fibonacci retracement level as in December 2018 and quite close to the bottom of the Channel Up for the first time since October 2022.
Our long-term Target and thus next long-term Buy Signal, remains $100.
---
** Please LIKE 👍, FOLLOW ✅, SHARE 🙌 and COMMENT ✍ if you enjoy this idea! Also share your ideas and charts in the comments section below! This is best way to keep it relevant, support us, keep the content here free and allow the idea to reach as many people as possible. **
---
💸💸💸💸💸💸
👇 👇 👇 👇 👇 👇

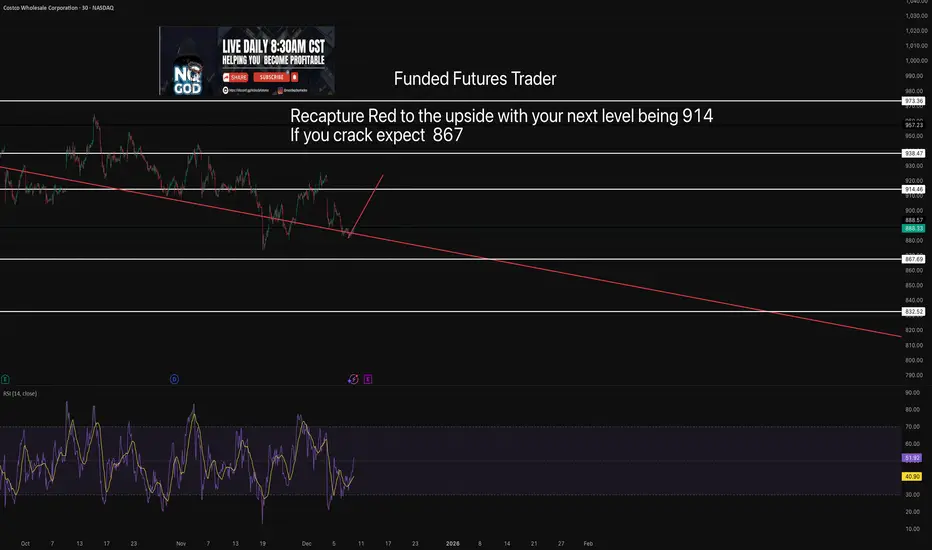
Costco Levels with TAPretty clear recapture red and youll grind to the upside if you don't you have your red to the downside which is a magent.
NIKE SHORT TRADING PLANI am shorting Nike because its long-term trend is downward, and the lower line represents a support level. I’m also basing my short position on RSI signals.

Nvidia (NASDAQ: $NVDA) $2B Synopsys Bet Reshapes AI’s FutureNvidia’s recent $2 billion investment in Synopsys signals one of the company’s most strategic and transformative moves in the AI and semiconductor race. The purchase—completed at $414.79 per share for a 2.6% stake—pushes Nvidia deeper into the core infrastructure that powers advanced computing, chip design, and the next generation of AI hardware.
While mainstream attention often focuses on AI chatbots, consumer apps, and model breakthroughs, Nvidia’s Synopsys stake shows a different priority: controlling the foundational technologies that make AI possible. Synopsys is one of the world’s most critical companies in electronic design automation (EDA), providing the tools used to design semiconductors, aerospace systems, and highly complex digital architectures. By aligning with Synopsys, Nvidia effectively plugs into the heart of global chip innovation.
Experts suggest this isn’t merely a passive financial investment—it’s a strategic partnership aimed at accelerating breakthroughs in AI-optimized chips, automation tools, and silicon-level performance. With Nvidia already dominating GPU computing, securing influence within Synopsys strengthens its command over the entire AI hardware pipeline, from design to deployment.
This move also positions Nvidia ahead of rivals as the semiconductor landscape becomes increasingly defined by custom silicon, automated chip design, and hardware-accelerated AI systems. A deeper integration between both companies could unlock new workflows where AI models help design better chips—and those chips, in turn, train better AI models.
While media narratives often revolve around front-end AI products, Nvidia’s quiet focus on infrastructure reveals its long-term strategy: build, own, and optimize the invisible technological backbone of the AI revolution. With Synopsys now in its orbit, Nvidia is not just participating in the future of AI—it’s helping engineer it.
Technical analysis
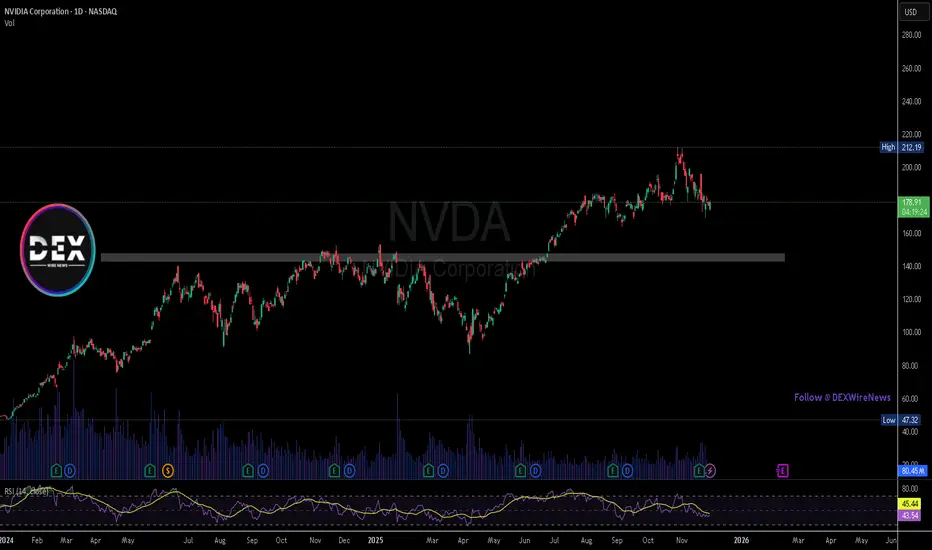
Nvidia (NASDAQ: NVDA) is bouncing from a key demand zone after pulling back from the $212 resistance area. Price is reclaiming short-term momentum as it holds above the major support region around $145, which previously acted as a strong accumulation zone. As long as NVDA maintains support above this level, the structure favors a continuation toward the $200+ range, with $212 remaining the next major hurdle. A breakdown below $145 would open room for a deeper correction, but current price action signals buyers are defending the trend.
NVDA — WEEK 49 TREND REPORT | 12/03/2025NVDA — WEEK 49 TREND REPORT | 12/03/2025
Ticker: NASDAQ:NVDA
Timeframe: WEEKLY
This is a reactive structural classification of NVIDIA based on the weekly chart as of this timestamp. Price conditions are evaluated as they stand — nothing here is predictive or forward-assumptive.
⸻
1) Current Trend Condition [ Numbers to Watch ]
• Current Price @ 180.26$
• Trend Duration: +31 weeks (Bullish)
• Trend Reversal Level (Bullish): 190.87$
• Trend Reversal Level (Bearish Confirmation): 176.52$
• Pullback Support : 167.75$
• Correction Support : 132.86$
⸻
2) Structure Health
• Retracement Phase:
Pullback (approaching 78.6%)
• Position Status:
Caution (interacting with structural layers)
⸻
3) Temperature :
Cooling Phase
⸻
4) Momentum :
Coiling
⸻
5) Market Sentiment
Bullish
⸻
Author’s Note
This analysis is fully reactive, not predictive. Market conditions, trend structure, and behavior are classified as they appear in real time. The objective is to identify where directional shifts first occurred, where structural integrity remains intact, and where it would begin to weaken if key levels were breached.
Predictive analysis projects outcomes that do not exist yet. Without price confirmation, prediction is built on baseless assumptions. This framework avoids that entirely by responding only to verified structural changes and live conditions.
The levels shown simply identify where the current trend structure first shifted and where it would begin to lose integrity if breached. Recognizing these boundaries allows for clearer interpretation of market behavior without relying on forward guarantees, speculative projections, or unsupported assumptions.
⸻
Methodology Overview
This classification framework evaluates directional conditions using internal trend-interpretation logic that references price behavior relative to its structural layers. These relationships are used to identify when price movement aligns with the framework’s criteria for directional phases, transition points, or regime shifts. Visual elements or structural labels reflect these internal interpretations, rather than explicit trading signals or preset indicator crossovers. This framework is observational only and does not imply future outcomes.

Nvidia - Now is the time to go short!💣Nvidia ( NASDAQ:NVDA ) is now creating a top:
🔎Analysis summary:
Just a couple of days ago, Nvidia perfectly retested a major resistance trendline. Always in the past, such a retest was followed by a major move towards the downside. Therefore, Nvidia is preparing for a major drop, which could lead to another -25% drop in the future.
📝Levels to watch:
$180 and $140 and $100
SwingTraderPhil
SwingTrading.Simplified. | Investing.Simplified. | #LONGTERMVISION

$NVDA - $140 Target - Short Position - AI Bubble About to BurstIn my opinion, Nvidia does not have much to continue the next needed support for a pro-longed bull run, at least in terms of sentiment. The AI bubble has gone on for too long and the actual multiples of valuations in comparison to revenue and profit generations do not seem to have strong support when considering traditional investing strategies. Also, the next wave seems getting closer and closer to a red trend. Retracement potential is possible after hitting $140, but Nvidia needs to do far more benefit for the public good and have a differentiation that doesn't rely on trends such as crypto mining and the boost of LLMs. As always, none of this is investment or financial advice. Please do your own due diligence and research.
Hewlett Packard Enterprise Expands AI With NVIDIA-Powered LabHewlett Packard Enterprise (NYSE: HPE) has strengthened its position in the global AI infrastructure race with a major announcement: the launch of an AI Factory Lab in Grenoble, France, built in partnership with NVIDIA. The facility is designed to let enterprises test sovereign AI systems inside the European Union—an increasingly important requirement as governments tighten rules around data security, residency, and compliance.
The lab will run on a full stack of NVIDIA AI Enterprise software, HPE servers, NVIDIA accelerated computing, and Spectrum-X Ethernet networking. With demand for sovereign AI rising across Europe, the new lab gives enterprises a secure environment to validate workloads before deployment. The site is slated to open in Q2 2026, positioning HPE as a leader in regulatory-aligned AI infrastructure.
HPE’s news extended beyond the lab launch. The company upgraded its Private Cloud AI platform, adding support for NVIDIA RTX PRO 6000 Blackwell Server Edition GPUs and integrating STIG-hardened and FIPS-enabled configurations for air-gapped environments. Fractional GPU support through NVIDIA Multi-Instance GPU (MIG) technology brings cost-efficient scaling to private AI clusters.
Another key reveal was the HPE Alletra Storage MP X10000 Data Intelligence Nodes, powered by NVIDIA acceleration to analyze and process data inline. These nodes will be available for order in January 2026. HPE also rolled out the NVIDIA GB200 NVL4 system, offering up to 136 GPUs per rack and now available to order.
New partnerships with CrowdStrike, Fortanix, and Carbon3.ai add security and confidential computing layers, with HPE supporting a new Private AI Lab in London. The company emphasized that sovereign AI solutions are available today with country-specific compliance frameworks.
Technical View
HPE remains in a bullish structure despite retracing from its recent $26 high. Price is pulling back toward $18, a likely support area. Holding above this zone keeps the broader uptrend intact.

NVDA long-term TANvidia is still keeping up the long-term uptrend but the mid-term is currently in distribution since the last couple of weeks, so let the news won't surprise you, it's healthy for Nvidia to fall lower and that's what it been doing recently. Some time is needed for Nvidia to bottom out, while long-term remains bullish, the mid-term is yet bearish.

Nvidia ($NVDA) Stock: $2B Synopsys Deal Expands AI Design PowerNvidia has taken another major step to secure its dominance in AI infrastructure by investing $2 billion in Synopsys, one of the world’s leading chip design software companies. The investment instantly makes Nvidia one of the top shareholders and deepens the long-term collaboration between the two firms. The deal strengthens Nvidia’s control over key parts of the AI value chain, from hardware to software tools used in designing new chips across multiple industries.
This partnership gives Synopsys access to Nvidia’s advanced developer tools and GPU-accelerated libraries to boost its electronic design automation (EDA) processes. These improvements aim to speed up chip development cycles at a time when demand for advanced AI hardware continues to surge. For Nvidia, the move ensures it stays positioned at the center of AI innovation and benefits financially from the growth of the entire ecosystem—not just from selling GPUs.
The timing also matters. Synopsys recently reported weakness in its intellectual property segment due to export restrictions tied to China and slower activity from a major foundry customer. Nvidia’s investment restores confidence in Synopsys' long-term outlook while offering Nvidia a strategic foothold in the tools that design the chips running global AI infrastructure.
Technical Analysis
Nvidia’s overall trend remains bullish despite a slight pullback. Price currently trades around $178, holding above a key support zone at $145, which becomes the level to watch if broader tech stocks weaken. Upside momentum resumes if price pushes toward the $212 resistance area—its previous major high. A confirmed breakout above $212 would signal continuation of the broader bullish structure.
With a strong fundamental catalyst and firm long-term trend, Nvidia remains one of the leading names powering AI’s next wave.
NVDA to $170? AI Bubble Risk, Big Money Exits & Heavy Shorts !I f you haven`t bought NVDA before the previous earnings:
Now you need to know that NVIDIA has dominated 2023–2025, becoming the face of the global AI boom. But the higher the climb, the harder the fall. While NVDA is still seen as “untouchable,” several major signals suggest the stock could revisit levels near $170 — a healthy correction of 10–15% from here.
1. Major Investors Are Exiting — SoftBank Dumped Everything
SoftBank, one of Nvidia’s earliest and most influential institutional backers, sold its entire stake in late 2025, worth roughly $5.8 billion.
Smart-money exits near all-time highs should never be ignored.
SoftBank rarely sells unless it believes:
- the sector is overheated
- the valuation has run too far
- risk/reward becomes asymmetric
This mirrors their strategy in 2021–2022 when they unloaded overvalued tech before the correction.
SoftBank’s full exit is a red flag for anyone ignoring the possibility of an AI bubble.
2. Michael Burry Bought Massive Puts — A Direct Bet Against the AI Mania
Michael Burry — famous for predicting the 2008 crisis — has quietly increased his put positions on NVIDIA and other AI names.
Why does this matter?
Because Burry doesn’t short “normal” overvaluations.
He shorts bubbles.
His AI thesis:
- expectations are unrealistic
- revenue growth is priced as infinite
- companies are spending billions on AI with no short-term monetization
- chip demand could normalize faster than markets expect
When a contrarian with Burry’s track record bets against a trend, it’s worth paying attention.
3. NVIDIA’s Valuation Is Stretched Even for a Hyper-Growth Company
Even bulls agree: NVDA’s multiples are once again aggressively priced.
Key issues:
• Price-to-Sales historically elevated
NVDA is trading at a P/S ratio that would be insane for any company approaching a $5 trillion market cap.
• Revenue growth expectations assume perfect long-term AI adoption
If AI monetization slows or plateaus even slightly, NVDA’s valuation collapses fast.
4. Are We in an AI Bubble? Many Indicators Say Yes
Top analysts, academics, and even bullish investors admit:
AI has bubble-like behavior.
Evidence of a bubble:
- Stock prices rising faster than actual earnings growth
- Companies buying GPUs “because everyone else is doing it”
- Zero clarity on monetization for many AI firms
- AI startups valued at billions with no revenue
- Media hype similar to 1999 dot-com sentiment
Harvard Business Review, Wired, and Investopedia already discuss the “AI bubble thesis.”
If AI expectations don’t materialize fast enough, NVDA becomes the single most vulnerable stock on the market.

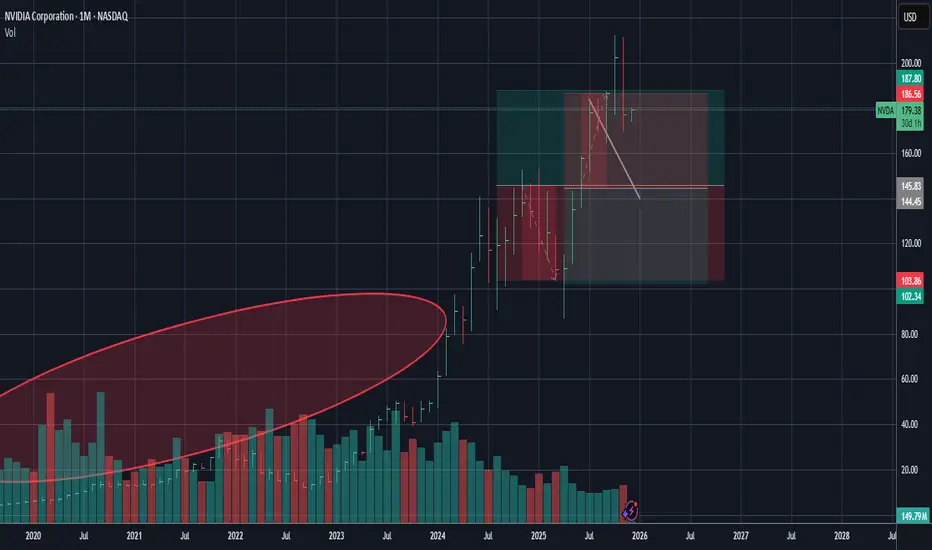
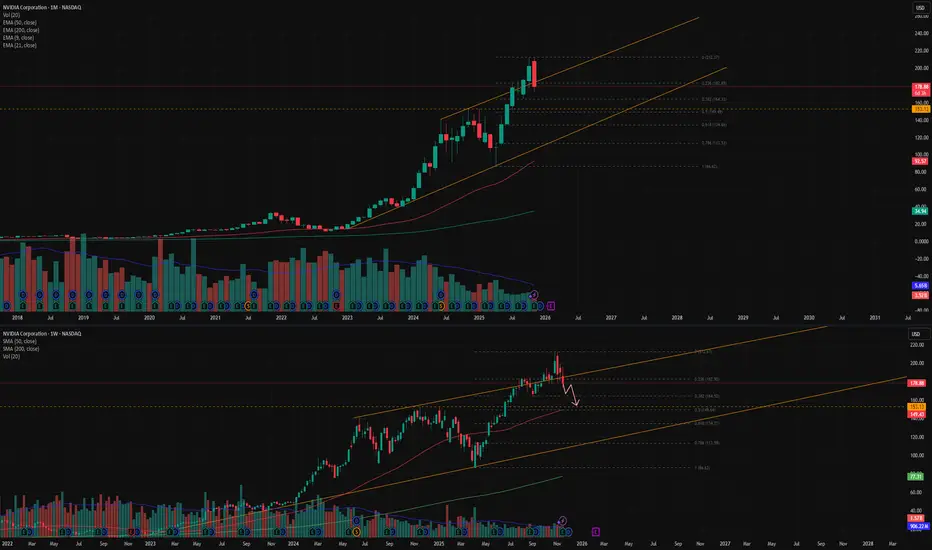
NVIDIA Trading plan from $100 to $1000. Is it plausible?Exactly a month ago, we called the end of the rally on NVIDIA Corporation (NVDA), essentially the end of its multi-year Bull Cycle and the beginning of an aggressive Bear Cycle correction.
** The 10 year Channel Up **
So far this is paying dividends as the stock just completed a 4-week red streak. The essence of NVIDIA's trend has been a decade long Channel Up, as you can see on this chart and that's the basis of all the buy entries and sell exits we've made over the years.
** Bull and Bear Cycles **
Since early 2025, the stock started that Channel Up, whose first Bull Cycle (as well as the next ones with the exception of one breaking) was supported by the 1W MA50 (blue trend-line). Once that Bear Cycle (in the form of the Channel's Bullish Leg) ended, the subsequent Bear Cycle (Bearish Leg) broke below both the 1W MA50 and 1W MA100 (green trend-line) and bottomed exactly on its 1W MA200 (orange trend-line), marginally above the 0.382 Fibonacci retracement level.
The following Bull Cycle as well as the Bear Cycle followed the same structure only, the bottom was this time marginally below the 0.382 Fib. Then the Bull Cycle that just ended started, with only basic difference that its early 2025 correction broke below the 1W MA50 but found Support on the 1W MA100. Every Bull Cycle had such pre-Top correction (blue ellipse). Note also that this last Bull Cycle as been the strongest Leg on +1881% rise and the one before it, the 'weakest' at +1004%.
** The RSI **
Notice also that the 1W RSI has made the same Double Top rejection pattern on the Lower Highs Zone that both previous Bull Cycle Tops did. Strong confirmation therefore of the emerging Bear Cycle.
** The next bottom **
Technically, we expect the market to bottom yet again on the 1W MA200, which by a fair projection of its current trajectory, we expect that to be around $100. That would still be considerably above the 0.382 Fib, which can only get hit if the Bear Cycle falls very aggressively. Note here that historically within this Channel Up, the most optimal buy signal was given when the 1W RSI hit 42.00. Use that in combination with the 1W MA200.
** Future Targets **
So after the Bear Cycle bottoms, what Target can we pursue? Well the 'minimum' projection based on the 2.618 Fibonacci extension of the Bull Cycle that just ended is $700. At the same time, if it rises by again the 'minimum' % of the weakest +1004% Bullish Leg of the Channel, we are looking potentially at a 4-year Target of $1100. It is also worth noting the valuable use of the Sine Waves that have so far accurately grasped the peak formations of the Bull Cycles. We can use this to time our market exits in 2029.
Realistic or not subjectively, the $100 to $1000 path is what the pure technicals and historical data support and clearly show is a very likely probability for a long-term investment.
---
** Please LIKE 👍, FOLLOW ✅, SHARE 🙌 and COMMENT ✍ if you enjoy this idea! Also share your ideas and charts in the comments section below! This is best way to keep it relevant, support us, keep the content here free and allow the idea to reach as many people as possible. **
---
💸💸💸💸💸💸
👇 👇 👇 👇 👇 👇

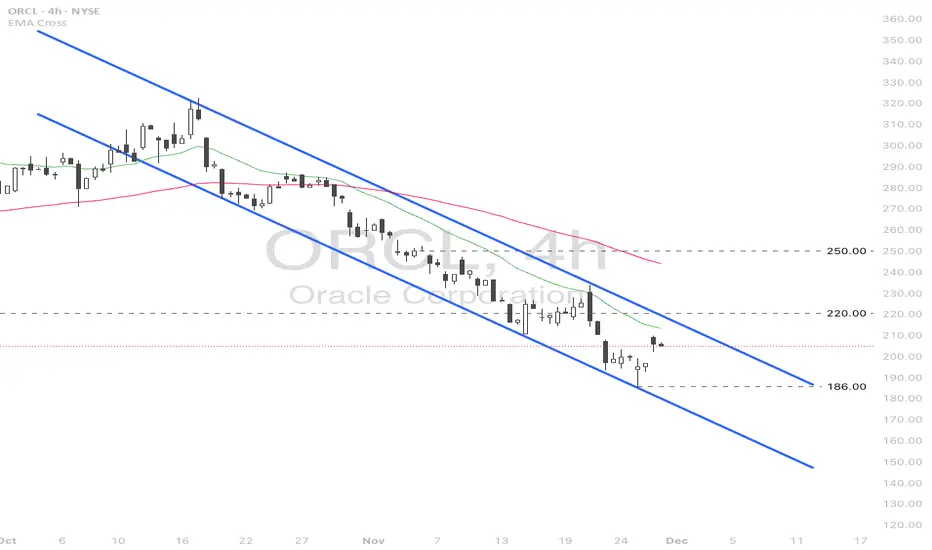
Oracle (ORCL) rebounded on renewed AI momentum.
Surging Alphabet (GOOGL) and revived Nvidia (NVDA) stock prices are leading the AI momentum. Oracle (ORCL), which fell over 40% from its high on amplified doubts over its 300 bln USD computing contract with OpenAI, saw a rebound.
Deutsche Bank assessed the drop in ORCL stock as providing an attractive entry point. They valued the current price as reflecting no positives, citing EPS (ex-OpenAI costs) at 17 USD and FCF at 31 bln USD, both below company guidance.
HSBC also issued a Buy rating on ORCL, expecting various financing strategies for data center costs to be announced, thereby mitigating balance sheet burden and diversifying risk.
ORCL briefly tested the 186.00 low before slightly rebounding. The price remains within the descending channel and below the bearish EMAs, indicating the potential downtrend extension. If ORCL breaches above EMA21 and 220.00, the price could advance toward the next resistance at 250.00.
Conversely, if ORCL fails to close above EMA21, the price may retreat toward the following support at 186.00.
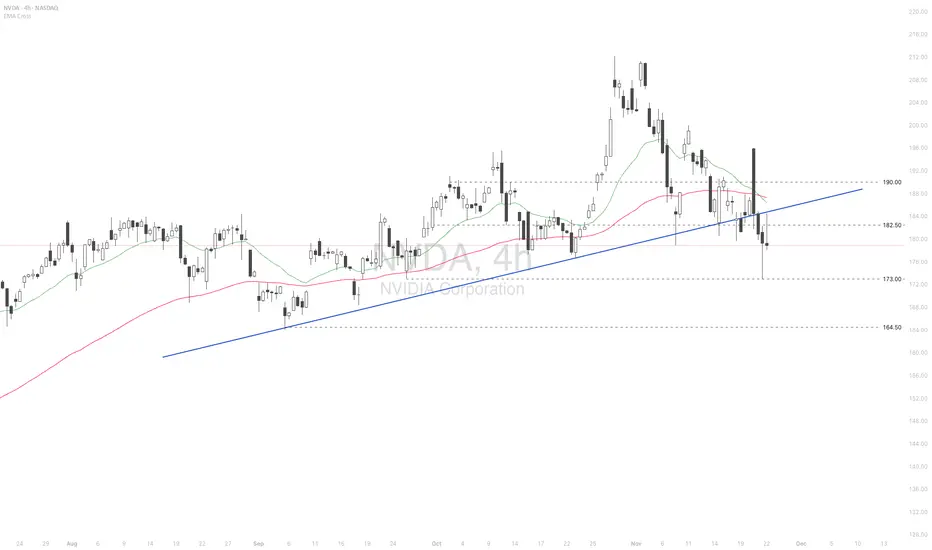
Nvidia plummeted amid the threat of competition from GOOGL
Optimism surrounding the Gemini 3 and news that Alphabet (GOOGL) will internally supply its TPUs to Meta Platforms (META) supported the AI rally. On the other hand, Nvidia (NVDA) experienced a significant decline due to concerns over the potential GOOGL threat.
Mizuho noted that the "Google wins, OpenAI/Nvidia loses" trade is gaining traction, accelerating the sell-off in OpenAI-related stocks like NVDA and Oracle (ORCL).
Meanwhile, the US administration's decision regarding the allowance of NVDA's H200 chip sales to China remains a potential positive catalyst for future NVDA stock prices.
NVDA briefly fell below the support at 173.00 after breaking below the ascending trendline. Diverging bearish EMAs indicate a potential extension of the downtrend.
If NVDA breaks below 173.00 again, the price could further decline to the next support at 164.50.
Conversely, if NVDA closes above 182.50, the price may advance toward the following resistance at 190.00.

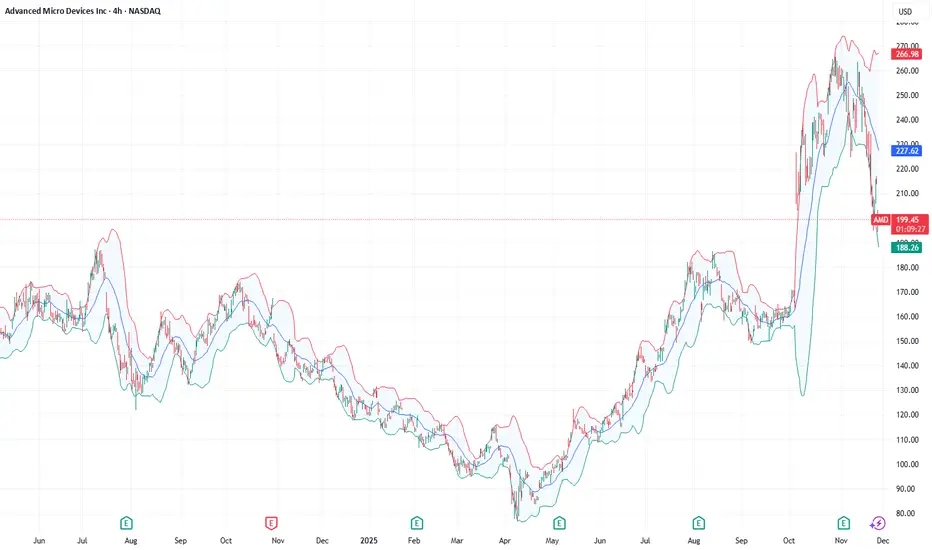
Tech giants and a crypto exchange under pressure!Recently, the stocks of Advanced Micro Devices (#AMD), Coinbase Global Inc. (#Coinbase), Oracle Corp. (#Oracle), NVIDIA Corp. (#NVIDIA), and Arm Holdings plc (#Arm) have come under pressure amid a reassessment of artificial intelligence (AI) valuations and growing caution toward risk assets. Investors are reacting nervously to the cost of capital, the pace of AI monetization, and the resilience of demand within adjacent ecosystems.
5 Factors Behind the Decline:
#AMD (−10.33%) — profit-taking after a strong rally and growing doubts about the scalability of server GPUs. Additional pressure comes from margin risks driven by aggressive capital spending and competition in high-performance GPU accelerators.
#Coinbase (−10.31%) — a weakening crypto market reduces trading volumes and fee revenue. Regulatory risks and volatile client flows deepen the valuation discounts.
#Oracle (−10.29%) — concerns over rising debt levels amid heavy investments in cloud and AI infrastructure. The market fears shrinking free cash flow and pressure on valuation multiples if growth slows.
#NVIDIA (−4.08%) — “overvaluation + maxed-out expectations”: even strong earnings reports fail to calm concerns about cyclical demand in data centers. Added to this are risks of margin normalization and potential inventory build-ups among customers.
#Arm (−3.02%) — high sensitivity to sell-offs in the “AI sector,” especially given its premium valuation. Investors question how quickly the royalty-based model can translate into stable accelerated growth.
If concerns about AI-related spending and uncertainty around interest rates persist, stocks inflated by AI and crypto market expectations may continue to fall. Further capital outflows or rising borrowing costs would serve as triggers for additional downside.
FreshForex analysts see potential for a correction in #AMD, #NVIDIA, #Arm, #Oracle, and #Coinbase due to slowing AI infrastructure growth and persistently high capital costs. For #Coinbase , elevated crypto market volatility is an additional pressure factor. The current market situation creates conditions for developing scenarios for asset price declines.
Analysis of the Nvidia (NVDA) Share ChartAnalysis of the Nvidia (NVDA) Share Chart
Last week, we published a post titled “Ahead of Nvidia’s (NVDA) Earnings: How the Price Could Move”, in which we:
→ Drew an ascending channel (shown in blue);
→ Suggested that market participants’ overly high expectations would likely not be met when earnings were released, leading to a decline in NVDA’s price towards the lower boundary of the ascending channel, where support lies at $165.
In reality, the earnings report turned out to be very strong:
→ Gross revenue: actual = $57bn, forecast = ~$54.9bn.
→ Earnings per share (EPS): actual = $1.30, forecast = $1.26 (previous quarter = $1.05).
The surge in price with a bullish gap towards point A reflected the initial reaction to the strong figures, but the share price then began to fall (reaching a two-month low), thereby confirming our expectations.
Technical Analysis of the Nvidia (NVDA) Chart
An analysis of NVDA’s price action suggests that the current situation can be viewed as a correction (shown with red lines), forming within an expanded ascending channel.
If NVDA’s share price declines towards the $165 level, where the lower boundary of the channel lies, this could encourage the bulls to attempt to resume the 2025 uptrend and mount a new push towards the psychological $200 mark.
This article represents the opinion of the Companies operating under the FXOpen brand only. It is not to be construed as an offer, solicitation, or recommendation with respect to products and services provided by the Companies operating under the FXOpen brand, nor is it to be considered financial advice.

Nvidia loses steam despite exceptional 3Q performance
Nvidia (NVDA) posted a record-breaking 3Q performance, with revenue surging 62% YoY to 57 bln USD. Its 4Q guidance points to another 65% increase, reinforcing optimism that growth momentum will continue to accelerate. CFO Kress noted that the guidance does not include any contribution from China sales, while CEO Huang pushed back against recent AI-bubble concerns raised by Michael Burry.
Nevertheless, AI valuation risks remain elevated. Beyond strong earnings, the scale of AI infrastructure spending and the surge in bond issuance required to fund it continue to dampen investor sentiment.
Goldman Sachs (GS) has warned about the fragility in the private credit market. The firm highlighted that Blue Owl Capital, with more than 295 bln USD in AUM, over half of which is credit-exposed, has seen its share price fall nearly 30% since Sep. Major credit-heavy players such as KKR and Blackstone are also showing signs of pressure, underscoring how AI-driven anxiety is spilling into private credit.
NVDA briefly breached above the psychological level at 195.00 but surrendered all gains, falling back below 182.00. The price remains under the death-crossed EMAs, indicating a potential expansion of the bearish bias.
If NVDA breaks below the support at 173.00, the price could decline further toward the following support at 164.50.
Conversely, if NVDA breaches above the resistance at 182.50 and the ascending trendline, the price may advance toward the subsequent resistance at 190.00.
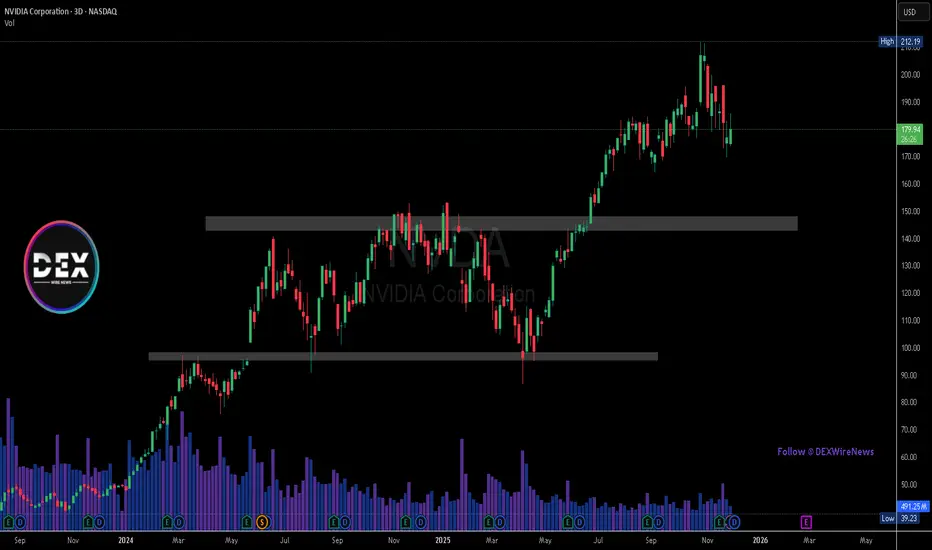
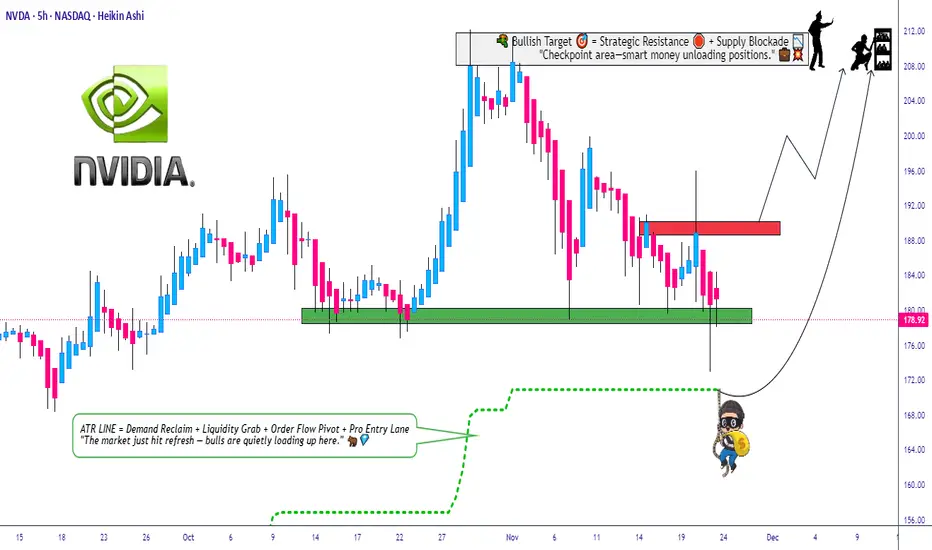
Can NVDA Hold the Pullback Zone and Extend the Uptrend?🔥 NVDA Bullish Pullback Playbook – Thief-Style Swing Setup 🚀🕵️♂️
Hey traders & my fellow Thief OG’s 😎🕶️ — here’s a clean, polished, TradingView-friendly version of my NVDA Swing Trade Playbook with a professional + funny touch. Let’s get to the setup 👇🔥
📌 Asset
NVDA – NVIDIA Corporation (NASDAQ)
Swing Trade | Momentum | Trend-Following Setup
📈 Plan: Bullish Pullback Strategy (Pending Orders Active)
The trend is strong, the buyers are steady, and NVDA is still delivering clean higher-lows. We're waiting for either a breakout continuation or a discounted pullback entry. 📊⚡
🎯 Entry Zones
1️⃣ Breakout Entry – Momentum Thief Mode 🥷⚡
Enter after clearing the nearest resistance at $191.00
• Clean breakout
• Volume confirmation
• Trend continuation strength
2️⃣ Pullback Entry – SuperTrend ATR Sniper Entry 🎯📉
Watch for a discounted pullback near $170.00 around the SuperTrend ATR zone.
• Trend support retest
• Lower-risk entry
• Ideal for swing traders who wait for “patience-pays entries” 😎
🛡️ Stop-Loss (Thief Style – Risk First)
Breakout Entry SL → $180.00
SuperTrend Pullback SL → $160.00
Note: Dear Ladies & Gentlemen (Thief OG’s) ❤️
I’m NOT recommending you use only my SL. Choose your own levels — you make the money, you protect the money. Trade at your own risk 🔐⚠️
🎯 Target (Take-Profit Zone)
Our target → $210.00
Why?
• Strong resistance zone
• Overbought region historically
• Buyer trap zone where police force 🚔👮♂️ usually waits — so escape with profits early 😂💨
Note: Dear Ladies & Gentlemen (Thief OG’s) 🙌
I’m NOT recommending you set my TP only. Choose your own TP — your money, your exit. Trade with responsibility 💼💰
🔍 Related Pairs to Watch (Correlation Insights + Key Notes)
NASDAQ:AMD
• High positive correlation with NVDA
• When AMD shows volume expansion, NVDA often follows
• Good for momentum confirmation 🔥
NASDAQ:SOXX (iShares Semiconductor ETF)
• NVDA is a major weighted component
• ETF direction confirms big-money flow 🧠💸
• Great for spotting sector-wide risk-on / risk-off shifts
NASDAQ:QQQ (NASDAQ 100 ETF)
• NVDA is one of the heaviest weights
• If QQQ trends strongly → NVDA often mirrors
• Macro sentiment index for tech strength 📊⚡
NASDAQ:SMH (VanEck Semiconductor ETF)
• Clean supply/demand signals
• NVDA mirrors SMH breakouts frequently
• Helps confirm breakout validity before taking the trade
All these help you avoid fakeouts and align with overall semiconductor market strength.
✨ “If you find value in my analysis, a 👍 and 🚀 boost is much appreciated — it helps me share more setups with the community!”
⚠️ This is a thief-style trading strategy created just for fun. Trade responsibly.
I guess it is a bubble...When the CEO is selling, the CFO is selling, SoftBank is unloading, Peter Thiel is selling, and Michael Burry is short, you have to stop and ask the only question that matters:
Is it actually smart to buy the dip here?
I didn’t even bother checking the latest SMH holdings, but if anyone wants to post the updated weightings, it would help frame how much passive-flow risk still sits above price.
The real question is whether there’s room left on the downside and whether this is anywhere near a bottom. If you want an example of how low “too low” can go, just study META during its unwinding. Fundamentals didn’t matter. Valuation didn’t matter. Price just kept repricing until forced sellers were done.
The one positive about this environment is volatility. When liquidity thins out and ranges widen, both sides can pull money out — but only if you treat it like a scalp environment, not a swing-long hero trade.
Because think about it rationally:
Do you want to be the one buying while billionaires, insiders, and institutions are selling into strength?
We’re moving into year-end — historically the period where funds clean books, tax-loss harvest, and unwind risk. Pair that with the probability of crypto-liquidation bleed-through, and you can easily get a chain reaction. Markets don’t fall in straight lines; they fall like Jenga blocks, dominoes, or a card tower collapsing from the bottom up.
This isn’t doom posting — it’s just market structure.
Flow dictates direction, and right now the flow is one-directional.

NVDA Cooked!?If you find this information inspiring/helpful, please consider a boost and follow! Any questions or comments, please leave a comment!
NVDA Price Action Update: Key Levels To Watch
NVDA is cooked if it cannot reclaim the key levels overhead. Price is currently testing 178 and this area is critical for determining whether buyers still have any momentum left.
To flip this structure back upward, NVDA needs an impulse through 178 and then 184. Anything that retraces in a choppy or corrective manner within the impulsive range from 195 is suspect and suggests continuation lower.
If buyers fail to generate an impulsive move from here, the downside levels below come back into play. Seller control increases with every failed retest and every weak bounce.
This is a simple structure play. Impulsive strength is required to shift control. Corrective behavior keeps the door open for further decline.
Trade safe and trade clarity.
NVDA ALERT: Critical Drop AheadNvidia remains in a broader uptrend, but the chart shows a clear trendline breakout followed by the beginning of a pullback.
Using Fibonacci, a correction typically starts after a red candle forms following a sequence of green candles. In most cases, the pullback continues toward the 0.5 retracement level. In this setup, the 0.5 level aligns with a major key support, increasing its importance.
On the weekly timeframe, the 50 EMA is also converging at the same zone, which often acts like a magnet for price. This creates multiple confirmations pointing toward a potential move downward.
The weekly chart has printed a bearish engulfing , followed by three consecutive red candles, adding another strong confirmation for a continued correction.
Both MACD and RSI are sloping downward, supporting the bearish momentum.
If price reaches the expected zone, monitoring the reaction will be critical. A deeper decline into the global trendline is possible only if the key level is broken, though this scenario appears less likely.
Overall, NVDA shows several aligned signals indicating a move toward the correction zone before any potential recovery.
S&P500 crashes! Due relief rally or further pain?Nvidia delivered impressive earnings, but the stock reversed and closed nearly 3% lower, triggering heavy selling across tech and risk assets as odds for a December rate cut have collapsed to just 34%, with policy uncertainty amplified by the cancelled October NFP report. Despite a strong market and rising unemployment in September's NFP report, traders remained defensive and fuelled the declines.
Key drivers:
Nvidia beat earnings, but post-report selling intensified sector losses.
The Fed’s odds for a December rate cut have dropped to 34%, amplifying caution.
The abrupt cancellation of the October NFP means the market lacks fresh labour data, fuelling defensive positioning.
S&P 500, Nasdaq, and Bitcoin broke major supports, confirming risk-off conditions.
Right now, the S&P 500 has broken below channel support near 6,600 and failed to climb back in. If prices stay below this threshold, expect another sharp move lower targeting 6,500 and possibly 6,350. There’s potential for upside, given momentum divergence on the RSI 4-hour chart. If we see a short-term bounce and a return to the channel, a move toward 6,682 is possible, which sets up a tactical short opportunity.
Trade idea:
Entry: Midpoint of 23.6/38.2 Fibonacci (6,655–6,682 area)
Stop-loss: Above 61.8% Fib (6,775)
Take Profits: TP1 6,500 (recent low/support), TP2 6,440 (major support), TP3 trail stop to 6,170 (long-term support)
Risk-off drivers are in control. Earnings reversals, Fed uncertainty, and cancelled NFP data are fuelling this price action. Technically, it comes down to whether we see a return inside the channel for a relief bounce or a sharp continuation downward.
Watch your levels, remain nimble, and let fundamentals and technicals, not emotions, guide your trade.
Let me know your setups in the comments, and follow for more high-action technical and macro trade ideas.
This content is not directed to residents of the EU or UK. Any opinions, news, research, analyses, prices or other information contained on this website is provided as general market commentary and does not constitute investment advice. ThinkMarkets will not accept liability for any loss or damage including, without limitation, to any loss of profit which may arise directly or indirectly from use of or reliance on such information.
