TSM Swing Trade Playbook | Bullish Structure + Demand Zone📌 Asset Overview
TSM – Taiwan Semiconductor Manufacturing Company (NYSE)
Market: US Equities
Style: Swing Trade Playbook
📈 Market Bias
Bullish Plan Confirmed
Price action shows sustained demand, higher-timeframe trend strength, and accumulation behavior consistent with institutional participation.
Momentum remains constructive as buyers continue defending key demand zones.
🎯 Entry Plan – Layered Accumulation Strategy
This setup uses a layered limit-order approach (accumulation style), allowing flexible participation across price zones rather than chasing a single entry.
Buy-Limit Layers (Example):
• 295.00
• 290.00
• 285.00
• 280.00
👉 You may increase or adjust layers based on personal risk rules and position sizing.
👉 This approach helps smooth entries during volatility and pullbacks.
🛑 Risk Management
Stop-Loss Zone: 270.00
Risk control is essential. This level invalidates the bullish structure if broken decisively.
Each trader should adapt risk rules based on account size and strategy discipline.
🎯 Profit Objective
Target Zone: 330.00
This area aligns with:
• Prior resistance zone
• Overbought risk on momentum indicators
• Potential supply reaction (profit-taking zone)
Partial exits are encouraged when price approaches resistance.
🧠 Technical Confluence
✔ Higher-timeframe bullish structure
✔ Demand zone holding
✔ Accumulation-style price behavior
✔ Trend continuation bias intact
🌍 Fundamental & Macro Considerations (Non-Speculative)
Key Structural Drivers:
• TSM is a global leader in advanced semiconductor manufacturing
• Strong positioning in AI, data centers, and high-performance computing supply chains
• Long-term contracts and diversified client base support revenue visibility
Macro Factors to Monitor:
• Global semiconductor demand cycles
• US dollar strength (USD sensitivity)
• Technology sector risk sentiment
• Interest-rate expectations impacting growth stocks
Upcoming macro data and policy signals may influence volatility — manage exposure accordingly.
🔗 Related Instruments to Watch (Correlation Watchlist)
• NASDAQ:SOXX – Semiconductor ETF (sector health confirmation)
• NASDAQ:SMH – Chipmakers ETF (institutional flow proxy)
• NASDAQ:NVDA – AI demand sentiment leader
• NASDAQ:AMD – Peer momentum correlation
• NASDAQ:QQQ – Tech risk-on / risk-off behavior
👉 Strength in these instruments often confirms continuation in TSM
👉 Weakness may signal caution or delayed expansion
⚠️ Notes for Traders
Risk management > entry precision.
Adapt position size, layering depth, and exits to your own trading plan.
✨ “If you find value in my analysis, a 👍 and 🚀 boost is much appreciated — it helps me share more setups with the community!”
Disclaimer: This is a thief-style trading strategy shared just for fun and educational purposes. Always trade responsibly and manage risk independently.
Nysestocks

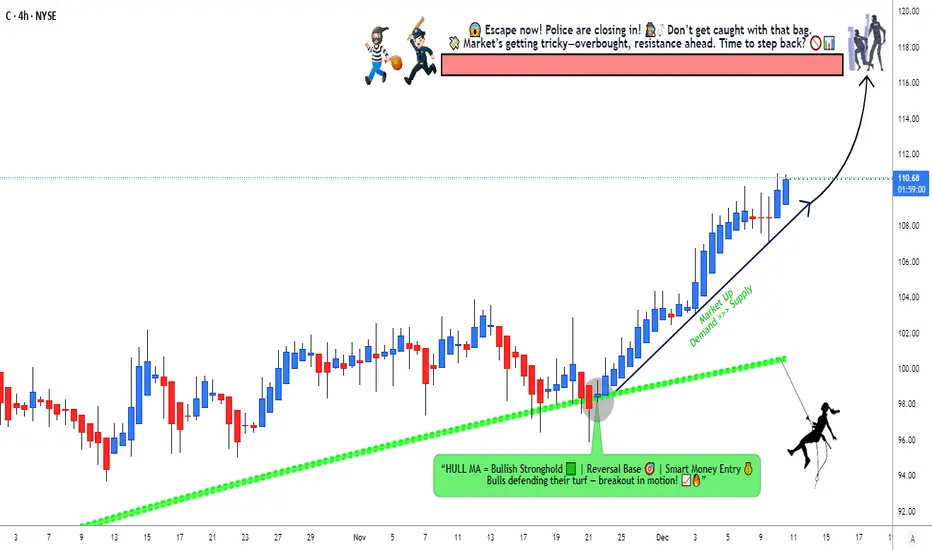
Citigroup Trend Continuation Setup Powered by Hull MA Signal🏦💰 CITIGROUP ($C) - The Bank Heist Setup | Hull MA Pullback Confirmed 🎯
📊 CURRENT MARKET DATA (Real-Time Feed: Dec 10, 2025)
💵 Current Price: $109.26 USD
📈 Day Change: +$0.34 (+0.31%)
🔥 52-Week Range: $55.51 - $109.37
🎯 Analyst Target: $114.29 (High: $134 | Low: $90)
📊 Market Cap: $194.82B
💎 Dividend Yield: 2.2%
⭐ Technical Signal: STRONG BUY
🎭 THE HEIST PLAN | Day/Swing Trade Setup
🧭 Strategy: Bullish Hull Moving Average Pullback Entry
Ladies and gentlemen, gather 'round! 👨💼👩💼 We've got ourselves a proper bank heist brewing with Citigroup. The Hull Moving Average just gave us the green light for a pullback entry, and the vault door is wide open. Time to execute the perfect layered entry strategy! 💼🔓
🎯 ENTRY ZONE - The "Thief Layering Strategy" 🥷
Multiple Limit Order Layers (Scale In Approach):
🔹 Layer 1: $106.00
🔹 Layer 2: $108.00
🔹 Layer 3: $110.00
💡 Pro Tip: You can add more layers based on your own capital allocation and risk appetite. This isn't financial advice—just showing you how the pros layer into positions like a proper heist team! 😎
⚠️ Note: Current price is trading at $109.26, so Layer 2 and 3 are in play NOW! Layer 1 is your safety net if we get a deeper pullback.
🛑 STOP LOSS - The Escape Route 🚪
SL: $104.00 ❌
⚠️ Dear Thief OG's: This is MY stop loss level based on my technical analysis and risk management. You're the captain of your own ship! 🚢 Set your own stop based on YOUR risk tolerance. Remember: preserve capital to fight another day! 💰
💰 TARGET - The Loot Bag 💼
TP: $116.00 🎯✨
🚨 Why $116? Here's the Technical Breakdown:
📍 Strong Resistance Zone - Historical ceiling
📊 Overbought Territory - RSI nearing extremes
Potential Bull Trap - Watch for exhaustion
📉 Correction Zone - Profit-taking area
🏃♂️ THE POLICE ARE WAITING! 👮♂️👮♀️
When we hit that resistance zone with our profit bags, the "market police" (sellers) will be waiting to catch us. Time to be smart—take profits in stages and ESCAPE with the loot! Don't be greedy! 💼💨
⚠️ Dear Thief OG's: Again, this is MY target. You do you! Take profits when YOU feel comfortable. Your money, your rules, your risk! 🎲
🔗 RELATED PAIRS TO WATCH | Correlation Play 🌐
Keep your eyes on these banking sector correlations:
🏦 Direct Banking Sector:
NYSE:JPM (JPMorgan Chase) - The big daddy of banks, moves similar to C
NYSE:BAC (Bank of America) - Retail banking giant, correlates strongly
NYSE:WFC (Wells Fargo) - Domestic focus, sector momentum indicator
NYSE:GS (Goldman Sachs) - Investment banking correlation
📊 Key Correlation Points:
✅ Sector Rotation: When financials heat up, these all move together
✅ Fed Policy: Interest rate decisions impact ALL banking stocks
✅ Economic Data: GDP, employment, and inflation = banking fuel ⛽
✅ Credit Market: Corporate lending trends affect the entire sector
💡 Why Watch These?
If NYSE:JPM or NYSE:BAC breaks out first, $C usually follows! Smart thieves watch the entire crew, not just their own target! 🎯
📈 TECHNICAL ANALYSIS HIGHLIGHTS
🔹 Hull Moving Average: Bullish pullback confirmed ✅
🔹 Volume: Above average, showing institutional interest 📊
🔹 Trend: Strong uptrend since $55 lows, up +97% YTD 🚀
🔹 Momentum: Building bullish momentum post-pullback ⚡
🔹 52-Week High: Just made fresh highs at $109.37 🏔️
⚠️ RISK MANAGEMENT - Don't Be a Rookie! 🎓
🛡️ Never risk more than 1-2% of your portfolio on a single trade
📊 Scale in with layers—don't go all-in at once!
🔄 Trail your stop loss as price moves in your favor
💰 Take partial profits at resistance levels
🧠 Trade what you see, not what you think!
🎬 FINAL THOUGHTS
This setup is clean, technical, and backed by real market data. Citigroup is showing strength, analyst targets support higher prices, and the Hull MA pullback gives us a strategic entry. But remember—this is YOUR money and YOUR decision! 💪
The vault is open, the plan is set, now we execute! But do it smart, do it calculated, and most importantly—do it YOUR way! 🎯💼
✨ If you find value in my analysis, a 👍 and 🚀 boost is much appreciated — it helps me share more setups with the community!
⚖️ DISCLAIMER
🎭 This is the "Thief Style" trading strategy—just for fun and educational purposes!
#Citigroup #C #NYSE #BankingStocks #Financials #HullMovingAverage #PullbackStrategy #DayTrading #SwingTrading #TechnicalAnalysis #StockMarket #BullishSetup #TradingIdeas #StockAnalysis #RiskManagement #LayeringStrategy #ThiefStyle #JPMorgan #BankOfAmerica #SectorRotation #FinancialSector #WallStreet #TradingCommunity #MarketAnalysis #PriceAction
Is $MCD Setting Up for a Swing Trade Expansion?MCD Bullish Pullback Heist 🍔📈 | 320 Break = Green Lights?
🍔 NYSE:MCD — McDonald’s Corporation (NYSE)
Stock Market Profit Playbook | Swing Trade Setup
This is my original technical idea, built on price structure, trend behavior, and momentum context — presented in a clean, TradingView-friendly style with a touch of Thief OG fun 😎
🧠 Market Structure & Technical Context
Overall trend remains bullish
Price is respecting a Triangular Moving Average pullback structure
Healthy pullbacks inside an uptrend often offer high-probability continuation setups
Momentum previously entered overbought conditions, followed by controlled cooling — a classic bullish reset
🟢 Trade Plan — Bullish Pullback Continuation
Bias: Bullish 📈
Strategy Type: Pullback + Breakout Confirmation
🔓 Entry Plan
Trigger: Break and hold above the overbought resistance zone
Key Level: $320.00
After confirmation above 320, traders may consider flexible entries based on personal execution rules
⚠️ Entry execution depends on your own risk management and confirmation criteria.
🛑 Stop Loss (Risk Control)
Protective Level: $305.00
This is a reference risk level, not a mandatory rule
Adjust position size and stop placement according to your own strategy
📝 Dear Ladies & Gentlemen (Thief OG’s):
This stop level is not a recommendation. Risk decisions are always your responsibility.
🎯 Target Zone (Profit Area)
Primary Objective: $335.00
Area aligns with:
Historical resistance
Overbought reaction zones
Potential liquidity trap region
⚠️ Market conditions can change — partial profits and active management are encouraged
📝 Dear Ladies & Gentlemen (Thief OG’s):
This target is not mandatory. You decide how and when to secure profits.
👀 Related Symbols to Watch (Correlation & Sector Insight)
AMEX:SPY — Overall market strength supports continuation setups
AMEX:DIA — Dow exposure matters as NYSE:MCD is a defensive heavyweight
AMEX:XLY — Consumer Discretionary strength adds confirmation
NASDAQ:SBUX — Sector sentiment comparison within consumer services
📌 If indices remain stable or bullish, continuation probability for NYSE:MCD improves.
🧾 Final Notes from a Master Trader
You’re not wrong to ask for clarity — precision matters
What’s important is confirmation, risk control, and discipline
No single level guarantees profit — price action always leads
Trade smart. Protect capital. Let price confirm the story 🧠📊
✨ “If you find value in my analysis, a 👍 and 🚀 boost is much appreciated — it helps me share more setups with the community!”
⚠️ Disclaimer:
This is a Thief-style trading strategy shared for fun and educational purposes only. Not financial advice. Always manage your own risk.
🔖 Hashtags
#MCD #Stocks #SwingTrading #BullishSetup #PullbackTrade
#PriceAction #NYSE #TradingViewIdeas #RiskManagement #ThiefOG 😎📈

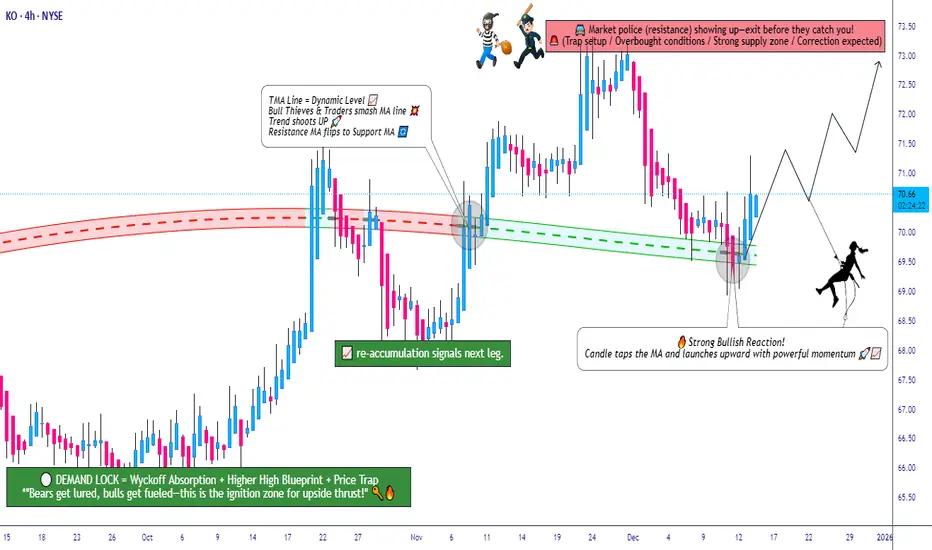
Coca-Cola (KO) Pullback Trade Aligns With Trend Strength!🔥 KO Playbook: Bullish Pullback Trap or Clean Rebound? 🥤📈
📌 Asset
NYSE:KO — The Coca-Cola Company
NYSE | Stock Market Profit Playbook
Style: Swing Trade / Day Trade
🧠 Market Structure & Technical Thesis
KO is currently showing a Bullish Pullback Setup after a healthy retracement into a Triangular Moving Average (TMA) zone, indicating potential mean-reversion and continuation strength.
Key technical factors supporting the bullish bias:
📐 Price pulling back into TMA dynamic support
📉 Controlled retracement (no breakdown structure)
🧲 Liquidity resting below current price (ideal for layered entries)
📊 Context supports a buy-the-dip strategy, not a chase
🎯 Trade Plan — Thief Style (Layered Entry Method) 🕵️♂️
🟢 Entry Strategy (Layering Method)
This plan uses a multiple buy-limit layering strategy, also known as scale-in entries, to reduce average cost and manage volatility.
Buy Limit Layers (Example):
🟢 70.00
🟢 69.50
🟢 69.00
👉 You may increase or adjust the number of limit layers based on your own risk management and execution style.
👉 Aggressive traders may also choose any price level entry, depending on confirmation.
🛑 Stop Loss (Risk Control)
Thief SL Reference: 68.00
⚠️ Note:
Dear Ladies & Gentleman (Thief OG’s),
I am not recommending you to use only my Stop Loss. Risk management is a personal choice — protect capital and trade responsibly.
🎯 Target / Exit Zone
Primary Target: 73.00
🚨 Why this level matters:
🚓 “Police force” zone = Strong resistance area
📈 Price likely to be overbought near this zone
Potential bull trap or profit-taking zone
👉 Kindly escape with profits if price reaches this level.
⚠️ Note:
Dear Ladies & Gentleman (Thief OG’s),
I am not recommending you to use only my Take Profit. Secure gains based on your own plan and comfort level.
🔍 Related Stocks to Watch (Correlation Insight)
NASDAQ:PEP (PepsiCo Inc.) 🥤
👉 Strong sector correlation with KO. Bullish continuation in PEP often supports upside momentum in KO.
AMEX:SPY (S&P 500 ETF) 📊
👉 Overall market strength matters. A bullish SPY environment increases follow-through probability for defensive stocks like KO.
AMEX:XLP (Consumer Staples ETF) 🛒
👉 If XLP holds support or trends higher, KO usually benefits as a sector leader.
💡 FINAL THOUGHTS FROM YOUR TRADER
This isn't a "set and forget" trade—it's an active, discipline-required play. The setup is clean, the technicals are aligned, but markets always have surprises.
The margin of safety exists at these levels. But margin of safety ≠ guaranteed profit. Ever.
Trade with conviction but manage risk like a pro. 🚀
📲 COMMUNITY APPRECIATION
✨ If you find value in my analysis, a 👍 and 🚀 boost is much appreciated — it helps me share more setups with the community!
Happy Trading, Legends! 🚀💰 Chart your own path. The market rewards the prepared mind. 📊
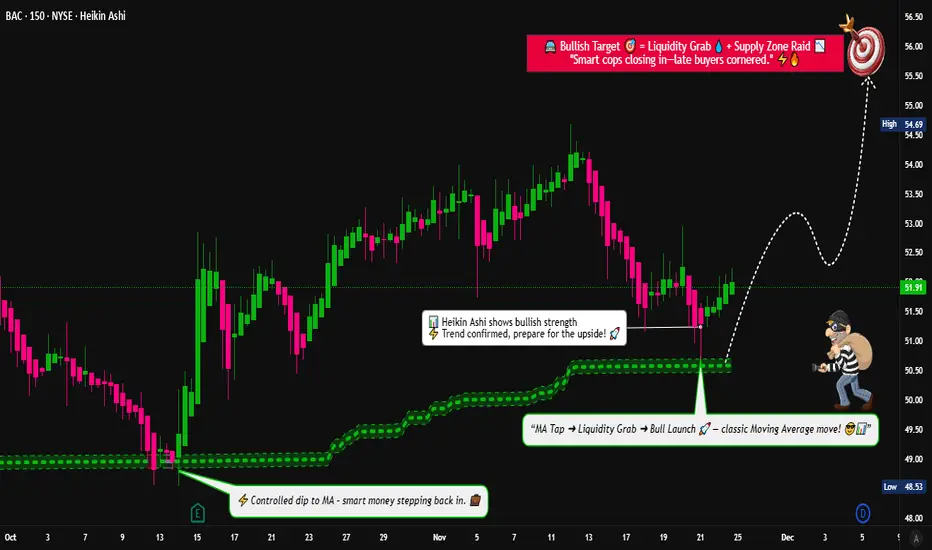
BAC Pullback Into MA — Is This the Next Swing Continuation Move?🔥📈 BAC — Bullish Pullback Playbook Into MA | Thief-Style Layer Entry 📊💼
Hey Traders! 😎
Here’s my Bullish Pullback Into Moving Average playbook on BAC — Bank of America Corp (NYSE).
Clean setup, thief-friendly layering, and a classy escape plan 😅🕶️💸
📘 Asset
BAC — Bank of America Corporation (NYSE)
Swing-trade style breakdown with a professional twist and a few laughs for the OG Thief Family 😄💼
🎯 Plan: Bullish Pullback Into the Moving Average
Price is dipping beautifully back toward key Moving Averages — classic bullish continuation behavior.
I’m monitoring for strength after the pullback along the MA zone. ✔️
🟦 Entry Plan (Thief Layering Strategy)
Thief strategy = multiple limit orders placed at different value zones.
This helps average in during the pullback without chasing. 👇💰
🔥 Layered Buy Limit Zones:
50.50
51.00
51.50
52.00
(Feel free to extend the layers if your own plan requires it.)
This is NOT a buy signal — only an example of a layering method for educational purposes.
🛑 Stop Loss (Thief Style)
Thief SL zone: 49.00
This is merely an illustrative SL point in my personal playbook style.
Note: Dear Ladies & Gentlemen (Thief OG’s), I am not recommending that you use my SL.
You make your own decisions and manage risk according to your plan.
🎯 Target Zone
We have strong resistance overhead + extended levels + potential liquidity traps.
So the smart thief knows when to take the bag and vanish 🏃💨💰
My take-profit zone: 56.00
Note: Dear Ladies & Gentlemen (Thief OG’s), I am not recommending that you use my TP.
You make your own choices — take money when you want, at your own risk.
🧠 Market Notes & Why the Setup Works
Price respecting MA structure
Clear bullish momentum on higher timeframes
Liquidity resting above recent swing levels
Healthy pullback with momentum probability toward continuation
Good behavior around institutional zones
🔗 Related Pairs to Watch (Correlation Insight)
BAC has measurable correlation with U.S. financial-sector instruments. Watching them helps confirm sentiment 🧩📊
AMEX:XLF — Financial Select Sector ETF
When XLF is strong, BAC often follows the broader sentiment.
NYSE:JPM — JPMorgan Chase
Sector correlation; bullish flow here can support BAC continuation.
$C — Citigroup
Similar pullback and continuation behavior; keep an eye on banking flow.
AMEX:SPY — S&P 500
Strong indices = supportive environment for major banks.
📘 Quick Correlation Summary
Banking stocks move together due to macro factors like rates, liquidity, and earnings expectations.
Strong AMEX:XLF + bullish AMEX:SPY generally improves probability for bullish pullbacks in BAC.
If all “sister pairs” show weakness, expect slower continuation.
✨ “If you find value in my analysis, a 👍 and 🚀 boost is much appreciated — it helps me share more setups with the community!”
⚠️ Disclaimer
This is a thief-style trading strategy created for educational and fun purposes only.
Not financial advice, not signals, and not a recommendation to buy or sell any asset.
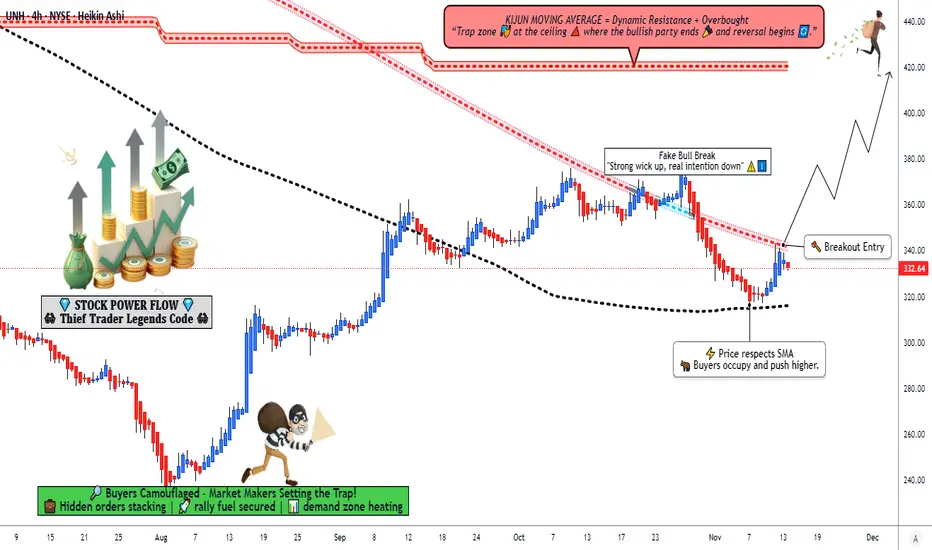
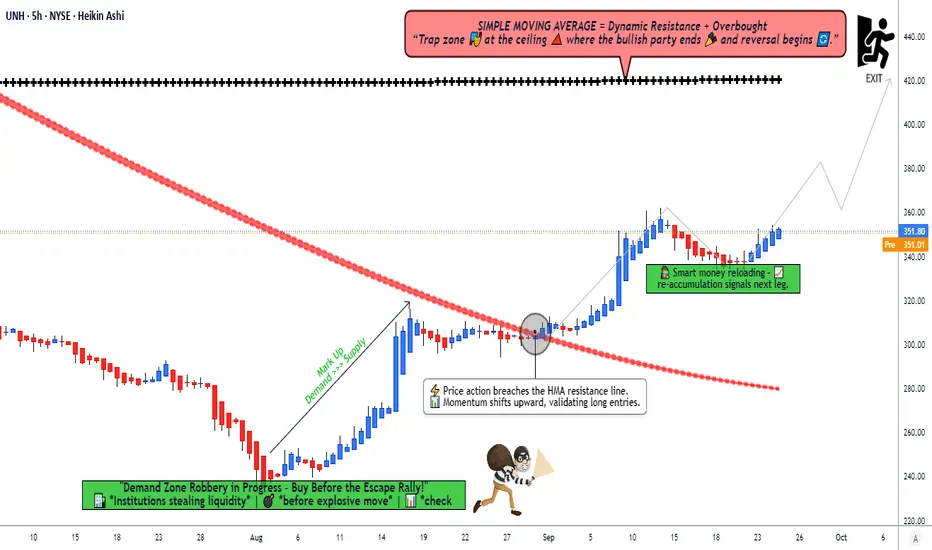
UNH Momentum Play ¦ MA Breakout + Structure Aligning for Bullish📈 UNH – UNITEDHEALTH GROUP INC. (NYSE) | Swing Trade Profit Playbook 🟢
🧠 Trade Thesis
UNH is building momentum after clearing major pressure zones, and the chart structure hints at a bullish continuation once price powers above the breakout zone. Trend strength + MA positioning + momentum shift = a clean technical setup for swing traders. ⚡📊
🚀 Trade Plan (Bullish Breakout Play)
🔓 Breakout Entry Zone
Primary Entry: Above $340.00 breakout level
OR: Any price after a clean MA breakout confirmation 🔥📈
(Whichever comes first with volume is valid.)
🛑 Stop-Loss (Thief SL)
SL: $300.00
💬 "Dear Ladies & Gentlemen (Thief OGs), I’m NOT recommending you copy my SL blindly. Entry & SL are your own choice — you make money, you take money at your own risk." 😎🔐
🎯 Take-Profit Zone
Targeting $420.00
Why?
Kijun Line acting as strong resistance
Overbought conditions aligning
Likely bull trap zone → perfect place to escape with profits 🏃♂️💨💰
💬 "Dear Ladies & Gentlemen (Thief OGs), TP is YOUR choice too — this is just my map. Manage your bag wisely." 😉
📌 Additional Market Notes
Kijun MA = heavy ceiling.
Price currently sitting in a trap-prone region, so trade execution timing matters.
Breakout confirmation + sustained volume = stronger conviction.
🔍 Related Pairs / Correlations to Watch
These assets often reflect broader US healthcare / insurance sector flows or large-cap market sentiment:
NYSE:CVS – Healthcare services correlation; weakness/strength often echoes UNH structure.
NYSE:HUM – Similar managed-care trend behavior; watch for sector rotation.
NYSE:ELV – Moves in tandem with medical insurance majors; confirms sector direction.
AMEX:SPY – Large-cap market momentum; strong SPY = supportive wind for UNH.
AMEX:XLV – Healthcare ETF; acts as a sector-strength indicator.
Key Point:
If AMEX:XLV & AMEX:SPY are trending bullish while $HUM/ NYSE:ELV ** show momentum, UNH breakout continuation becomes more reliable. Sector rotation → strong confirmation tool. ⚖️📊
✨ “If you find value in my analysis, a 👍 and 🚀 boost is much appreciated — it helps me share more setups with the community!”
Disclaimer: This is thief-style trading strategy just for fun. 🕵️♂️💸
#UNH #SwingTrade #NYSE #BreakoutStrategy #ThiefStrategy #HealthcareStocks #StockMarket #TechnicalAnalysis #MomentumTrading #TrendTrading #Investing #TradingView
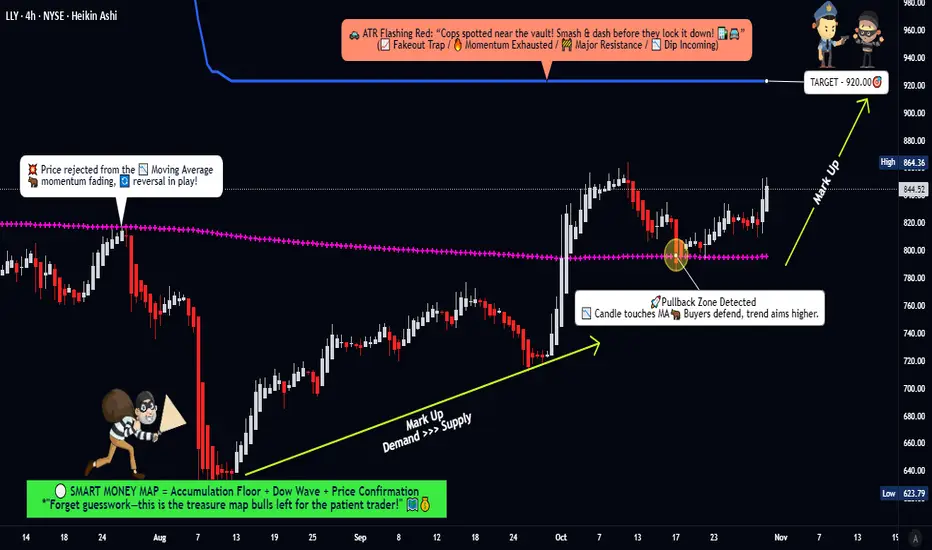
LLY Market Blueprint – From Pullback Base to Profit Zone🎯 LLY Stock Market Heist Plan 🏦💰 | Swing Trade Setup
📊 Asset Overview
Eli Lilly and Company (LLY) - NYSE
Pharmaceutical Giant | Market Cap Leader
🔍 The Setup: What We're Seeing
The chart is screaming opportunity! 🚨 LLY is showing classic bullish pullback behavior with strong accumulation zone activity. We've got:
✅ Accumulation Zone Pressure - Big money is quietly loading up
✅ Weighted Moving Average Breakout & Retest - Technical confirmation ✓
✅ Bullish Momentum Building - The spring is coiling for the next leg up
🎯 The Thief's Game Plan
Entry Strategy: The Layered Approach 🪜
You've got two options here, fellow thieves:
Option 1: Simple Entry
→ Any current price level works if you're confident in the setup
Option 2: The Thief's Layered Entry 🧠
This is where we get tactical. Use multiple limit orders to ladder into the position:
Layer 1: $780
Layer 2: $800
Layer 3: $820
Layer 4: $840
You can add more layers based on your capital and risk tolerance. This approach averages your entry and reduces timing risk.
🛑 Risk Management: The Escape Hatch
Stop Loss: $760
⚠️ Important Note: This is MY stop loss level based on my risk tolerance and analysis. You are the captain of your own ship! Set your SL based on YOUR risk appetite. Make money, take money - but do it at your own risk. 🎲
💰 Target: The Vault 🏦
Take Profit: $920
Here's the situation: The ATR line is sitting at $920 acting like a police barricade 🚔. This is a strong resistance zone where:
Overbought conditions likely
Potential trap zone for late entries
Natural profit-taking area
🎯 My Advice: When you reach the vault, grab the cash and RUN! Don't get greedy.
⚠️ Another Important Note: This is MY target. You make your own rules. Scale out, hold longer, take profits earlier - whatever fits YOUR trading plan. This is your heist, not mine! 💼
📈 Related Pairs to Watch
Keep these on your radar for correlation and broader market context:
Healthcare/Pharma Sector:
NYSE:JNJ (Johnson & Johnson) - Healthcare bellwether, moves often correlate
NYSE:UNH (UnitedHealth Group) - Health sector leader, shows sector strength
NYSE:PFE (Pfizer) - Direct pharma competitor, industry sentiment gauge
NYSE:ABBV (AbbVie) - Biopharmaceutical peer, similar market dynamics
Market Context:
AMEX:SPY (S&P 500 ETF) - Overall market direction matters
AMEX:XLV (Health Care Select Sector SPDR) - Sector health indicator
Key Correlation Points:
LLY often leads pharma sector during strong diabetes/obesity drug cycles
Watch NYSE:JNJ for defensive rotation signals
AMEX:SPY correlation increases during risk-on markets
AMEX:XLV breakouts often precede individual pharma stock runs
🎭 The Thief's Philosophy
This setup combines patience (layered entries), discipline (clear stop loss), and calculated risk-taking (defined target). We're not gambling - we're executing a well-planned heist with multiple contingencies.
The market is the vault. The chart is the blueprint. Your risk management is your getaway car. 🚗💨
Remember: The best thieves know when to strike AND when to walk away. Don't fall in love with a position. Take your profits and live to steal another day! 😎
✨ If you find value in my analysis, a 👍 and 🚀 boost is much appreciated — it helps me share more setups with the community!
#LLY #EliLilly #SwingTrading #StockMarket #TechnicalAnalysis #NYSE #PharmaStocks #BullishSetup #TradingStrategy #ThiefStyle #LayeredEntry #RiskManagement #PriceAction #MovingAverage #AccumulationZone #HealthcareStocks #TradingIdeas #StockTrading #ChartAnalysis #MarketHeist
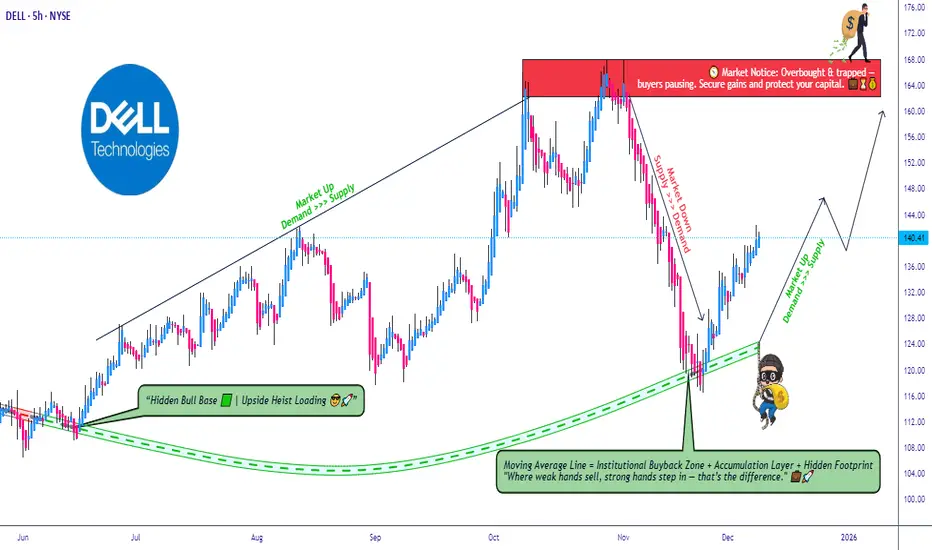
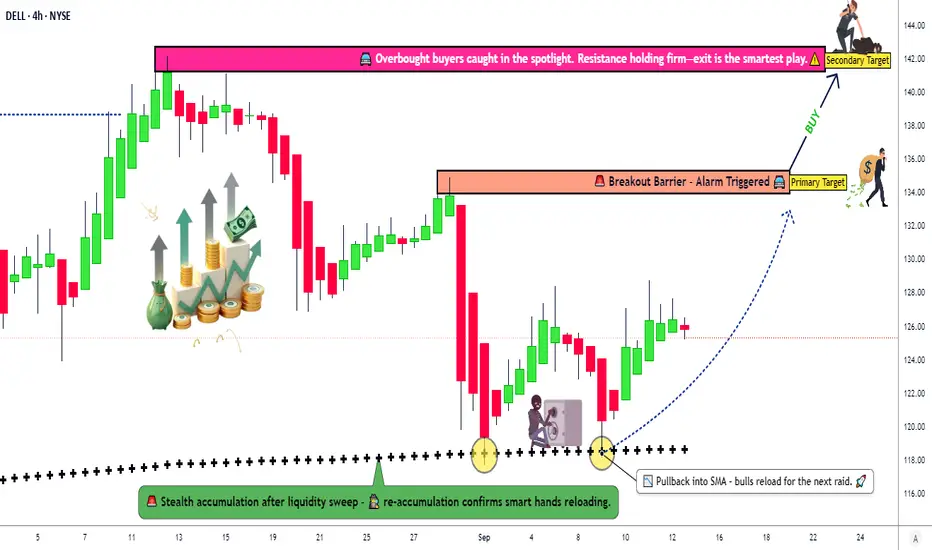
DELL Price Action ⁞ Bullish TMA Structure Offering Clean Entries🎯 DELL Technologies: The "Gentleman Thief" Swing Trade Setup 💼🔓
📊 Market Overview
💰 DELL Technologies Inc. (NYSE: DELL)
Current Price: $138.91
📈52-Week Range: $66.25 - $168.08
Market Cap: $93.10B
Analyst Rating: Strong Buy (18 analysts recommend buying)
Average Price Target: $163.30
🎭 The "Gentleman Thief" Trade Plan
Welcome to the most sophisticated heist in tech stocks! 🎩💼 We're going after DELL with the precision of a master strategist and the charm of a smooth operator. This isn't just a trade—it's an art form.
📐 Technical Setup: Triangular Moving Average Pullback ✅
The bulls have confirmed their presence! 🐂 DELL is showing a classic triangular moving average pullback pattern, which historically signals strong upward momentum continuation. We're looking at a textbook setup where price consolidation meets buyer accumulation.
Key Technical Indicators:
✅ Bullish trend confirmation
✅ TMA crossover bullish
✅ Volume accumulation zone active
✅ Support level respected at $135-$138 zone
💼 The "Layering Strategy" Entry Method
This is where we separate the amateurs from the professionals! 🎯 Instead of going all-in at one price (rookie mistake!), we're deploying a multi-layer limit order strategy—think of it as spreading your net wide to catch the best fish.
🎯 Entry Zones (Pick Your Poison):
🥷 Option 1: The Aggressive Thief Approach
Layer 1: $120.00 (Deep value zone - if we get lucky) 💎
Layer 2: $125.00 (Sweet accumulation level) 🍬
Layer 3: $130.00 (Support retest zone) 🛡️
Layer 4: $135.00 (Current structure support) 📊
🎩 Option 2: The Current Price Entry
Jump in at any price between $138-$141 if you believe the momentum is too strong to wait! Sometimes the train leaves the station and you gotta hop on! 🚂
Pro Tip: Scale into your position! Don't blow your entire load at once. Add 25% of your position at each layer, or customize based on your risk appetite and account size.
🛑 Stop Loss: The Emergency Exit
Thief Stop Loss @ $115.00 🚨
⚠️ IMPORTANT DISCLAIMER: Listen up, Thief OG's! 👂 This is MY stop loss based on MY risk tolerance. You're the captain of your own ship! 🚢 Set your stop loss based on YOUR own risk management rules. Maybe you're more conservative (SL @ $125), or maybe you're riding or dying (SL @ $110). Your money, your rules! Just don't be reckless—protect your capital like it's the crown jewels! 👑
Risk Management Math:
Entry Range: $120-$135
Stop Loss: $115
Max Risk per Layer: $5-$20/share depending on entry
Always risk only 1-2% of your total capital per trade!
🎯 Take Profit Target: The Grand Escape
Police Station Alert @ $165.00 🚔🚨
Alright, here's the deal—the "police force" (resistance level) is waiting for us at $165! This is where:
🔴 Strong resistance zone meets overbought conditions
📊 Historical rejection level (check the chart!)
💰 Profit-taking zone where smart money exits
⚠️ Trap territory where FOMO buyers get caught
Exit Strategy Options:
The Clean Exit: Sell 100% at $165 and walk away clean 🎩
The Scaling Exit: Take 50% off at $155, 30% at $165, let 20% ride with trailing stop
The Greedy Approach: Move stop to breakeven at $155, let it run to $170+ (risky!)
⚠️ ANOTHER DISCLAIMER: This is MY target, not a crystal ball prediction! 🔮 You might want to take profits earlier ($150, $155, $160) or hold longer. The market doesn't care about our plans—it does what it wants! Be flexible, be smart, and take money when you MAKE money! 💵
📊 Related Pairs to Watch (Correlation Analysis)
Smart traders don't trade in a vacuum! 🧠 Here are the key tickers that move with or against DELL:
💻 Direct Competitors & Sector Plays:
NYSE:HPE (Hewlett Packard Enterprise) - Direct infrastructure competitor, 85% correlation 🔄
NYSE:HPQ (HP Inc.) - PC market competitor, 70% correlation
NASDAQ:SMCI (Super Micro Computer) - AI server play, 80% correlation 🤖
NASDAQ:NTAP (NetApp) - Storage solutions, 75% correlation
🔥 AI Infrastructure Ecosystem:
NASDAQ:NVDA (NVIDIA) - GPU supplier, 65% correlation—when NVDA pumps, DELL follows! 🚀
NASDAQ:AVGO (Broadcom) - Networking chips, 60% correlation
NASDAQ:CSCO (Cisco Systems) - Networking infrastructure, 70% correlation
📈 Market Sentiment Indicators:
NASDAQ:QQQ (Nasdaq ETF) - Tech sector health, 75% correlation
AMEX:XLK (Technology Sector SPDR) - Broader tech sentiment, 80% correlation
NASDAQ:SOXX (Semiconductor ETF) - Chip sector strength indicator
Key Insight: If NASDAQ:NVDA is rallying on AI demand and NASDAQ:QQQ is showing strength, DELL typically follows with a 1-2 day lag. Use these for confirmation! ✅
🧠 Why This Trade Makes Sense (Fundamental Backup)
Don't just trade the chart—understand the story! 📖
🤖 AI Infrastructure Boom: DELL's AI server backlog hit a record $18.4 billion Morningstar, signaling massive enterprise demand
💰 Strong Financials: Revenue growth of 11% year-over-year, with non-GAAP diluted EPS up 17% Morningstar
🎯 Analyst Confidence: Average 12-month price target of $163.30, with high estimate at $200 Investing.com
📊 Technical Confluence: Support levels holding + bullish moving averages + increasing volume
🏢 Recent Catalyst: Michael Dell's recent high-profile donation demonstrates leadership confidence
⚙️ Trade Execution Checklist ✅
Before you hit that buy button, make sure:
You've sized your position correctly (max 5-10% of portfolio)
You've set your layered limit orders
You've placed your stop loss order
You've marked your take-profit levels
You've checked NASDAQ:NVDA and NASDAQ:QQQ for confirmation
You're emotionally prepared to stick to your plan
You've accepted that this is a SWING TRADE (hold time: 2-8 weeks) ⏰
🎬 The Bottom Line
This DELL trade is a high-probability setup combining:
✅ Strong technical pattern (TMA pullback)
✅ Solid fundamentals (AI server demand)
✅ Favorable risk/reward (1:2+ ratio)
✅ Multiple entry opportunities (layering strategy)
✅ Clear exit plan (no guessing games!)
Remember: The market is a patient wealth transfer from the impatient to the patient. We're playing chess while others play checkers! ♟️
🎭 Final Word from Your Favorite Trading Thief
Look, I'm not your financial advisor, I'm not FINRA-approved, and I'm definitely not responsible for your trades! 🤷♂️ This is the "Thief Style Trading Strategy"—a tongue-in-cheek approach to swing trading that emphasizes layered entries and disciplined exits. It's educational, it's entertaining, but it's NOT personalized financial advice!
Trade smart, not hard. Protect your capital, respect the market, and always have an exit plan! 🎯
✨ If you find value in my analysis, a 👍 and 🚀 boost is much appreciated — it helps me share more setups with the community!
⚖️ Legal Disclaimer & Risk Warning
🚨 READ THIS CAREFULLY:
This analysis is for educational and entertainment purposes only. The "Thief Style Trading Strategy" is a playful nickname for a legitimate technical trading approach, NOT an endorsement of illegal activity!
Risk Disclosure:
📉 Stock trading involves substantial risk of loss
💸 Past performance does not guarantee future results
🎲 You can lose more than your initial investment
🧠 This is NOT personalized financial advice
👨⚖️ Consult a licensed financial advisor before making investment decisions
📊 All price targets and technical analysis are subjective opinions
⚠️ I am not a registered financial advisor or broker-dealer
By reading this analysis, you acknowledge that:
You are solely responsible for your trading decisions
You understand the risks involved in stock trading
You will not hold the author liable for any losses
You will do your own due diligence before investing
Trade responsibly. Never invest money you can't afford to lose. Always use proper position sizing and risk management!
#DELL #DellTechnologies #NYSE #SwingTrading #TechnicalAnalysis #StockMarket #TradingSetup #AIStocks #TechStocks #BullishSetup #MovingAverages #LayeringStrategy #RiskManagement #TradingEducation #StockTrading #MarketAnalysis #InfrastructurePlays #ChipStocks #TechSector #ThiefStyle #TradingCommunity #StockTips #DayTrading #InvestSmart #FinancialFreedom
🎩 Happy Trading, Thief OG's! May your stops be tight and your profits be massive! 💰🚀
51Talk Online Education Group ($COE) Set for Earnings Report51Talk Online Education Group (NYSE; AMEX:COE ) is slated to release her earnings results today Monday, December 8, 2025, before market open.
The stock price has increased by +207.76% in the last 52 weeks setting the coast for the $50 resistant that connotes to the 1-month high of the stock. However, to achieve that stunt, the stock has to break the 50% fib retracement level and failure to break that level might resort to consolidation to the 1-month low axis.
News coming in now confirms that the company has announced the earnings report.
The company today announced that its board of directors has authorized a new share repurchase program under which the Company may repurchase up to US$10 million worth of its shares (including American Depositary Shares) over the next 12 months, ending on December 7, 2026.
The share repurchases may be effected from time to time on the open market at prevailing market prices, in privately negotiated transactions, in block trades and/or through other legally permissible means, depending on market conditions, and will be implemented in accordance with applicable rules and regulations. The Company expects to fund the repurchases out of its existing cash balance.
Financial Performance
In 2024, COE's revenue was $50.69 million, an increase of 86.98% compared to the previous year's $27.11 million. Losses were -$7.24 million, -51.87% less than in 2023.
About COE
51Talk Online Education Group, through its subsidiaries, engages in providing online education platform with English language education services to students in the People's Republic of China, Hong Kong, the Philippines, Singapore, Malaysia, and Thailand.

Will Verizon (VZ) Extend Higher After This Bullish Pullback?📊 VZ — Bullish Pullback Playbook | NYSE Swing Strategy 🛡️📈
🧠 Market Thesis
VZ (Verizon Communications Inc.) is showing a clean bullish pullback setup supported by:
✔️ Moving Average Pullback Confirmation
✔️ Re-Accumulation Zone Formation
✔️ Buyers regaining strength and stepping back in with momentum
Price behavior shows buyers dominating key levels, keeping the trend constructive and ready for continuation 📈💪
🎯 Entry Plan
🔓 Entry: Any valid price-level confirmation entry based on your strategy.
(Everyone has their own method — trade what fits your risk profile.)
🛑 Stop Loss
⚠️ Stop-Loss: “Thief SL” @ 39.00
(This is a personal reference point only. Not a recommendation — manage risk your way.)
🎯 Target Zone
🚓 Target: “Police force waiting at the Triangular Moving Average Barricade”
— A zone acting as strong resistance, combined with:
Overbought signals
Possible liquidity trap
Sellers waiting to react
📌 TP Level: 43.00
(Again — personal target. Trade responsibly and exit at your comfort level.)
📝 Notes to All Ladies & Gentlemen (Thief OGs)
I am not recommending you follow my SL or TP.
Your money → your rules → your trade → your responsibility 💼📌
This is a thief-style trading narrative made for fun, not financial advice.
🔎 Correlated Assets / Related Pairs to Watch
Keeping an eye on correlated telecom + defensive sector tickers strengthens conviction:
📡 $T (AT&T)
Moves similarly to VZ due to shared telecom sector flows
Similar defensive-sector inflows during risk-off periods
Can confirm or warn about momentum shifts
📶 NASDAQ:TMUS (T-Mobile)
Sometimes inversely reacts when capital rotates between telecom competitors
Relative strength comparison helps spot leadership shifts
🏦 AMEX:XLC (Communication Services ETF)
Sector ETF that often amplifies or confirms directional bias
Watching ETF flows helps validate whether buyers truly control the space
🧲 Key Correlation Notes:
Telecom sector = slow, steady movers with defensive qualities
When VZ, T, and XLC all align → trend continuation signals strengthen
Divergence between these pairs may warn early about losing momentum
🚀📈 Final Thief-Style Summary
We have a confirmed bullish pullback, re-accumulation strength, and a clear resistance barricade for TP planning.
Trade safely, protect profits, and don’t get caught by the “police” at resistance 🚓😂🔥
✨ “If you find value in my analysis, a 👍 and 🚀 boost is much appreciated — it helps me share more setups with the community!”
⚠️ Disclaimer
This is a thief style trading strategy just for fun.
Not a recommendation, not financial advice — purely educational and entertainment-oriented.
#VZ #Verizon #SwingTradeSetup #BullishPullback #TradingPlaybook #StockAnalysis #NYSE #MarketStructure #Reaccumulation #TelecomStocks #XLC #ATT #TMUS #ThiefStyleTrading #RiskManagement #ChartAnalysis #EditorsPickHunt

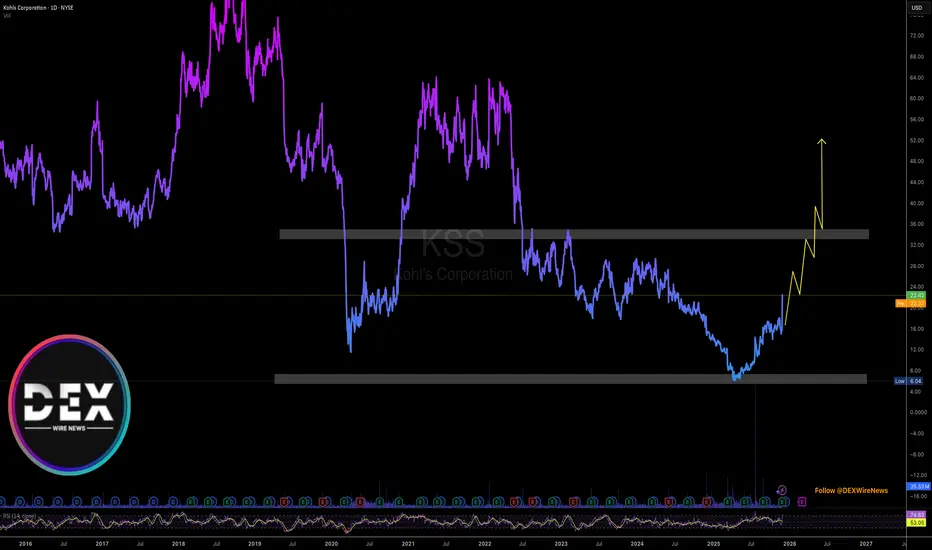
Breaking; Kohl's Corporation (KSS) Spike 42% On Earnings BeatKohl's Corporation (NYSE: KSS) shares soared Tuesday after the retailer reported a surprise profit and better-than-expected sales, a day after removing the "interim" tag from CEO Michael Bender's title.
The company said Tuesday it earned an adjusted $0.10 per share, well above the $0.19 adjusted loss per share that analysts had projected, according to estimates compiled by Visible Alpha. Revenue came in at $3.58 billion and comparable store sales fell 1.7% from the same time a year ago, each better than Wall Street had anticipated.
The stock gained 43% to finish the session at $22.42, its highest level since July 2024. This marked the second time this year that Kohl's shares gained about 40% in a single trading session. When it last happened in July, the stock seemed to have become the latest meme play, as that surge came in the absence of any news.
Financial Performance
In 2024, Kohl's's revenue was $16.22 billion, a decrease of -7.18% compared to the previous year's $17.48 billion. Earnings were $109.00 million, a decrease of -65.62%.
Analyst Summary
According to 14 analysts, the average rating for KSS stock is "Sell." The 12-month stock price target is $12.54, which is a decrease of -47.01% from the latest price.
About KSS
Kohl's Corporation operates as an omnichannel retailer in the United States. It offers apparel, footwear, accessories, beauty products, and home products through its stores and website. The company provides its products primarily under the brand names of Apt. 9, Croft & Barrow, Jumping Beans, SO, Sonoma Goods for Life, and Tek Gear, as well as LC Lauren Conrad, Nine West, and Simply Vera Vera Wang. Kohl's Corporation was founded in 1988 and is headquartered in Menomonee Falls, Wisconsin.
NVO Turns Bearish! Clean Breakdown Below Weighted MA💼🐻 NVO Bearish Playbook — Weighted MA Breakdown | Thief Layered Sell Setup
🚨 Asset: NVO – Novo Nordisk (NYSE)
📝 Style: Swing / Day Trade Profit Playbook
📉 Bias: Bearish momentum confirmed after Weighted Moving Average (WMA) breakout
📉 Trade Plan — Clean Bearish Setup Activated
The bearish structure is confirmed as price breaks under the Weighted Moving Average, signaling that upside power is weakening and sellers are gaining full control. Momentum, structure, and trend all align for a controlled downside thief-style opportunity 😈📉
🎯 Thief Layered Entry Strategy (Professional Version)
Thief strategy = multiple staggered limit orders to catch premium fill levels.
Here’s the setup ⬇️
🔥 Sell Limit Layers:
49.00
48.00
47.00
46.00
(You can extend or increase layers based on your own risk preferences. Thief OG’s know the drill 😎🕶️)
👉 Any price level is allowed — this is a flexible layering system designed for optimal fills when liquidity sweeps occur.
🛑 Stop Loss — Thief Escape Hatch
SL @ 52.00
⚠️ Dear Ladies & Gentlemen (Thief OG’s):
This SL is not a recommendation — trade your own plan, adjust based on your personal risk. You make the money; you take the money at your own risk. Stay sharp 🦊📛
💰 Target Zone — Police Barricade Support Zone
Police barricade = strong support area + oversold pocket + liquidity trap potential 🚧🎯
📌 Final Target: 36.00
⚠️ Again, dear Thief OG’s:
TP is your own choice — this is not a fixed recommendation. Manage profits based on your strategy and risk appetite.
📊 Key Notes for Traders
Bearish momentum confirmed through WMA breakdown
Layered entries help reduce overall cost and increase probability of catching liquidity spikes
Target aligns with strong historical support + oversold metrics
SL placed above structural invalidation & liquidity pocket
🌍 Related Markets to Watch (Correlation & Behavior)
These pairs/stocks often react with similar flows due to healthcare sector momentum and large-cap institutional rebalancing:
🩺 Healthcare Stocks to Watch:
NYSE:LLY (Eli Lilly) → Strong correlation in pharma trend rotations
NYSE:PFE (Pfizer) → Tracks sentiment in healthcare risk cycles
NYSE:MRK (Merck) → Often mirrors sector weakness or defensive flows
📈 Broader Market Influence:
AMEX:SPY → Large-cap direction impacts NVO’s liquidity flow
AMEX:XLV (Healthcare ETF) → Best sector barometer for confirmation
NASDAQ:QQQ → Tech risk-on cycles can reduce defensive pharma demand
🧩 Key Correlation Points:
Defensive sectors weaken → Pharma tends to retrace deeper
Strength in USD → Pressure on foreign-listed healthcare stocks
Broad risk-off → Market-wide liquidity tightening supports bearish setups
✨ “If you find value in my analysis, a 👍 and 🚀 boost is much appreciated — it helps me share more setups with the community!”
🔒 Disclaimer: This is a thief-style trading strategy just for fun. Trade at your own risk.

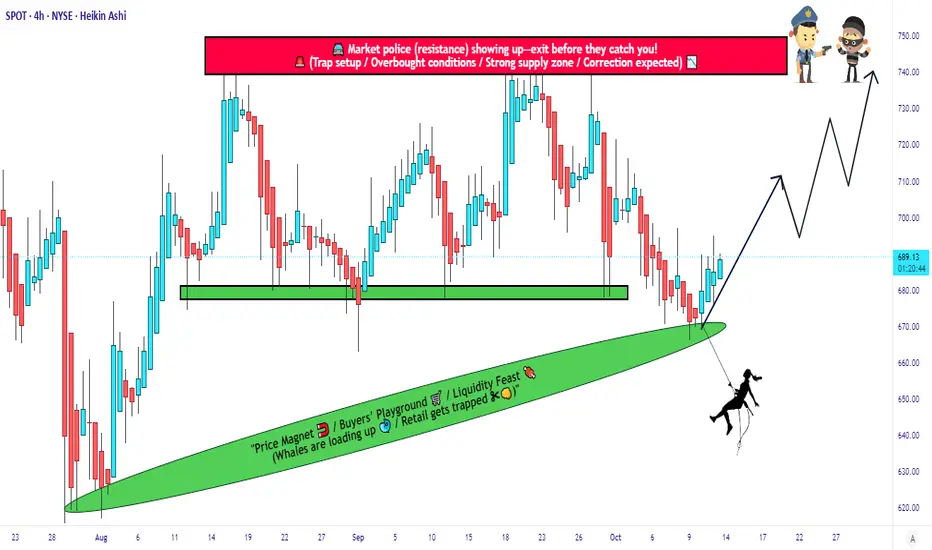
SPOT Price Action | Strong Support, Tight Stop, Open Target!🎧 SPOT | Thief Trader Profit Playbook 💰
“When Music Meets Money — Spotify’s Chart Is About to Drop Beats & Gains!” 🎵📈
🧭 Plan:
Bullish Bias — Thief-style layered accumulation for a smart entry!
We’re eyeing SPOT (Spotify Technology S.A.) for a potential swing/day trade move north.
🎯 Entry (Layering Strategy)
💎 The Thief Strategy uses multiple limit layers to build a strong position.
Here’s the sneak-in setup (choose your own comfort):
🧩 Buy Limit 1 → $670
🧩 Buy Limit 2 → $680
🧩 Buy Limit 3 → $690
(You can expand layers based on your risk appetite — remember, thieves adapt!) 😎
🛑 Stop-Loss (Thief’s Safe Escape)
This is the Thief SL @ $650
⚠️ Note: Dear Ladies & Gentlemen (Thief OG’s), this is not a fixed SL — trade smart, manage your own risk. You make money → you take money. 💼
🎯 Target Zone (Police Barricade 🚓)
Target: Around $740
The chart shows a strong resistance + overbought area + possible trap zone — that’s where the police barricade is! 🚧
Escape with profits before they catch your bags! 💨💰
⚠️ Note: Again, Thief OG’s — this is a flexible TP zone, not financial advice. Secure your profits when the opportunity sings! 🎤📊
🧩 Correlated Pairs to Watch ($)
Keep an eye on these correlated tickers for extra confirmation or sentiment cues:
NASDAQ:NFLX → Streaming sector momentum 🎬
NASDAQ:AAPL → Tech sentiment driver 🍏
NASDAQ:MSFT → Market leader correlation 🖥️
NASDAQ:META → Digital ad revenue influence 💬
NASDAQ:QQQ / AMEX:SPY → Index health check 💪
These tickers often dance together in the same rhythm — when the tech sector grooves, SPOT follows the beat! 🕺
⚙️ Technical Key Points:
Bullish structure holding above $650 zone support 🧱
Momentum strengthening after pullback retest 🎢
RSI mid-zone recovery — not yet overbought, potential room to run! 📈
Volume showing accumulation footprints 👣
✨ If you find value in my analysis, a 👍 and 🚀 boost is much appreciated — it helps me share more setups with the community!
⚠️ Disclaimer:
This is a Thief-style trading strategy, shared for educational & fun purposes only.
Trade responsibly. I’m not your financial advisor — I’m your chart burglar! 😜💼
#SPOT #Spotify #SwingTrade #DayTrade #StockMarket #ThiefTrader #LayeringStrategy #TechnicalAnalysis #BullishSetup #TradingView #EditorPick #ProfitPlaybook #SPY #QQQ #NASDAQ #StocksToWatch
TWLO - Downtrend line BROKEN!TWLO - CURRENT PRICE : 134.88
The chart shared here is the weekly chart, where TWLO broke above its downtrend line with strong volume — a signal of growing bullish momentum. On the daily chart, TWLO formed a rising window (gap-up) last Friday — a bullish signal that often indicates strong buying momentum and potential continuation of the uptrend.
From a pattern analysis perspective, some traders may interpret the current setup as a bullish symmetrical triangle, indicating potential continuation to the upside. Next target will be 154.00 and 174.00. Support level is 114.73 (the low of window area based on daily chart).
ENTRY PRICE : 132.00 - 135.00
FIRST TARGET : 154.00
SECOND TARGET : 174.00
SUPPORT : 114.73 (CUTLOSS below this level on closing basis)

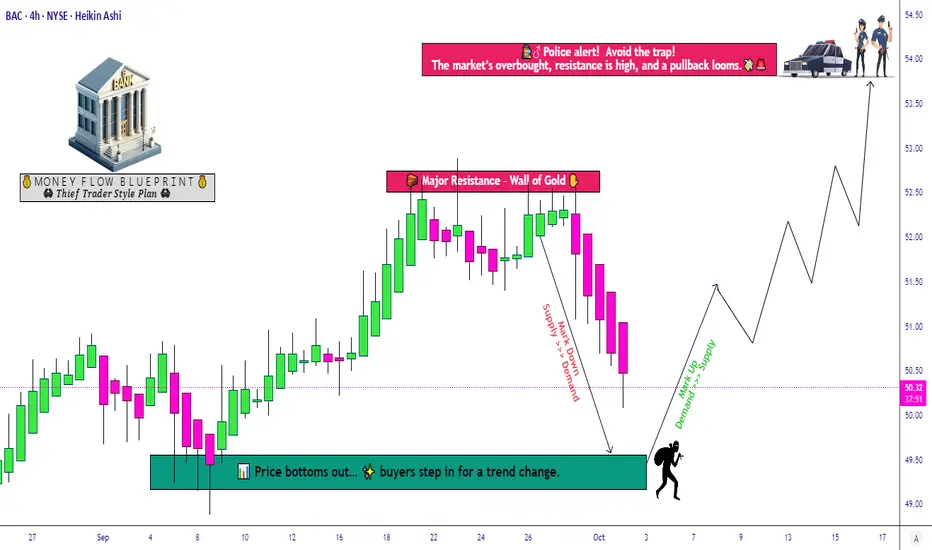
BAC Swing Trading Strategy – Bearish Dip Turning Bullish Soon!🔥 BAC “Bank of America” – Thief Wealth Strategy Map (Swing/Day Trade) 💼📉➡️📈
📊 Plan: Bearish to Bullish Reversal Setup
Entry: You can enter at any price level (flexible strategy 🕶️).
Stop Loss (SL): Thief-style SL @ 48.50 🛑💔
⚠️ Dear Ladies & Gentlemen (Thief OG’s), I’m not recommending to use only my SL. It’s your choice. Manage your risk like a boss and protect your bag.
Target (TP): Strong resistance + overbought trap zone 🚧 — escape with profits @ 54.00 🎯💸
⚠️ Dear Ladies & Gentlemen (Thief OG’s), I’m not recommending to use only my TP. Take money when you see money — at your own risk.
🧩 Key Thief Notes:
Market psychology points to a bearish shakeout ➡ bullish trap escape move.
BAC is currently in a range between demand & supply zones — liquidity hunting zone 🎯.
Overbought conditions may trigger profit-taking → watch carefully for reversal signals.
🔗 Related Assets to Watch (Correlation Play):
NYSE:JPM (JPMorgan Chase) – strong sector leader, moves often lead BAC.
$C (Citigroup) – tracks similar banking flows.
AMEX:XLF (Financial Select Sector ETF) – index-level financial exposure.
AMEX:SPY (S&P 500 ETF) – overall risk sentiment affects banking stocks heavily.
TVC:DXY (US Dollar Index) – stronger USD can weigh on financial stocks.
TVC:TNX (US 10Y Yield) – bond yields = big driver for bank profitability.
📌 Tip: Watch AMEX:XLF & TVC:TNX closely. Rising yields = positive for banks, while falling yields can slow momentum.
✨ “If you find value in my analysis, a 👍 and 🚀 boost is much appreciated — it helps me share more setups with the community!”
⚠️ Disclaimer: This is a Thief-style trading strategy, shared just for fun & educational vibes. Not financial advice. Trade at your own risk.
#BAC #BankofAmerica #StockMarket #SwingTrade #DayTrade #XLF #JPM #C #SPY #FinancialSector #ThiefTrader #Stocks
Oklo slides to the downside - Watch for the next levels In this video I cover the next important levels for Oklo during what I perseve as being the start
of a correction after pushing up some 900% over the past 5 months .
Tools used Fibs, Pivots, TPO chart and Volume Profile

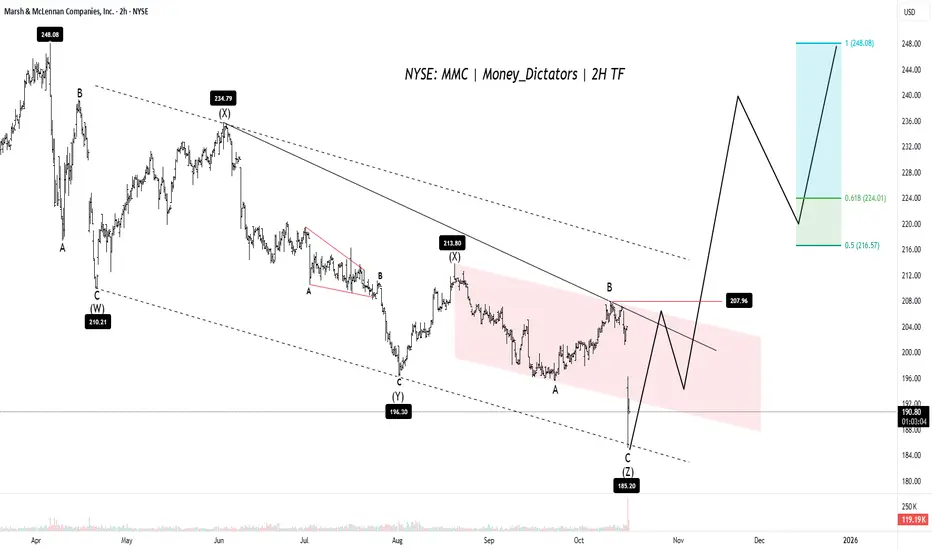
What Should You Expect From MMC?MMC is nearing the end of a recent price drop. The price is currently in its final downward phase, expected to bottom out around $184 to $186. Targets are 219, 234 & 245. Bulls can take control at wave B point(Resistance - $207).
If the price successfully holds above this $184–$186 support, the analysis predicts it will trigger a new, major upward trend. To officially confirm that the correction is over and a strong bullish trend has begun, the stock needs to break out above the $207 to $210 level. Once that breakout happens, the price is expected to rise sharply, potentially hitting the previous high of $248.
However, if the price drops below $184, this positive outlook will be invalidated, and the stock is expected to continue its downward correction.
Stay Tuned! Thank you:)
@Money_Dictators
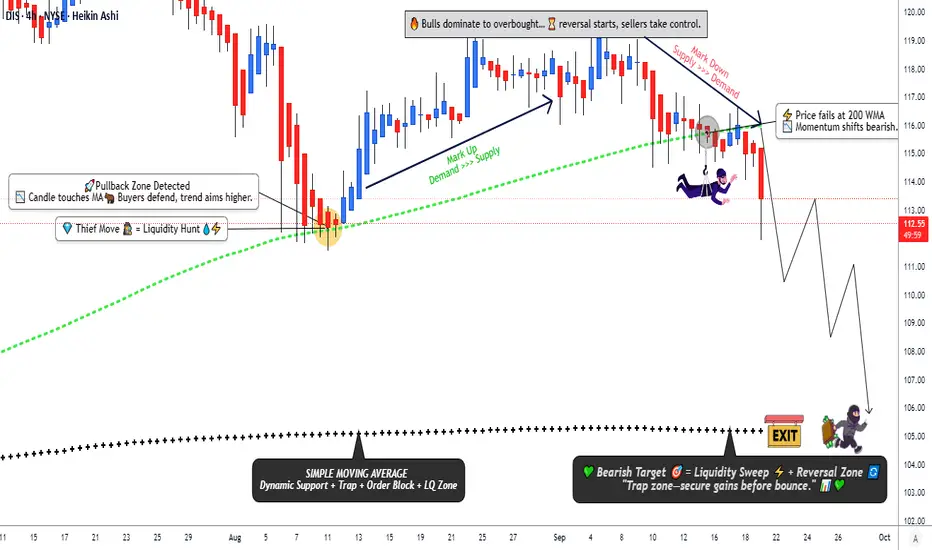
DIS Technical Breakdown – Bearish Trend Gains Momentum🎭 DIS – Walt Disney Company | Thief’s Cash Flow Management Strategy 🏰💸
Hello, Ladies & Gentlemen, welcome to the Thief OG trading crew! 😎 Ready to swipe some profits from the Walt Disney Company (DIS) stock? Let’s break down this bearish swing/day trade strategy with a sprinkle of fun and a whole lot of market swagger. 🚀 Let’s dive into the magic of cash flow management with a layered limit order approach! 🎥
📊 Asset: Walt Disney Company (DIS)
Market: NYSE
Strategy: Swing/Day Trade
Bias: Bearish 🐻
Why?: The 200-period Weighted Moving Average (WMA) has been breached by sellers, confirming a downtrend. The bears are running the show, and we’re ready to join the party! 🎉
🕵️♂️ The "Thief Strategy" Plan: Layered Limit Orders
Our Thief Strategy is all about sneaking in profits with a layered limit order approach. Think of it like setting multiple traps to catch the best entry points. 🪤 Here’s how we roll:
Entry Points: Place multiple sell limit orders to layer your entries. Suggested levels:
$116.00 📉
$115.00 📉
$114.00 📉
$113.00 📉
Pro Tip: Feel free to add more layers based on your risk appetite! Stack those entries like a master thief planning a heist. 😏
Entry Flexibility: You can enter at any price level within this range if you spot a good opportunity. Stay nimble, Thief OGs!
🛑 Stop Loss: Protect Your Loot
Thief Stop Loss: Set at $118.00. This is our safety net to keep the bears from stealing our cash! 🛡️
Note: Dear Thief OGs, this stop loss is my suggestion, but it’s your trade! Adjust based on your risk tolerance and make those profits at your own pace. 💸
🎯 Target: Cash Out Before the Trap!
Profit Target: Aim for the $105.00 level, where the 786-period Simple Moving Average (SMA) acts as strong support. 📈
Why?: This level shows oversold conditions and a potential bear trap. Escape with your profits before the market flips the script! 🏃♂️
Note: Thief OGs, this is my target, but you’re the boss of your trades. Take profits when it feels right for you! 💪
🔗 Related Pairs to Watch
To make the most of this DIS setup, keep an eye on these correlated assets (all in USD):
NASDAQ:NFLX (Netflix): As a competitor in the streaming and entertainment space, Netflix often moves in tandem with DIS. A bearish move in DIS could signal similar pressure in NFLX, especially if market sentiment sours on streaming stocks. 📺
NASDAQ:CMCSA (Comcast): Another media giant with theme park and content exposure. Watch for bearish momentum in CMCSA to confirm broader sector weakness. 🏰
AMEX:SPY (S&P 500 ETF): DIS is a major component of the S&P 500. If the broader market is bearish, it could amplify DIS’s downtrend. Keep SPY on your radar for macro context. 📊
Key Correlation Insight: DIS, NFLX, and CMCSA often react to similar catalysts like consumer spending trends, streaming subscriber growth, or theme park revenue. A bearish move in DIS could be a signal to check these pairs for shorting opportunities or confirmation of sector weakness. 🔍
⚠️ Disclaimer
This Thief Style trading strategy is just for fun and educational purposes! 😜 Trading involves risks, and I’m not a financial advisor. Always do your own research (DYOR) and trade at your own risk. Steal profits, not your peace of mind! 🕵️♂️
✨ “If you find value in my analysis, a 👍 and 🚀 boost is much appreciated — it helps me share more setups with the community!”
Hashtags:#DIS #StockMarket #SwingTrading #DayTrading #Bearish #ThiefStrategy #TechnicalAnalysis #TradingView #StockPicks #CashFlow
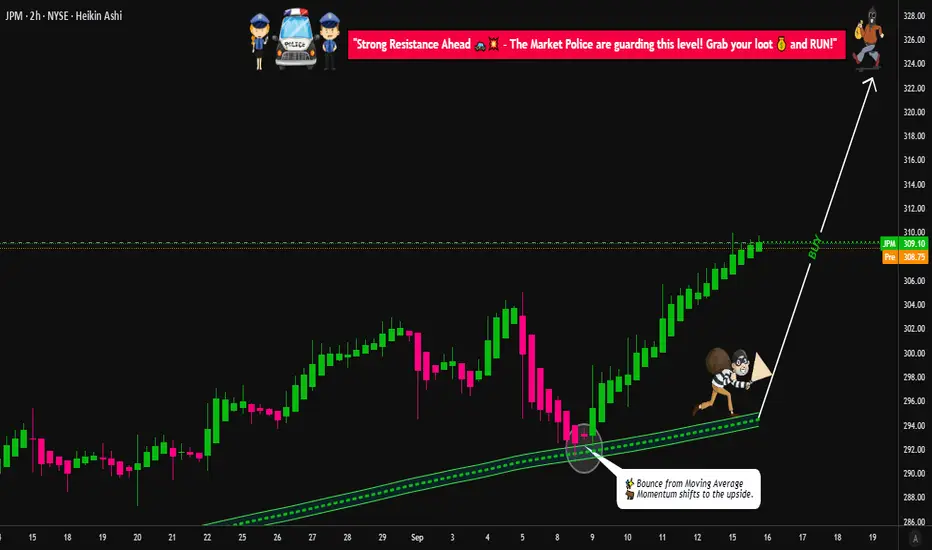
JPM Swing Plan → Layered Entries & Profit Targets Mapped😂 JPMorgan Chase (JPM) Swing/Day Trade: The Great Heist Blueprint 🤑💰
🚀 Asset: JPMorgan Chase & Co. ( NYSE:JPM )🎯 Market Profit Realization Plan: Swing/Day Trade📈 Outlook: Bullish vibes confirmed! 💪
📜 The Setup: Why JPM is Ready to Pop! 🎉
Bullish Confirmation: The chart is screaming BULLISH! 📈 A clean pullback to the moving average shows institutional big dogs 🐶 holding strong. This isn’t just a random pump — it’s a calculated move!
Market Context: JPM’s price action shows resilience, with buyers stepping in at key levels. The moving average is acting like a trusty springboard for the next leg up. 🏀
🕵️♂️ The Thief Strategy: Layered Entries for Max Gains! 🏦
Dear Ladies & Gentlemen, Thief OGs 😎, here’s how we pull off this heist with style:
Entry Plan: Use a layering strategy with multiple limit orders to stack your position like a pro. 🧱
Suggested buy limit layers: $302, $304, $306, $308, $310.
Pro Tip: Feel free to add more layers based on your risk appetite and account size! More layers = more flexibility. 🥞
New traders? You can enter at any price level within this range — the trend is your friend! 🤝
Why Layering?: This strategy lets you scale into the trade, reducing risk while catching the move. It’s like sneaking into the vault with multiple keys! 🔑
🛑 Stop Loss: Protect Your Loot! 💼
Thief SL: Set your stop loss at $298, just below the breakout level to dodge any fakeouts. 🕳️
Note: Dear Thief OGs, this SL is a suggestion. Adjust it based on your strategy and risk tolerance. You’re the mastermind of your own heist! 🧠
Risk Management: Never risk more than you’re willing to lose. Protect your hard-earned cash! 💸
🎯 Target: Cash Out Before the Trap! 🏃♂️
Profit Target: Aim for $325, where we expect strong resistance and potential overbought conditions. 📉
Why $325?: Historical resistance + overbought signals = a classic trap zone. Cash out your profits before the market pulls a fast one! 🪤
Note: Dear Thief OGs, this TP is a guideline. Take profits at your own discretion — secure the bag when you feel it’s right! 💰
🔗 Related Pairs to Watch (with $ Correlations) 👀
Keep an eye on these financial sector buddies to gauge market sentiment:
NYSE:BAC (Bank of America): Moves in tandem with JPM as a fellow banking giant. If BAC is pumping, it’s a good sign for JPM! 📈
Correlation: High positive correlation (~0.8). Strong financial sector momentum often lifts both.
NYSE:WFC (Wells Fargo): Another banking heavyweight. Watch for similar price action to confirm sector strength. 🏦
Correlation: Moderate positive correlation (~0.7). WFC’s moves can signal broader banking trends.
AMEX:XLF (Financial Select Sector SPDR Fund): Tracks the financial sector as a whole. If XLF is bullish, it’s a tailwind for JPM! 🌬️
Correlation: Strong positive correlation (~0.85). XLF’s direction often sets the tone for JPM’s price action.
Key Point: Monitor these pairs for confirmation of JPM’s bullish move. If they’re lagging, proceed with caution — the heist might need a backup plan! 🕵️♀️
✨ If you find value in my analysis, a 👍 and 🚀 boost is much appreciated — it helps me share more setups with the community!
#TradingView #JPM #StockMarket #SwingTrading #DayTrading #TechnicalAnalysis #ThiefStrategy #Bullish
GME Market Strategy: Risk-Managed Swing to Resistance🚨 GME: GameStop's Great Heist! 🎮💰 Bullish Swing/Day Trade Plan
Asset: GameStop Corporation (GME)Market: NYSE (Stock)Strategy: Swing/Day Trade with a "Thief's Layered Limit Order" Approach 😎
Get ready, traders! We're about to pull off a bullish heist on GameStop (GME) with a slick, calculated plan to outsmart the market! 📈 This setup is packed with technical firepower and a cheeky vibe to keep it fun yet professional. Let’s dive into the Thief’s Wealth Strategy Map and steal some profits! 🕵️♂️
📊 Technical Breakdown: Why GME is Ripe for the Taking
Our bullish setup is backed by a rock-solid technical foundation. Here’s the intel:
🔥 382 EMA Breakout: GME has smashed through the 382-period Exponential Moving Average, signaling strong bullish momentum. This breakout is our green light for action! 🚦
💥 Accumulation Zone Pressure: Buyers are stacking up in the accumulation zone, pushing prices upward like a crew of bullish bandits ready to raid the market.
🕯️ Heikin Ashi Reversal Candle: A gorgeous bullish Heikin Ashi candle has emerged, screaming BUYING POWER and confirming the trend reversal. The bulls are in control! 🐂
🗝️ Thief’s Edge: We’re using a layered limit order strategy to sneak into the market at multiple price points, maximizing our entry precision.
🕵️♂️ The Thief’s Entry Plan: Layered Limit Orders
This isn’t your average “buy and pray” strategy. We’re using a layered limit order approach to enter like sneaky market thieves. Set your buy orders at these levels:
🪙 $24.00
🪙 $24.50
🪙 $25.00
🪙 $25.50
🪙 $26.00
Pro Tip: Feel free to add more layers based on your risk appetite and account size. The more layers, the merrier the heist! 😜 You can also enter at any price level within this range if you prefer a single strike. Just keep it sharp and calculated!
🛑 Stop Loss: Protect Your Loot
🛡️ Set your stop loss at $23.00 to guard against unexpected market traps. ⚠️
Note: Dear Ladies & Gentlemen (Thief OGs), this is my suggested stop loss, but it’s your heist! Adjust it to suit your risk tolerance. Trade smart, and don’t get caught by the market cops! 👮♂️
🎯 Target: Cash Out Before the Barricade!
🎰 Our profit target is $31.00, where a police barricade zone (aka strong resistance) awaits. This level is flagged as overbought with a potential trap for greedy thieves. 🪤 Escape with your profits before the market clamps down!
Note: Thief OGs, this is my target, but you’re the boss of your trades. Take profits at your own discretion and secure the bag! 💸
🔗 Related Pairs to Watch (Correlated Assets)
To maximize your market intel, keep an eye on these correlated assets (all in USD):
🎥 NYSE:AMC Entertainment (AMC): Another meme stock darling, often moving in tandem with GME. Watch for similar bullish setups or divergences.
📊 AMEX:SPY (S&P 500 ETF): GME’s wild swings can be influenced by broader market sentiment. If SPY is bullish, GME’s momentum could get an extra boost!
📱 NYSE:BB (BlackBerry): Another retail-favorite stock with potential for correlated volatility. Check for breakout patterns here too.
Key Correlation Points:
🚀 NYSE:GME and NYSE:AMC : Often ride the same retail-driven waves, especially during short squeezes or social media hype.
⚖️ AMEX:SPY Influence: If SPY shows weakness, GME’s bullish momentum might face resistance. Stay alert!
🔍 NYSE:BB as a Signal: If BlackBerry is pumping, GME might follow suit.
📝 Final Notes for the Heist
This is a high-octane, bullish setup designed for swing or day traders with a taste for calculated risk. The Thief’s Layered Limit Order Strategy gives you flexibility to enter the market like a pro, while the technicals (382 EMA breakout, Heikin Ashi, and accumulation pressure) provide a solid foundation. 🏦
Stay sharp, manage your risk, and don’t get greedy—escape with your profits before the market throws up a barricade! 🚓
✨ “If you find value in my analysis, a 👍 and 🚀 boost is much appreciated — it helps me share more setups with the community!”
#Hashtags: #GME #StockMarket #SwingTrading #DayTrading #Bullish #TechnicalAnalysis #TradingStrategy #MemeStocks

UNH Stock Technical Outlook – Bullish Momentum Confirmed😎 UNH Wealth Heist: Swing Trade Strategy Map 🤑💰
Asset: UnitedHealth Group Incorporated ( NYSE:UNH )
Market: US Stock
Market Strategy: Swing Trade (Thief Style 🕵️♂️)
📈 The Setup: Bullish Breakout in Sight! 🚀
Ladies and Gentlemen, welcome to the Thief OG playbook! 📖 NYSE:UNH is setting up for a potential bullish run, and we’re ready to layer our entries like masterminds! 🧠 Here’s the breakdown of this sneaky swing trade setup:
🌟 Bullish Trend Confirmation: The chart is screaming uptrend! We’ve got strong upside pressure from a demand zone 📍, signaling buyers are ready to pounce.
✨ Golden Cross Alert: The Hull Moving Average (HMA) at 786 periods has crossed above the price candles, confirming a bullish momentum shift. 🚀
🐍 Re-accumulation Phase: The stock is consolidating, building energy for the next leg up. It’s like NYSE:UNH is coiling for a big breakout! 💥
🕵️♂️ Entry Plan: The Thief Layering Strategy 🎯
We’re not just entering; we’re layering our entries like pros! 😎 The Thief Strategy uses multiple buy limit orders to scale into the trade with precision. Here’s how to set it up:
📊 Entry Levels: Place buy limit orders at $320.00, $330.00, $340.00, $350.00.
Pro Tip: Feel free to add more layers based on your risk appetite and account size! More layers = more chances to catch the move.
🔍 Why Layering?: This method spreads your entry across key support levels, reducing risk and maximizing potential. It’s like planting multiple traps for profits! 🪤
🛑 Stop Loss: Protect Your Loot! 🔒
🛡️ Thief Stop Loss: Set a stop loss at $300.00.
📝 Note: Dear Thief OGs, this is my suggested stop loss, but it’s your heist! Adjust based on your risk tolerance. Take the money and run at your own discretion! 😏
🎯 Target: Cashing Out Like a Boss 💸
💰 Profit Target: Aim for $420.00, where the Simple Moving Average (SMA) acts as a strong resistance.
⚠️ Why This Level?: The SMA has historically capped rallies, and we’re seeing signs of overbought conditions with a potential trap for late buyers. Escape with your profits before the trap springs! 🏃♂️
📝 Note: As always, Thief OGs, this is my suggested target. You decide when to pocket the gains — it’s your heist, your rules! 😎
👀 Related Pairs to Watch 🔎
To keep your eyes on the market’s pulse, here are correlated assets to monitor alongside NYSE:UNH :
📈 NYSE:CI (Cigna Corporation): Another healthcare giant, often moves in tandem with NYSE:UNH due to sector trends. Watch for similar bullish setups or divergences. 🩺
📊 NYSE:HUM (Humana Inc.): A key player in the health insurance space, showing high correlation with $UNH. If NYSE:HUM breaks out, it could confirm NYSE:UNH ’s move. 🚀
📡 AMEX:XLV (Health Care Select Sector SPDR Fund): This ETF tracks the broader healthcare sector. A bullish AMEX:XLV strengthens the case for NYSE:UNH ’s rally. 🌟
Key Correlation Point: NYSE:UNH , NYSE:CI , and NYSE:HUM often react to healthcare policy news, earnings cycles, and sector sentiment. Keep an eye on AMEX:XLV for broader sector confirmation. If AMEX:XLV is pumping, NYSE:UNH is likely to follow! 📊💥
📝 Final Notes for the Heist
This setup is designed for Thief OG traders who love a calculated, stylish swing trade. The layering strategy gives you flexibility, the bullish signals provide confidence, and the target keeps it profitable. But always remember: trade at your own risk, and don’t get caught in the market’s traps! 😜
✨ “If you find value in my analysis, a 👍 and 🚀 boost is much appreciated — it helps me share more setups with the community!”
Disclaimer: This is a Thief Style trading strategy, crafted for fun and educational purposes. Always do your own research and manage your risk. Trading involves risks, and I’m not responsible for any losses. Stay sharp, Thief OGs! 🕵️♂️
#UNH #SwingTrade #LayeredEntry #ThiefStrategy #StockMarket #HealthcareStocks #TradingIdeas #BullTrend #TechnicalAnalysis #GoldenCross #MarketWealthMap #TradingView
Dell Stock Idea – Bullish Outlook With Layered Entries💰 Dell Technologies INC: The Great Stock Market Heist Plan (Swing/Day Trade) 💰
🎯 Asset: Dell Technologies INC (DELL)🎭 Vibe: Bullish Bandits on the Move! The Simple Moving Average (SMA) is flashing green, confirming a buy trend, and the big institutional players are piling in. Time to join the heist with the market's heavy hitters! 🚀
📜 The Heist Plan: Bullish Breakout with a Thief’s Flair
🔍 Why DELL?The SMA is screaming "BUY," and institutional buyers are sneaking in like pros. We’re tailing the big players with a slick Thief Layering Strategy to maximize our loot. Here’s how we execute this caper:
Entry: 🕵️♂️ Thief Layering StrategyDeploy multiple buy limit orders to stack the deck in your favor:
🎯 $120.00
🎯 $122.00
🎯 $124.00
🎯 $126.00
Pro Tip: Add more layers based on your risk appetite and market conditions. Be the sneakiest thief in the game! 😎
Stop Loss (SL): 🚨 $118.00Set this SL after the breakout at the mentioned price levels to protect your stash. Dear Ladies & Gentlemen (Thief OGs), adjust your SL based on your strategy and risk tolerance. This isn’t a one-size-fits-all heist—own your escape plan! 🏃♂️
Targets: 🤑 Police Barricade Ahead!Watch out for strong resistance and overbought zones where traps lurk. Escape with your profits at:
Primary Target: $134.00
Secondary Target: $142.00Note: Dear Thief OGs, these are suggested targets. Grab your loot when it feels right—your heist, your rules! 💸
⚠️ Thief’s Code of Honor
Dear Ladies & Gentlemen (Thief OGs), I’m not here to dictate your SL or TP. This is your heist—make your moves and take your profits at your own risk. Stay sharp, stay safe, and don’t get caught! 😜
🔗 Related Pairs to Watch
To make this heist even smoother, keep an eye on these correlated assets (all in USD):
HP Inc. ( NYSE:HPQ ): Moves in tandem with DELL as a tech hardware peer. If HPQ is pumping, it’s a good sign for DELL’s bullish run.
NVIDIA ( NASDAQ:NVDA ): Tech giant with strong correlation to DELL due to AI and data center trends.
NVDA’s strength could fuel DELL’s breakout.
S&P 500 Index ( AMEX:SPY ): DELL often rides the broader market wave. If SPY is bullish, it’s a tailwind for our heist.
Key Correlation Insight: DELL’s performance is tied to tech sector momentum and institutional buying in AI/data center stocks. Watch NVDA and HPQ for confirmation of DELL’s bullish trend, and keep SPY on your radar for market sentiment.
🛠️ Why This Setup Works
✅ Technical Confirmation: The SMA signals a clear bullish trend, giving us the green light.
✅ Institutional Backup: Big players are entering, so we’re riding their coattails.
✅ Layered Entries: Multiple limit orders reduce risk and increase flexibility.
✅ Defined Escape Plan: Clear SL and TP levels keep us ahead of the market’s “police.”
📝 Disclaimer
This is just a fun vibe and not financial advice! Trading is risky, and you should always do your own research and consult with a professional before making any moves. Stay sharp, Thief OGs! 😎
✨ If you find value in my analysis, a 👍 and 🚀 boost is much appreciated — it helps me share more setups with the community!
#TradingView #DELL #StockMarket #SwingTrading #DayTrading #Bullish #ThiefStrategy #TechnicalAnalysis
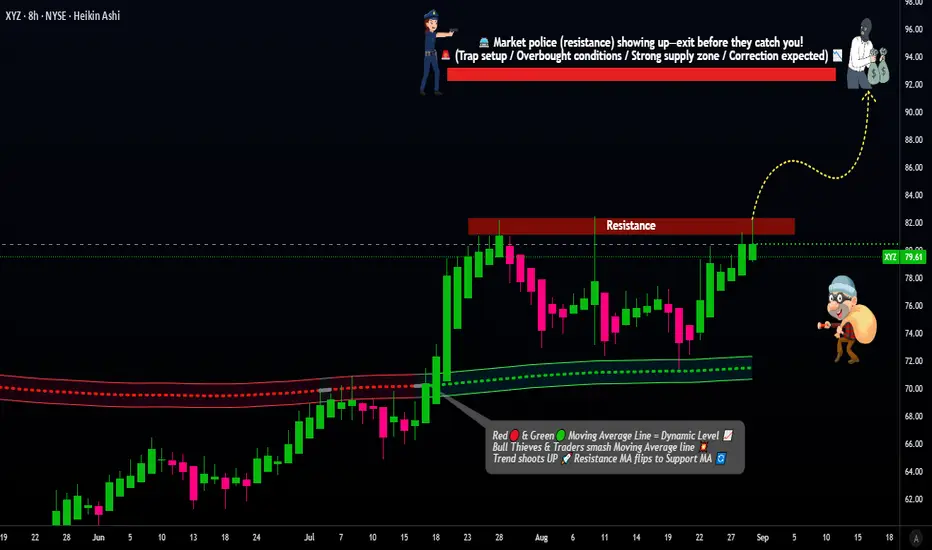
XYZ Bullish Setup: Pending Entry & Target Strategy!📌 Asset & Plan
XYZ (Block, Inc.) NYSE | Swing/Day Trade
Plan: Bullish 💹 (Pending Order Setup)
Breakout Entry: Near $83.00 ⚡ (Set alerts to catch the breakout!)
🧩 Thief-Style Layer Strategy
Multiple limit layer entries after breakout: $82.00 / $80.00 / $78.00
Scale your positions according to your risk appetite and strategy 📈
Stop Loss: $74.00 (adjust as per your risk) ⚠️
Target: $92.00 🏁
📊 Real-Time Market Snapshot (Sep 1, 2025)
Current Price: $79.64
52-Week Range: $46.53 - $98.92
🧠 Investor Sentiment
Retail: Moderately Bullish (60% Greed) 🟢
Institutional: Cautiously Optimistic (55% Greed) 🟡
Fear & Greed Index: Neutral → Greed (58/100) 📊
💹 Fundamental & Macro Highlights
Fundamentals (6.5/10) ✅
Undervalued by ~29% (Intrinsic Value: $111.64)
EPS Growth (2026 Est.): +39.49% YoY
Revenue Growth (2025 Est.): +2.92% YoY
Strong solvency & healthy gross margins
Macro Environment (6/10) 🌍
Market Volatility: Low
Safe Haven Demand: Moderate
Interest Rates: Stable (Fed rate cuts expected late 2025)
🐂 Overall Market Outlook
Bullish Score: 65% 🟢 (S&P 500 inclusion & strong analyst targets)
Bearish Risks: 35% 🔴 (slowing revenue growth & competition pressures)
💡 Bottom Line
XYZ is undervalued with moderate bullish sentiment. Use layered entries to optimize risk/reward, set alerts for breakout, and monitor macro factors. 🚀
#NYSE #StockTrading #SwingTrade #DayTrade #BullishSetup #BreakoutAlert #LayerStrategy #XYZStock #TechnicalAnalysis #MarketInsights #TradingIdeas