EUR/USD | Going to the bearish breaker (READ THE CAPTION)Good afternoon folks, Amirali here.
As you can see in the hourly chart of EURUSD, in the early hours of today, it reached the Bullish OB zone, then Swept the liquidity pool and then went up, hitting the IFVG and then gone above it, now being traded at 1.1796.
I'm eying the Bearish Breaker for a potential reversal. However if it goes through the bearish breaker, the targets are: 1.1805, 1.812, 1.819 and 1.1826.
If it reacts to the Bearish Breaker, the targets are: 1.1790, 1.1784, 1.1778 and 1.1772.
NZDUSD

NZDUSD: false breakout setup🛠 Technical Analysis: On the H4 chart, NZDUSD remains in a broader bullish structure after the earlier “global bullish signal” from the base. The recent pullback formed a corrective descending channel, but the latest dip produced a clear false breakout below the lower boundary. Price has now reclaimed the key demand area around 0.5989–0.5991, turning it back into near-term support. The pair is holding above the rising SMA100 and SMA200, suggesting the short-term trend is still constructive despite the correction. A sustained hold above the reclaimed support increases the odds of a push back to the upper resistance zone near 0.6086. If price slips back below 0.5989 and fails to recover quickly, the bullish scenario weakens and the move could extend toward lower supports.
———————————————
❗️ Trade Parameters (BUY)
———————————————
➡️ Entry Point: 0.59893
🎯 Take Profit: 0.60857
🔴 Stop Loss: 0.59255
⚠️ Disclaimer: This is a potential trade idea based on current analysis; market conditions and price direction are subject to change based on news factors and volatility.

NZD-USD Free Signal! Sell!
Hello,Traders!
NZDUSD
Price reacts from a well-defined horizontal supply zone after a corrective pullback. Bearish displacement and acceptance below supply suggest smart money distribution, favoring continuation toward lower liquidity.
--------------------
Stop Loss: 0.6011
Take Profit: 0.5968
Entry: 0.5994
Time Frame: 3H
--------------------
Sell!
Comment and subscribe to help us grow!
Check out other forecasts below too!
Disclosure: I am part of Trade Nation's Influencer program and receive a monthly fee for using their TradingView charts in my analysis.

#NZD/USD Sell Trade Scenario.Here’s an up-to-date NZD/USD Sell trade outlook (technical + fundamental) to help you assess whether positioning for a Downside makes sense right now.
Thank You......

GBP/USD | Going up? (READ THE CAPTION)Last night, GBP Hit the Consequent Encroachment of the FVG, going as low as 1.3509, before making an upwards move now being traded at 1.3575, hitting the Consequent Encroachment of the FVG above. I don't want to see GBPUSD going lower to the Feb 6th NDOG below. Staying in the FVG before going for the FVG High is what I would like to see.
If GBP holds itself, the targets are: 1.3582, 1.3590, 1.3598 and 1.3606.
If it fails: 1.3562, 1.3554, 1.3546 and 1.3540.

NZDUSD Will Move Lower! Sell!
Please, check our technical outlook for NZDUSD.
Time Frame: 1h
Current Trend: Bearish
Sentiment: Overbought (based on 7-period RSI)
Forecast: Bearish
The market is approaching a key horizontal level 0.598.
Considering the today's price action, probabilities will be high to see a movement to 0.593.
P.S
The term oversold refers to a condition where an asset has traded lower in price and has the potential for a price bounce.
Overbought refers to market scenarios where the instrument is traded considerably higher than its fair value. Overvaluation is caused by market sentiments when there is positive news.
Like and subscribe and comment my ideas if you enjoy them!

NZDUSD BEARISH BREAKOUT|SHORT|
✅NZDUSD strong bearish displacement breaks below the prior supply PD array, confirming market structure shift. Expect a shallow retracement into the breakout zone before continuation toward sell-side liquidity. Time Frame 2H.
SHORT🔥
✅Like and subscribe to never miss a new idea!✅

AUD/USD | Where to next? (READ THE CAPTION)As you can see, after hitting the Consequent Encroachment of the Feb 2nd's NWOG, AUDUSD went back up from 0.6958 to 0.6990, and then dropped again just above the high of the NWOG, and is now being at 0.6970.
I expect AUDUSD to retest the IFVG, but before that it may fall back to the Feb 2nd NWOG.
If it holds above the NWOG, the targets are: 0.6978, 0.6988, 0.6998 and 0.7008.
If it fails to hold above the NWOG: 0.6966, 0.6958, 0.6950 and 0.6942.

USD/JPY | fall incoming? (READ THE CAPTOON)As you can see, after USDJPY hit the Bearish Breaker, it dropped from 154.88 to 152.88, hitting the Bullish OB and it started a bullish run then afterwards, going as high as 157.33, now being traded at 157.30.
I would like to see USDJPY reach the bearish breaker and then drop.
For now, the targets are: 157.21, 157.12, 157.03 and 156.94.

NZD/USD Bearish Confirmed , Are You Read For This Movement ?Here is my 2H Chart on NZD/USD , We Have A Fake Breakout and then the price Back below my old res and we have a very good bearish Price Action on 1 And 2 Hours T.F Also And that`s what happened with ( GBP/USD & EUR/USD ) Last Week , the price playing very good around my res and i`m waiting the price to retest the broken area again and give us a good bearish price action For the second time on smaller time frames to can get a confirmation to enter ,or we can enter now with half of our lot size cuz te price not far from the entry point but i prefer to wait the price to go back to retest the broken area to give me more confirmation , So i see it`s a good chance to sell this pair if it go up a little to retest the broken area and then we can sell it and targeting 100 to 150 pips . and if we have a daily closure again above my new res then this idea will not be valid anymore .
Reasons To Enter :
1- Perfect Breakout .
2- Clear Bearish Price Action .
3- Bigger T.F Giving Good Bearish P.A .
4 - Perfect 15 Mins Closure .
5- The Price Respect The Res Again .

NZDUSD H4 | Bullish Bounce Off Overlap SupportMomentum: Bullish
Price is currently above the ichimoku cloud.
Buy entry: 0.59972
- Overlap support
- 61.8% Fib projection
Stop Loss: 0.59602
- Multi-swing low support
Take Profit: 0.60457
- Multi-swing high resistance
High Risk Investment Warning
Stratos Markets Limited (fxcm.com/uk), Stratos Europe Ltd (fxcm.com/eu):
CFDs are complex instruments and come with a high risk of losing money rapidly due to leverage. 69% of retail investor accounts lose money when trading CFDs with this provider. You should consider whether you understand how CFDs work and whether you can afford to take the high risk of losing your money.
Stratos Global LLC (fxcm.com/en): Losses can exceed deposits.
Please be advised that the information presented on TradingView is provided to FXCM (‘Company’, ‘we’) by a third-party provider (‘TFA Global Pte Ltd’). Please be reminded that you are solely responsible for the trading decisions on your account. Any information and/or content is intended entirely for research, educational and informational purposes only and does not constitute investment or consultation advice or investment strategy. The information is not tailored to the investment needs of any specific person and therefore does not involve a consideration of any of the investment objectives, financial situation or needs of any viewer that may receive it. Past performance is not a reliable indicator of future results. Actual results may differ materially from those anticipated in forward-looking or past performance statements. We assume no liability as to the accuracy or completeness of any of the information and/or content provided herein and the Company cannot be held responsible for any omission, mistake nor for any loss or damage including without limitation to any loss of profit which may arise from reliance on any information supplied by TFA Global Pte Ltd.
Stratos Trading Pty. Limited (fxcm.com/au):
Trading FX/CFDs carries significant risks. FXCM AU (AFSL 309763), please read the Financial Services Guide, Product Disclosure Statement, Target Market Determination and Terms of Business at fxcm.com/au

NZD/USD | In the breaker zone (READ THE CAPTION)After reaching 0.6092 last week, NZDUSD dropped over 100 pips and now is being traded at 0.5985, having hit the Bullish Breaker and after piercing through the Breaker once, it dropped in the zone again. I expect NZD to eventually make it out of the Breaker zone, and go for today's NDOG at 0.6002. If it makes it out of the breaker zone to go higher, targets are: 0.5993, 0.6000, 0.6007 and 0.6013.
If it fails and goes lower: 0.5976, 0.5970, 0.5964 and 0.5958.

CAD/JPY | BSL sweep (READ THE CAPTION)After last week's massive NWOG and the dramatic fall of the CADJPY, it moved upwards and then faced a little bit of correction after this week's NWOG, it gone up to 114.91 and dropped a little bit, leaving a Liquidity Pool below and the went back up and is being traded at 114.81. I expect CADJPY to sweep the liquidity above the 114.91 and then wait to see if it goes down again or will go for the next liquidity pool above 115.43 to make a move.
Targets: 115.00, 115.10 and 115.20.
If it fails to sweep the liquidity and drops: 114.72, 114.62, 114.52 and 114.42.

USD/CAD | Stuck! (READ THE CAPTION)As you can see in the daily chart of USDCAD, after it hit the Bullish OB, it has been going higher and higher, and started today by going through the Volume Imbalance, but it eventually fell inside the Volume Imbalance zone again. I expect it to retest the Vol Imbalance as well as Feb 6th NDOG soon and I want it to go through it. Currently it's being traded at 1.3684 and It is stuck between the Feb 3rd NDOG and Feb 6th NDOG.
For now, here are the targets for USDCAD: 1.3688, 1.3694, 1.3700 and 1.3707.

EUR/USD | Consolidation (READ THE CAPTION)After hitting the FVG Consequent Encroachment on Monday, EURUSD has been moving in the same range and has been somewhat consolidating. Currently it's being traded at 1.18020. I expect EURUSD to go for the BSLs above it and eventually retest the Jan 26th's NWOG.
Targets for EURUSD: 1.18070, 1.18150, 1.18230 and 1.18310.
If it fails to go higher and drop from here, the targets are: 1.1796, 1.1790, 1.1784 and 1.1778.

GBP/USD | NWOG retest (READ THE CAPTION)Good morning folks, Amirali here.
Starting the day with GBPUSD hourly chart; we can see that GBPUSD has pierced through the Jan 26th's NWOG Low and also swept the SSL, now being traded at 1.36230. I would like to see it reach the old FVG High below it, and then move upwards, but it may not go that way and make its upwards move now as it has already swept the SSL. Then afterwards, I expect GBP to go and retest the Jan 26th NWOG.
For now, the targets for GBPUSD are: 1.36400, 1.36480 and 1.36560.

NZDUSD H1 | Bearish BreakoutThe price is rising towards our sell entry level at 0.5993, which is an overlap resistance that lines up with the 23.6% Fibonacci retracement.
Our stop loss is set at 0.6024, which is an overlap resistance that aligns with the 50% Fibonacci retracement.
Our take profit is set at 0.5928, whichis a pullback support.
High Risk Investment Warning
Stratos Markets Limited fxcm.com Stratos Europe Ltd fxcm.com
CFDs are complex instruments and come with a high risk of losing money rapidly due to leverage. 69% of retail investor accounts lose money when trading CFDs with this provider. You should consider whether you understand how CFDs work and whether you can afford to take the high risk of losing your money.
Stratos Global LLC fxcm.com Losses can exceed deposits.
Please be advised that the information presented on TradingView is provided to FXCM (‘Company’, ‘we’) by a third-party provider (‘TFA Global Pte Ltd’). Please be reminded that you are solely responsible for the trading decisions on your account. Any information and/or content is intended entirely for research, educational and informational purposes only and does not constitute investment or consultation advice or investment strategy. The information is not tailored to the investment needs of any specific person and therefore does not involve a consideration of any of the investment objectives, financial situation or needs of any viewer that may receive it. Past performance is not a reliable indicator of future results. Actual results may differ materially from those anticipated in forward-looking or past performance statements. We assume no liability as to the accuracy or completeness of any of the information and/or content provided herein and the Company cannot be held responsible for any omission, mistake nor for any loss or damage including without limitation to any loss of profit which may arise from reliance on any information supplied by TFA Global Pte Ltd.
Stratos Trading Pty. Limited fxcm.com
Trading FX/CFDs carries significant risks. FXCM AU (AFSL 309763), please read the Financial Services Guide, Product Disclosure Statement, Target Market Determination and Terms of Business at fxcm.com

Stop!Loss|Market View: EURUSD🙌 Stop!Loss team welcomes you❗️
In this post, we're going to talk about the near-term outlook for the EURUSD currency pair☝️
Potential trade setup:
🔔Entry level: 1.17711
💰TP: 1.15916
⛔️SL: 1.18450
"Market View" - a brief analysis of trading instruments, covering the most important aspects of the FOREX market.
👇 In the comments 👇 you can type the trading instrument you'd like to analyze, and we'll talk about it in our next posts.
💬 Description: Support at 1.17960 continues to attract the euro price, creating a basis for continued downward movement toward 1.16000. It should be noted that a short-term rebound in the dollar is likely today, so selling, according to the scenario above, should only be considered in the event of a confirmed breakout of 1.17960. Level 1.16500 should also be noted as an interim target.
Thanks for your support 🚀
Profits for all ✅

NZDUSD Buy Trading Opportunity SpottedH4 - Strong bullish move.
Currently it looks like a pullback is happening.
Until the two support zones hold I expect bullish continuation.
👉 If you enjoy this analysis, please Like, Follow, and Support the profile! Your engagement motivates us to share more quality setups.

NZDUSD My Opinion! BUY!
My dear friends,
Please, find my technical outlook for NZDUSD below:
The instrument tests an important psychological level 0.6018
Bias - Bearish
Technical Indicators: Supper Trend gives a precise Bearish signal, while Pivot Point HL predicts price changes and potential reversals in the market.
Target - 0.6036
Recommended Stop Loss - 0.6006
About Used Indicators:
Super-trend indicator is more useful in trending markets where there are clear uptrends and downtrends in price.
Disclosure: I am part of Trade Nation's Influencer program and receive a monthly fee for using their TradingView charts in my analysis.
———————————
WISH YOU ALL LUCK

NZDUSD - Looking To Buy PullbacksH4 - Strong bullish move.
Currently it looks like a pullback is happening.
Until the two Fibonacci support zones hold I expect the price to move higher further.
If you enjoy this idea, don’t forget to LIKE 👍, FOLLOW ✅, SHARE 🙌, and COMMENT ✍! Drop your thoughts and charts below to keep the discussion going. Your support helps keep this content free and reach more people! 🚀
--------------------------------------------------------------------------------------------------------

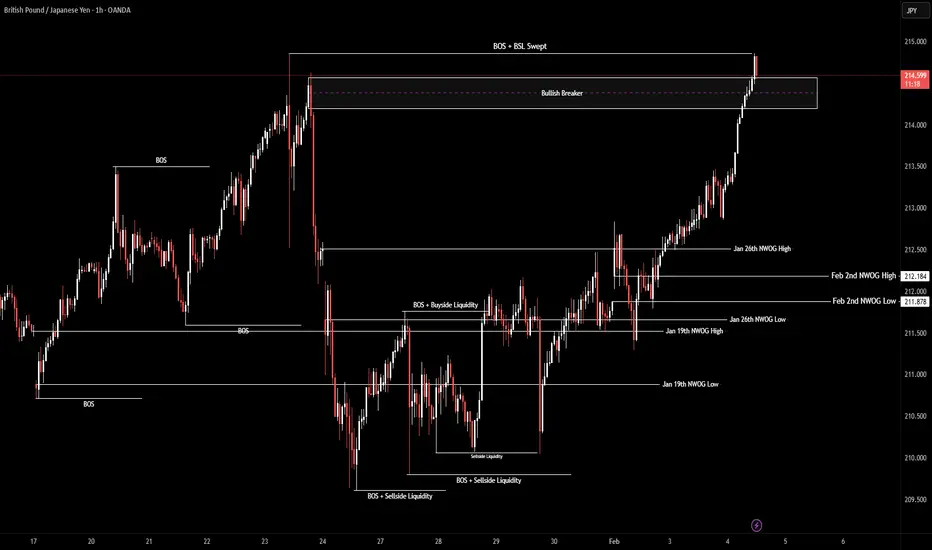
GBP/JPY | Next targets (READ THE CAPTION)GBPJPY has swept the major liquidity pool and then dropped, now being traded at 214.65. I don't expect to go lower that much, I believe it'll go higher relatively soon, considering the Bullish Breaker and the fact that GBPJPY has already hit the Bullish Breaker high.
Targets: 214.67, 214.76, 214.85 and 214.94.
GBP/USD | Going for the Bearish Breaker (READ THE CAPTION)GBPUSD managed to sweep away the liquidity above 1.37154 and then dropped afterwards, currently being traded at 1.37120, moving towards today's NDOG at 1.36974. I would like it not to go for the NDOG, and going back up to test the Bearish Breaker.
Targets for GBPUSD: 1.37160, 1.37220 and 1.37280.
