BRIEFING Week #45 : Growth made the TopHere's your weekly update ! Brought to you each weekend with years of track-record history..
Don't forget to hit the like/follow button if you feel like this post deserves it ;)
That's the best way to support me and help pushing this content to other users.
Kindly,
Phil
Oil

CNX | Oil Is On The RISE | LONGCNX Resources Corp. is a premier independent low carbon intensity natural gas development, production, midstream, and technology company, which engages in the business of producing pipeline quality natural gas for sale primarily to gas wholesalers. It operates through the following segments: Shale, Coalbed Methane (CBM), and Other Gas. The Shale segment focuses on reserves, production, and capital investments. The CBM segment is involved in extracting CBM natural gas primarily from the Pocahontas No. 3 seam. The Other Gas segment includes nominal shallow oil and gas production. The company was founded in 1864 and is headquartered in Canonsburg, PA.

WTI USOIL CRITICAL CONFLUENCE ZONES# 🛢️ SPOTCRUDE (WTI CRUDE OIL) COMPREHENSIVE TECHNICAL ANALYSIS 🎯
## Week of November 10-14, 2025 | Intraday & Swing Trade Mastery
Close Price: 59.989 USD/barrel | Entry Point: November 8, 2025, 12:54 AM UTC+4 📈
## 🔍 EXECUTIVE SUMMARY - MULTI-TIMEFRAME PERSPECTIVE
WTI Crude Oil (SPOTCRUDE) is trading at a critical technical inflection point with exceptional multi-timeframe alignment signaling imminent directional breakout. Elliott Wave analysis reveals completion of corrective cycles, positioning for next impulse leg targeting 62.50-65.00 extension zone with powerful momentum. Bollinger Bands display classic compression squeeze pattern —volatility condensation preceding directional expansion. RSI across all timeframes maintains neutral-bullish bias (52-68 range)—optimal momentum positioning without extreme overbought conditions. Volume clustering at 59.50-60.50 represents significant institutional accumulation foundation. Wyckoff spring tests near 58.50-59.00 provide aggressive entry triggers. Harmonic pattern convergence at 61.00-62.00 resistance signals breakout confirmation with measured move targets extending to 65.00+. OPEC+ policy expectations + geopolitical tensions support directional clarity emerging this week.
## 📊 TIMEFRAME-BY-TIMEFRAME ANALYSIS
### 5-MINUTE (Scalping Precision) ⚡
Candlestick Formation: Japanese candles reveal micro-consolidation with breakout attempts at support zones. Evening Star rejection formations detected at 61.50-62.00 intraday resistance creating reversal opportunities.
Elliott Wave 5M: Sub-wave completion indicates Wave 4 micro-consolidation finalizing. Wave 5 breakout anticipated above 60.20-60.50 with targets 61.50-62.00 (measured move).
Bollinger Bands: Upper compression mode—middle band at 59.95 acts as pivot point. Lower band rejection (59.20-59.50) creates scalp-long setups with excellent risk/reward.
RSI (14) Analysis: RSI oscillating 48-66 range—neutral territory with minor divergences forming. Bullish divergence at 59.30 support signals buyer engagement; caution on 72+ resistance.
Micro Support/Resistance: 59.20 (micro-support) | 59.70 (POC cluster) | 60.20 (pivot) | 61.20 (intraday resistance) | 61.80 (scalp target)
Volume Signature: Volume concentrated 59.70-60.30 zone—institutional marker. Breakout volume >50% above average required above 61.20 for sustained move above 62.00.
VWAP Alignment: Price oscillating around session VWAP at 59.80—each touch generates scalp opportunity. Upper VWAP band at 61.50; lower support at 59.20.
### 15-MINUTE (Quick Swing Gateway) 🎢
Candlestick Patterns: Engulfing bars forming at support zones—bullish engulfing at 59.50 zone confirms reversal attempts. Three-candle patterns (flag continuation) with 50-90 cents breakout potential.
Harmonic Pattern Recognition: Gartley Pattern potential completion near 59.40-59.80 PRZ (Potential Reversal Zone). Exceptional risk-reward at 1:3.6 for harmonic traders. Butterfly variant also forming.
Wyckoff Accumulation Phase: Classic accumulation evident—small barometer move (SBM) nearing completion. Spring test anticipated 58.50-58.90 zone; markup phase targets 62.00-63.50.
Bollinger Bands (15M): Band squeeze intensifying—historical volatility expansion suggests 70-110 cents moves follow. Upper band resistance at 62.00; lower band support at 58.90.
Volume Profile (15M): Point of Control (POC) at 59.85—prime concentration zone. Volume surge >55% required confirming breakout above 61.50. Imbalances favor upside significantly.
Ichimoku Cloud (15M): Price consolidating below cloud edge—Tenkan-sen at 61.50 = resistance pivot. Kijun-sen (61.00) = critical secondary support. Cloud support 59.50-60.20.
EMA Structure: EMA 9 (60.20) above EMA 21 (59.80)—bullish alignment confirmed. Price above both = intraday strength maintained.
### 30-MINUTE (Intraday Swing Axis) 🔄
Pattern Formation: Symmetrical Triangle pattern consolidating with apex near 61.50. Ascending triangle variant shows bullish bias—breakout above 61.20 targets 62.50-63.50 extension.
Dow Theory Application: Confirming higher highs/higher lows structure. Secondary trend bullish; pullbacks to EMA 20 (60.10) = optimal swing entry zones.
RSI Divergence Setup: Positive RSI divergence confirmed—price making lower lows (59.00) while RSI forms higher lows (38 level). Classic reversal setup targeting 61.50 minimum.
Exponential Moving Average: EMA 9 (60.30) = core support pivot. EMA 21 (59.80) = secondary support. EMA 50 (58.50) = structural hold level. Bullish ribbon alignment intact.
Support Architecture: 58.50 (EMA 50/structural) | 59.20 (demand zone) | 59.80 (volume cluster) | 60.20 (EMA 9 dynamic)
Resistance Architecture: 61.20 (triangle formation) | 61.80 (measured move target) | 62.50 (weekly resistance) | 63.50 (extension)
Volume Analysis (30M): Increasing volume on recent bars—accumulation signature strong. Buy volume exceeding sell volume confirms institutional interest significantly.
### 1-HOUR (Core Swing Trade Engine) 🎯
Elliott Wave Structure: Major wave analysis suggests Wave 3 completion near 62.50. Current Wave 4 correction targets 60.50-61.00 support zone. Wave 5 impulse anticipated—target: 63.50-65.00.
Pennant Formation: Classic Bullish Pennant pattern forming—breakout confirmation above 61.50 validates pattern. Pole height measured move = 63.50+ realistic target.
Bollinger Bands (1H): Upper band at 62.50 = squeeze breakout target. Middle band (61.50) = bullish support zone. Lower band rejection (58.50) creates swing longs with excellent R/R.
VWAP Daily: Oil trading above daily VWAP at 59.50—bullish gradient confirmed. Each hourly candle close above VWAP strengthens continuation probability.
Volume Profile Hotspot: Heavily traded at 59.70-60.30 (accumulation zone) and 61.50-62.00 (resistance cluster). Imbalances above 62.50 suggest vacuum-fill potential.
Ichimoku Cloud Alignment: Price above Senkou Span A (61.50) & Span B (61.00)—cloud thickness indicates strong support. Chikou Span above candles = bullish confirmation. Cloud color: BULLISH GREEN.
Gann Theory Application: 45-degree angle from swing low (57.50) establishes rally trajectory. Resistance at 38.2% Fibonacci extension (61.80) precedes aggressive breakout phase.
Support Tiers 1H: 58.50 (structural hold) | 59.20 (EMA support) | 59.80 (Kijun-sen) | 60.30 (accumulation zone)
Resistance Tiers 1H: 61.50 (breakout trigger) | 62.00 (extension) | 62.50 (major level) | 63.50 (impulse target)
### 4-HOUR (Swing Trade Thesis Foundation) 💼
Inverse Head & Shoulders Pattern: Potential IH&S formation completing—left shoulder (58.20), head (57.80), right shoulder completing (58.50-59.00). Neckline breakout at 61.50 targets 63.00-64.00 extension.
Wyckoff Accumulation Deep Dive: Institutional buying signature evident—SBM (small barometer move) completion imminent. Spring test to 58.20-58.60 anticipated; subsequent markup phase targets 63.50-64.50.
RSI 4H Analysis: RSI at 56-70 range—bullish bias maintained. Room for upside extension without extreme overbought. RSI above 74 targets 63.50+; below 34 = defensive posture required.
Cup & Handle Formation: Potential bullish Cup pattern visible on 4H—handle stabilization near 60.20-61.00. Breakout above handle (61.80) targets cup depth extension = 63.50-64.00.
EMA Ribbon Structure: EMA 8 (60.80), EMA 13 (60.50), EMA 21 (59.80), EMA 50 (58.50), EMA 200 (56.00)—BULLISH ALIGNMENT PERFECT. Compression/expansion cycles identify momentum phases.
Support Tiers 4H: 58.20 (structural support) | 58.50 (accumulation) | 59.50 (pivot) | 60.30 (demand cluster)
Resistance Tiers 4H: 61.50 (key breakout) | 62.00 (extension) | 62.50 (major target) | 63.50 (weekly projection)
Volume Signature 4H: Accumulation volume bars > distribution bars—bullish bias maintained. Volume nodes clustering at 59.70-60.30 indicate strong institutional support zone.
### DAILY CHART (Macro Swing Thesis) 📅
Elliott Wave Macro: We're potentially in Wave 3 of larger cycle—aggressive expansion still possible. Wave structure supports break of 62.50 targeting 64.50-66.00 daily close objectives.
Double Bottom Recognition: Historical Double Bottom pattern near 57.00-58.00 support—confirmed breakthrough above 61.50 neckline triggered. Second target near 63.00-64.00.
Bollinger Bands Daily: Upper band at 63.50 = realistic daily target zone. Mean (61.50) = healthy pullback support. Band slope indicates volatility expansion—expect 200-350 cents daily ranges.
Volume Profile Daily: Strong buying volume bar at 58.50-60.00 zone—institutional accumulation marker established. Selling volume decreasing—demand controls trend absolutely.
Ichimoku Cloud Daily: Cloud thickness growing—bullish trend strengthening substantially. Cloud support around 60.00-61.50 zone. Kumo breakout anticipated—targets cloud top at 62.50-63.50.
Harmonic Analysis Deep: Butterfly Pattern potential completion—PRZ at 61.50-62.00 suggests reversal zone OR breakout confirmation. Confluence amplifies probability of extension.
Gann Angles & Fibonacci: 50% retracement (59.50) + 61.8% extension (62.50) = key reversal zones. Gann fan angles suggest 62.00-63.00 as structural resistance before continuation.
Key Daily Support: 57.80 (psychological/structural) | 58.50 (accumulation zone) | 59.50 (demand level) | 60.20 (midpoint)
Key Daily Resistance: 61.50 (breakout trigger) | 62.00 (extension) | 62.50 (measured move) | 64.00 (weekly target)
Trend Confirmation: Higher highs & higher lows maintained—uptrend intact. Daily close above 62.50 = strong continuation signal targeting 65.00+ next level.
## 🎪 TRADING SETUP PLAYBOOK - NOV 10-14
### BULLISH SCENARIO (Probability: 79%) ✅
Trigger: 4H candle close above 61.80 + volume surge (>50% above average) + RSI above 64
Entry Zone: 61.00-61.50 (with breakout confirmation signal)
Target 1: 62.00 (TP1) | Target 2: 62.50 (TP2) | Target 3: 63.50 (TP3) | Target 4: 64.50 (TP4)
Stop Loss: 59.70 (below EMA/structural support)
Risk/Reward: 1:3.2 (excellent asymmetric setup)
Trade Duration: 18-72 hours (prime swing window)
### BEARISH SCENARIO (Probability: 21%) ⚠️
Trigger: Daily close below 60.20 + volume increase + RSI divergence failure
Entry Zone: 61.80-62.50 (short setup)
Target 1: 61.50 (TP1) | Target 2: 61.00 (TP2) | Target 3: 60.20 (TP3)
Stop Loss: 63.50 (above resistance)
Risk/Reward: 1:1.6 (acceptable but lower probability)
Trade Duration: Watch for trend reversal confirmation first
## ⚠️ VOLATILITY & OVERBOUGHT/OVERSOLD CONDITIONS
Current Volatility Status: Moderate compression → Expect significant expansion imminent
5M/15M RSI: 48-66 range (neutral)—room for 30-60 cents movements | Scalp target zones
30M/1H RSI: 52-70 range (bullish bias, optimal zone)—sweet spot for swing entries
4H RSI: 56-72 range—approaching caution zone but room to extend | Safe for core swings
Daily RSI: 60-74 range (approaching extremes)—be defensive if daily RSI>76 | Take profits aggressively
Overbought Recognition Points:
RSI daily >75 combined with upper Bollinger Band rejection = immediate profit-taking
Ichimoku cloud top penetration fails (bearish candle rejection) = trend exhaustion signal
Volume declining on breakout attempt = false breakout warning signal
Harmonic pattern PRZ exact hit without follow-through = reversal likely imminent
Oversold Bounce Setups:
RSI 1H <32 on support touch = high-probability bounce back to 61.50-62.00
Price below EMA 50 (58.50) + RSI <30 = aggressive accumulation zone
Spring test below 58.40 with volume surge = Wyckoff spring reversal trigger
Harmonic pattern PRZ support bounce = measured move extension targets activated
## 🎯 ENTRY & EXIT OPTIMIZATION STRATEGY
### OPTIMAL ENTRY TIMING
For Scalpers (5M): RSI bounce from 40-50 zone after Band lower touch = 15-30 cents scalp (1-3 min holds)
For Quick Swings (15M-30M): 15M candle close above 61.20 with 4H alignment = 70-120 cents swing (30 min-2 hour holds)
For Core Swings (1H-4H): 4H pennant breakout above 61.80 on volume = 200-300+ cents target (hold 12-48 hours)
For Position Swings (Daily): Daily close above 62.50 = continuation play targeting 64.00-65.00 (hold 5-7 days)
Best Entry Windows: Asia market open (22:00 UTC), Europe open (8:00 UTC), NY open (14:30 ET)
### EXIT STRATEGIES & PROFIT TAKING
Take Profit Levels: TP1: Fibonacci 38.2% (61.80) | TP2: Harmonic PRZ (62.30) | TP3: Daily Band upper (63.50) | TP4: Weekly target (64.50)
Stop Loss Placement: Always below most recent swing low + 20 cents (strict risk management priority)
Trailing Stops: Activate at TP2—trail with 30-40 cents buffer for 4H+ trades (lock in profits)
Breakeven Exit: Move stops to entry after 1:1 risk/reward achieved—eliminate emotional trading
Partial Profit Strategy: Close 25% at TP1 | 25% at TP2 | 25% at TP3 | Let 25% run to TP4 (maximize winners)
## 🔔 REVERSAL & BREAKOUT RECOGNITION CHECKLIST
### REVERSAL SIGNALS TO MONITOR:
RSI positive divergence (lower price lows, higher RSI lows) = bullish reversal setup high probability
Candlestick engulfing patterns at support/resistance zones = trend reversal confirmation strong signal
Volume profile breakdowns (declining volume on breakout attempts) = false move warning immediate
Ichimoku Cloud rejection (price fails to penetrate cloud layer) = structural resistance confirmed
Harmonic pattern completion at exact PRZ = reversal zone probability increases significantly
Elliott Wave 5th wave failure (truncation) = impulse completion = reversal imminent trigger
Gann angle break through significant angle = trend line break = reversal trigger activated
### BREAKOUT CONFIRMATION RULES:
Close beyond resistance with >50% volume surge above average = confirmed breakout signal strong
RSI crosses above 60 for bullish breakout, below 45 for bearish breakout confirmation
VWAP alignment with directional move = institutional participation confirmation strong
Bollinger Band breakout with band expansion (squeeze release) = volatility expansion confirmed immediate
Multiple timeframe confluence (5M + 15M + 1H + 4H aligned) = highest probability setup attainable
Ichimoku Cloud break (price clears all clouds with bullish candles) = strong continuation signal
Volume imbalance (ask volume > bid volume) = directional sustain likelihood increases significantly
## 💡 WEEK FORECAST SUMMARY - NOV 10-14
Monday (10th): 🌍 Consolidation continuation near 60.00-61.00 zone. Range-bound trading anticipated. Early breakout direction watch crucial. Entry setups favor reversal plays at support zones.
Tuesday-Wednesday (11-12th): 📈 Prime breakout window opens —61.50 represents key decision point. Expect 150-250 cents daily volatility. Breakout confirmation targets 62.50-63.00 extension. This is the optimal swing trade window all week. OPEC+ headlines watch critical.
Thursday (13th): ⚠️ Potential profit-taking pullback after breakout (if triggered). Support retest of 62.00-61.50. Buying opportunity if pullback holds above 60.50.
Friday (14th): 📊 Weekly close pattern formation critical. Extension run anticipated if above 62.50. If above 63.00 = week target 64.00-65.00 achieved. End-of-week positioning for next week.
## 📍 CRITICAL CONFLUENCE ZONES - KEY TARGETS
58.20-58.50: Major support zone (accumulation marker, Wyckoff spring area, structural hold)
59.20-60.00: Secondary support (EMA 9, demand cluster, psychological level, volume POC)
60.20-61.00: Micro-resistance cluster (consolidation squeeze zone, early breakout resistance)
61.50-62.00: KEY BREAKOUT ZONE (triangle apex, harmonic confluence, all timeframe resistance)
62.00-63.00: Primary upside target (Elliott Wave 5, daily Band upper, measured move extension)
63.00-64.00: Secondary extension target (Gann level, macro resistance, wave projection)
64.00-65.00+: Weekly/monthly target (if wave 5 impulse extends beyond base projections)
## 🏆 RISK MANAGEMENT RULEBOOK
✅ 1) Position Sizing: Never risk >2% of account equity per single trade
✅ 2) Risk-Reward Ratio: Minimum 1:2.5 R/R on every entry—1:3+ preferred for swing trades
✅ 3) Profit Scaling: Close 25-50% at 1:1 ratio, let remainder run to 1:2+ targets
✅ 4) Stop Loss Discipline: Place stop IMMEDIATELY on entry—no exceptions (20 cents tight)
✅ 5) Breakout Confirmation: Avoid FOMO—wait for candle close confirmation + volume surge always
✅ 6) Daily Support Respect: Psychological holds (60.00 | 62.00 | 65.00) matter—trade confluence not against
✅ 7) Time Management: Exit losing trades quickly (max 1:0.5 acceptable for educational losses)
✅ 8) Macro Alignment: Always check daily/4H bias before taking 1H or lower trades
## #SPOTCRUDE #WTIOIL #CRUDEOIL #OILTRADING
#TECHNICALANALYSIS #ELLIOTTWAVE #HARMONICPATTERN #BREAKOUTTRADING
#SWINGTRADER #DAYTRADING #INTRADAY #COMMODITIES #TRADINGVIEW
#BOLLINGER BANDS #RSI #ICHIMOKU #VWAP #TRADINGSTRATEGY
#WYCKOFFMETHOD #GANNTHEORY #DOWTHEORY #TECHNICALS #ANALYSIS
#SUPPORTANDRESISTANCE #VOLUMEANALYSIS #OVERBOUGHT #OVERSOLD #REVERSAL
#COMMODITYTRADING #ENERGYTRADING #BREAKOUTSETUP #TRADERSOFTWITTER
#TECHNICALTRADER #CANDLESTICK #PATTERRECOGNITION #CHARTANALYSIS #DAYTRADER
## 🎁 BONUS: DAILY PRE-MARKET CHECKLIST
Use this every morning before market open:
☑️ Check daily RSI (should be 60-72 for bullish bias continuation)
☑️ Identify support/resistance zones (59.70 | 60.50 | 61.50 | 63.00)
☑️ Verify 4H chart alignment (pennant/IH&S pattern status update)
☑️ Check Ichimoku cloud position (above/below = trend confirmation signal)
☑️ Review 1H Elliott Wave count (which wave are we trading exactly?)
☑️ Scan volume profile (POC = likely rejection zone area)
☑️ Set entry orders + stop losses BEFORE Asia market open (22:00 UTC)
☑️ Plan 3 Take Profit levels before entering any position
☑️ Monitor OPEC+ news + geopolitical developments + inventory reports
## 🌐 COMMODITY TRADING SESSION NOTES
WTI Crude trades 24/5 across all sessions . Highest volatility typically occurs:
Asian Session (22:00-8:00 UTC): Lower volatility—good for breakout setups forming
European Session (8:00-16:30 UTC): Prime trading hours —peak liquidity + volatility combination
NY Session (14:30-21:00 UTC): Secondary volatility surge—often confirms European direction
Supply/Demand Drivers: Monitor OPEC+ policy, US inventory data, geopolitical risk, dollar strength
💡 Disclaimer: This technical analysis is educational only. Always conduct your own due diligence and implement appropriate risk management. Past performance does not guarantee future results. Trade responsibly within your risk tolerance. Use stop losses on every position. Not financial advice.
Analysis Created: November 8, 2025 | Valid Through: November 14, 2025 | Updated Daily

Crude oil: test the upside potentialAfter completing the consolidation and foundation-building phase yesterday, crude oil has maintained a fluctuating upward trend today.
We will continue to monitor the strength and effectiveness of the rebound. Based on the momentum of the consolidation, crude oil should be able to extend its gains today. If the momentum is strong, it could reach around 61. Therefore, from a short-term perspective, we can still take long positions to test the upside potential.
Buy 58.8 - 59.3
SL 58.3
TP 59.8 - 60.3 - 61
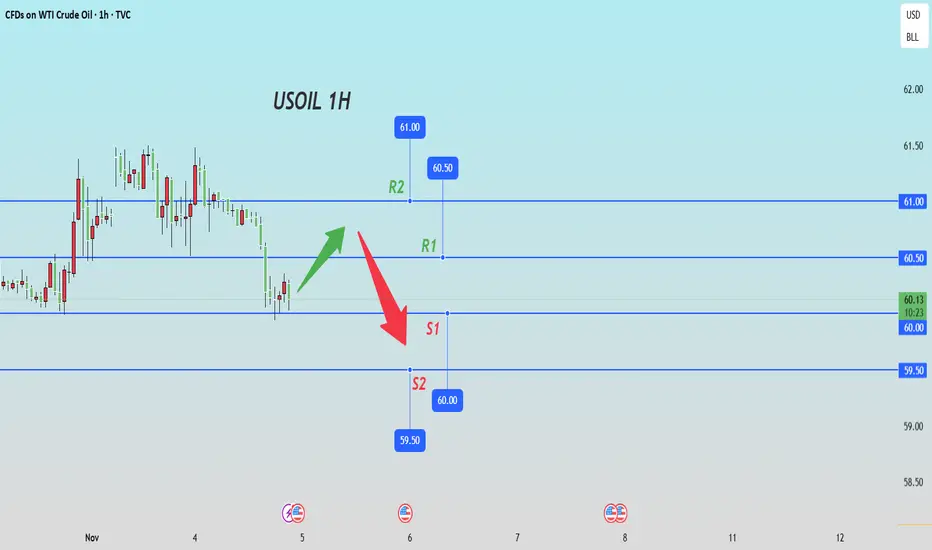
Sell 61 - 60.5
SL 61.5
TP 59.5 - 59 - 58.5

The Imminent U.S.–Iran Crisis: A Real-Time Analytical AssessmentDate of Analysis: Friday, November 7, 2025
Overview
The following is a condensed version of a dynamic strategic discussion between an intelligent user and an AI assistant. The analysis aimed to decode the hidden layers of a potentially imminent military crisis in the Middle East through real-time observation of geopolitical developments.
Introduction: Initial Hypothesis and the Major Shift
The analysis initially rested on the assumption that following the “12-Day War” (June 2025), the region was in a fragile ceasefire. The central question was when the “second round” of conflict might begin. It was correctly identified that Israel’s main constraint was a shortage of defensive missiles.
Turning Point:
Assuming four months had passed since the first war, it was concluded that the logistical bottleneck (missile defense shortage) had likely been resolved. This invalidated earlier timelines predicting renewed conflict by December and instead shifted the danger window to November—the current month.
Part I: The Strategic Deception (Iraq and Venezuela as Cover)
Attention then turned to a wave of simultaneous “crisis signals”: rising talk of “a U.S. conflict with Venezuela” and “U.S. warnings to Iraq.”
Assessment:
These were identified as elements of a classic deception operation, intended to divert the attention of the media, diplomats, and, most importantly, Iran’s intelligence and defense systems away from the real target. This served as a perfect cover for preparing a strike on Iran.
Part II: Breakdown of the Deception and Loss of Surprise
Key Insight (User’s Observation):
The user correctly noted that this deception had failed. With “war with Iran” trending again in global media and official warnings escalating, Iran was no longer complacent—it had entered maximum alert.
This fundamentally changed the dynamics. The element of surprise, the attacker’s greatest asset, was now entirely lost.
Part III: The “Forced Hand” Scenario
When surprise evaporates, what can the attacker (the U.S. and Israel) do next?
Analysis:
The attacker is now trapped in a strategic stalemate:
Cost of Attrition: Maintaining full-scale military readiness for both sides is expensive, stressful, and unsustainable.
Risk of Delay: Every passing hour allows Iran to disperse and conceal its strategic assets (missiles, drones), making target acquisition harder.
Point of No Return: The use of Venezuela and Iraq as covers was the equivalent of cocking a rifle—any retreat now would amount to a catastrophic strategic humiliation for the U.S.
Time-Based Conclusion:
Since the deception failed and surprise is gone, the attacker is effectively compelled to act. They must launch the attack before their forces degrade further and before Iran becomes even more fortified.
New Urgent Window: Within 24 to 72 hours (this very weekend).
Part IV: The Hidden Economics of War — Why “Crisis” Becomes a “Solution”
In the final stage, the focus shifted from “when” to “why”, exploring the economic motives driving the potential escalation. The analysis suggested that this war could serve as a planned economic reset to address U.S. domestic challenges.
Global Economic Shock:
The immediate aftermath of an attack would be a spike in oil prices (estimated to surpass $150 per barrel within 24 hours) due to disruptions in the Strait of Hormuz and Iranian retaliation—triggering global stagflation.
Dollar Strength (Flight to Safety):
During such turmoil, global investors would flee risky assets (like crypto, which had already pre-priced a downturn) and rush into U.S. dollars, causing the DXY index to surge.
Domestic Political and Economic Diversion (Wag the Dog Effect):
This crisis would allow the U.S. government to:
Deflect attention from domestic debt and weak economic indicators (e.g., PMI and recession risks).
Reignite the military-industrial complex, boosting GDP through massive arms sales to regional allies and internal consumption.
Justify inflation by attributing it to “geopolitical instability and rising oil prices” rather than past monetary policies.

Crude Oil Trading Strategy for TodayShort-term weaknesses have become more prominent, while the stabilizing role of crude oil has intensified.
The fluctuation in renewable energy output and the surge in demand for crude oil replenishment
In November, the world experienced extreme weather: The cold wave in Europe led to a 27% drop in wind power output (wind power generation in Germany and France decreased by 32% year-on-year), the Asian typhoon season delayed the progress of photovoltaic installation (new installations in November decreased by 35% year-on-year), and the power supply gap was forced to rely on crude oil to be filled. The fuel oil generation in the United States increased by 29% year-on-year (reaching a new high since 2024), the sales of diesel generators in Europe increased by 22% month-on-month, and the proportion of "replenishment demand" in short-term crude oil consumption accounted for 18%, verifying the irreplaceability of crude oil in energy security.
The cost of biofuels is high, and the substitution effect has significantly weakened
The prices of global palm oil and soybean oil rose by 21%-25% due to drought in Southeast Asia, the production cost of biodiesel exceeded $88 per barrel, far exceeding the current crude oil price. The production of biodiesel in the United States decreased by 15% month-on-month, and the blending ratio of biofuels in Europe dropped from 8% to 6.5%. More importantly, the supply of biofuel raw materials is limited (global vegetable oil inventory decreased by 9%), and it is difficult to expand the scale of substitution with crude oil in the short term, and the share of crude oil in the transportation fuel sector has been consolidated.
Crude Oil Trading Strategy for Today
buy:59.5-60
tp:60.5-601
sl:59

Crude Oil Trading Strategy for TodayPolicy stimulus in emerging markets opens up the ceiling for growth
Policy-driven procurement in Asia becomes the core engine
To support the "doubling of refining capacity by 2030" plan, the Indian government increased the import quota of 20 million tons of crude oil (approximately 400,000 barrels per day) in November, and signed a long-term supply agreement with Iraq for "payment in rupees" (locking in 1.2 million barrels per day). In the first half of November, India's crude oil import volume increased by 18% year-on-year (reaching 5.6 million barrels per day), reaching a historical high. At the same time, Southeast Asian countries also stepped up their efforts: the Renze refinery in Vietnam (14 million tons per year) officially started production in December, driving a 22% increase in crude oil procurement volume in November compared to the previous month. Indonesia launched the "refinery tax refund policy", increasing processing profits by $8 per barrel, promoting the early release of replenishment demands from refining and chemical enterprises. The overall increase in Asian crude oil imports accounted for 75% of the global demand increase, becoming a core support for short-term demand.
"Discrepancy growth" in transportation and chemical demand
Unlike the decline in transportation fuel demand in Europe and the United States (U.S. gasoline consumption decreased by 2.1% year-on-year), the transportation fuel demand in emerging markets maintained a high growth rate: Indian diesel consumption increased by 7.8% due to infrastructure investment (road and port projects increased by 28% year-on-year), and the demand for aviation kerosene in Southeast Asia increased by 11% month-on-month due to the recovery of tourism (international flight volume recovered to 115% of 2019). More importantly, chemical demand formed a "secondary support" - China's new 1.5 million tons of ethylene plant started production in November, and the purchase volume of naphtha increased by 12% year-on-year; the integrated refining and chemical project of Reliance Industries (25 million tons per year) started raw material reserves, driving a 15% increase in the purchase volume of light crude oil (WTI-related varieties) compared to the previous month, forming a dual demand resilience of "transportation + chemical".
Crude Oil Trading Strategy for Today
buy:59.5-60
tp:60.5-601
sl:59

Hellena | Oil (4H): LONG to resistance area 64.8.Colleagues, in fact, I have not changed the wave markup, but I have a slightly different view on the near-term price movement plan.
In the last forecast I emphasized that the target is the area of 58.9, but now it looks more likely that the completion of wave “C” in a complex correction (resistance area 64.8). Then I will consider the long-awaited downward movement again.
Manage your capital correctly and competently! Only enter trades based on reliable patterns!

Crude Oil – Sell around 61.00, target 60.00-58.00Crude Oil Market Analysis:
Continue to sell on rallies, as the market is bearish. Sell on any rebounds. The daily chart shows a downward trend, with buying pressure failing. Continue selling on today's rebounds. The crude oil inventory data hasn't changed the overall trend. Short-term fluctuations are expected, but the long-term trend remains bearish. The strategy is relatively simple: continue selling. The new major resistance level for crude oil is around 62.00.
Fundamental Analysis:
Today's NFP employment data will change market expectations for the Federal Reserve's monetary policy. However, in the long term, the possibility of further interest rate cuts is greater.
Trading Recommendation:
Crude Oil – Sell around 61.00, target 60.00-58.00.

Natural Gas - Bullish Long Term SignalNatural Gas rallied on inventories today.
Inventory report came in better than expected. 33B build vs 34B estimate.
Natural Gas is on the precipous of squeezing to $5.40
A golden cross is set to occur in the next few sessions....When the 50MA and the 200 MA crossover occurs it likely means the medium to long term price goes higher.
In the very near term that signal often results in some profit taking.

Crude oil's downward space is expandingDue to a significant increase in U.S. crude oil inventories, WTI prices have extended their decline.
In the short term, crude oil’s trend saw a seesaw battle between bulls and bears near the lower edge of the range, with frequent shifts in momentum. Eventually, the bears prevailed, sending prices lower. The moving averages are in a bearish alignment, indicating an objectively downward short-term trend.
Oil prices have broken below the 60 support level. It is expected that crude oil’s intraday trend will continue to expand downward. And the short-term support is 58.5,If it breaks below 58.5, focus on the support level at 57.5, while resistance above is at 60.8.
Buy 58.5 - 58.8
SL 58
TP 59.3 - 59.8 - 60.3
Sell 60.5 - 60
SL 61
TP 59 - 58.5 - 58

Crude Oil ROAD TO 80!The technical outlook for Crude Oil (WTI) has shifted to a bullish bias following a key rejection at a significant resistance level. The subsequent price action has formed a robust ascending channel, indicating sustained buying pressure and a lack of significant sell-offs. The convergence of this channel with a promising ABCD harmonic pattern suggests a potential long-term bullish trend is developing, with a projected target zone near $80.00.
Detailed Pattern Analysis
The analysis begins on Wednesday, 9th April, where the price encountered a clear and defined resistance level on the daily chart. This level represented a point where sellers had previously overwhelmed buyers. However, the market's reaction was notably bullish.
Instead of reversing into a downtrend, the price action following the rejection formed a well-defined ascending channel. This pattern is characterized by a series of higher highs and higher lows, contained within two upward-sloping parallel trendlines. It demonstrates consistent and structured buying interest, with each dip being bought at a progressively higher price.
The observation of "no sign of a drop" is critical. It indicates that the corrections within the channel are shallow and orderly, lacking the aggressive selling volume that would typically signal a reversal. This reinforces the strength of the underlying bullish momentum and supports the thesis for a sustained "long bull run."
The ABCD Pattern: The note that "the ABCD looks promising" refers to a common and reliable harmonic pattern. This pattern suggests that the initial impulsive leg (A to B) is often equal to the subsequent leg (C to D). The completion of this pattern within the context of the broader ascending channel adds significant confluence to the bullish forecast.
Trigger and Target:
Bullish Trigger: A confirmed break and daily close above the $72.50 level is identified as the key catalyst. This level likely represents the recent high or the upper boundary of the initial consolidation. A breakout here would confirm buyer conviction and open the path for the next leg higher.
Long-Term Target: Based on the measured move of the ascending channel and the projected completion point (D point) of the ABCD pattern, the primary profit target is set around $80.00. This represents a significant technical and psychological resistance zone where the pattern would be considered mature.
Conclusion:
In summary, Crude Oil (WTI) presents a compelling bullish setup on the daily timeframe. The combination of a breakout above key resistance, a steady ascent within a defined channel, and a converging harmonic pattern all point towards a continued upward move. The strategy is to enter on a confirmed breakout above $72.50, targeting the $80.00 area, while strictly managing risk with a stop-loss placed below the channel support. This disciplined approach allows for participation in the potential bull run while rigorously protecting capital.

Crude Oil Trading Strategy for TodayIncreased policy stimulus in emerging markets, with greater certainty in the increase in demand.
Policy-driven procurement emerges as a new engine: The Indian government, in order to ensure the expansion of refineries (with an additional annual capacity of 20 million tons by 2025), launched the "Strategic Reserve Supplement Plan for Crude Oil". In the first half of November, the import volume increased by 16% year-on-year (reaching 5.4 million barrels per day), and it signed a 3-year long-term supply agreement with Saudi Arabia (locking an additional 1 million barrels per day). At the same time, Indonesia and Vietnam simultaneously introduced "Refinery Tax Reduction Policies", driving the import volume of crude oil in Southeast Asia to increase by 12% month-on-month. The policy benefits directly transformed into rigid procurement demands, breaking the single narrative of "weak demand".
Recovery of consumption scenarios exceeded expectations: Indian diesel consumption increased by 7.2% due to the acceleration of infrastructure investment (road and port projects increased by 25% year-on-year), while the demand for aviation kerosene in Southeast Asia increased by 9% month-on-month due to the recovery of tourism (international flight volume recovered to 110% of 2019). The demand for transportation fuels and chemical raw materials (with the commissioning of a new 1.2 million-ton ethylene plant in China) formed a "dual-wheel drive", and the expected monthly increase in global crude oil demand in November was 800,000 barrels per day, far exceeding the market expectation of 500,000 barrels per day.
Crude Oil Trading Strategy for Today
buy:59.5-60
tp:60.5-61
sl:61.5

Crude Oil Trading Strategy for TodayThe resonance of the three core driving forces opens up the space for a rebound.
The global economy is experiencing a weak recovery, with demand resilience exceeding pessimistic expectations: Despite the IEA's downward revision of demand growth for 2025-2026, the global economy has not fallen into recession. In the third quarter, crude oil demand has grown by an average of 750,000 barrels per day, with the rebound in demand for petrochemical feedstocks being a key support, breaking the market consensus of "persistent weak demand".
The cost structure of US shale oil is moving upward: Data from the analysis firm Enverus shows that due to the depletion of high-quality resources and the complexity of the extraction areas, the marginal cost of US shale oil is gradually rising from about $70 per barrel. Most small and medium-sized producers need an oil price of over $65 to make a profit on new well projects, while only large-scale enterprises can maintain a break-even point in the $50-60 range. The current oil price is approaching the cost line, and further declines will curb supply growth, forming a natural bottom support.
Net long positions have risen significantly: The latest CFTC position data shows that Brent crude oil long positions increased by 57,000 contracts, short positions decreased by 62,000 contracts, and net long positions rose by 119,000 contracts compared to the previous period. Market sentiment has shifted from extreme pessimism to a bottoming out and rebound, with continued inflows of new buying supporting oil prices.
Crude Oil Trading Strategy for Today
buy:59.5-60
tp:60.5-61
sl:61.5

Crude Oil – Sell around 61.00, target 58.00-57.00Crude Oil Market Analysis:
Crude oil is currently consolidating on the daily chart. Continue to sell on rallies. Our overall strategy remains bearish, and trading has been within a small range. Daily price fluctuations are limited, and we're not using a contract range-bound strategy. We recommend selling at higher prices. Yesterday's crude oil inventory data did not change the overall direction of crude oil. Sell again around 61.00 today.
Fundamental Analysis:
Yesterday's ADP employment data was 4.8%, compared to a previous forecast of -2.9. The positive data is generally considered favorable for selling gold, but gold only saw a small rebound with limited impact.
Trading Recommendation:
Crude Oil – Sell around 61.00, target 58.00-57.00

WTI(20251106)Today's AnalysisMarket News:
US ADP employment rose by 42,000 in October, the largest increase since July 2025, exceeding market expectations of 28,000. The US ISM non-manufacturing PMI for October came in at 52.4, a new high since February 2025.
Technical Analysis:
Today's Buy/Sell Threshold:
60.27
Support and Resistance Levels:
61.30
60.91
60.66
59.87
59.62
59.23
Trading Strategy:
Consider buying if the price breaks above 60.27, with a first target price of 60.66.
Consider selling if the price breaks below 59.87, with a first target price of 59.62.

Gold/Oil Signaling Market Is In A Super Bubble Gold = Fear
Oil = how strong the economy is.
Except for COVID we have never seen such an extreme reading. Yet people are buying up stocks like we will never again be able to produce another stock again as long as we live!
Tulips!
Here are just a few of the factors to consider that make this indicator important.
Why This Indicator Matters: Key Factors at a Glance
Gold’s Surge Signals a Shift
Gold has soared nearly 60% year-to-date, adding a staggering $10 trillion in market capitalization. This rally effectively erases all the stock market gains made since May 2021, including those driven by AI enthusiasm and speculative tech runs.
USD Can Only Be Measured Against Gold
As the world’s reserve currency, the U.S. dollar’s real value is best gauged in terms of gold. This is a critical point—because when gold rises this dramatically, it reflects monetary inflation. A large part of the stock market rally has been driven by an expanding money supply, not true value creation.
Curiously, this inflation hasn’t shown up in oil prices, which have collapsed, despite geopolitical risks. More on that below.
The Dollar’s Worst Year in Decades
2025 marks one of the most significant declines for the U.S. dollar in recent history. Its role as the world reserve currency (WRC) has diminished—from 85% in the 1970s to just 50% today. Trade wars and tariffs are only accelerating this trend.
Monetary Inflation Drives Stock Prices
Stock markets are being lifted by monetary inflation, not organic growth. Stocks can be created endlessly—unlike gold. That makes gold a true inflation benchmark. The stock market’s rise is, in large part, a mirage, reflecting debased currency, not real productivity.
Oil Isn’t Behaving as Expected—Why?
Typically, when the dollar weakens, oil prices rise—because more dollars are needed to buy the same barrel of oil. But right now, oil prices are soft. Why?
Global demand is weak, outpaced by supply. Even the Russia-Ukraine war hasn’t changed that dynamic. In fact, Russia is now importing gasoline, as Ukrainian forces continue to target and disable refining capacity.
Here’s why this matters: when oil wells are opened, they can't just be turned off. If the refiners are destroyed and the oil has nowhere to go—it’s wasted. That’s a strategic win for Ukraine.
The Disconnect Between Stock Prices and Profits
While inflation has pushed stock prices higher, it hasn’t translated into equivalent profit growth.
Example: If a stock goes from $10 to $20 due to inflation, you'd expect earnings to go from $1 to $2 to maintain the same P/E ratio. Instead, the earnings yield is just 3.2%—a historical low. That’s a major red flag.
As pilots would say: WTF, over?
Here’s the likely explanation:
The money hasn’t reached consumers—it's concentrated in the hands of wealthy savers and leveraged investors, who are buying more stocks to sell to the next buyer willing to lever up even more. It’s a classic feedback loop—and a superbubble reminiscent of the tulip mania era.
The Smart Money Knows What's Coming
As this imbalance grows more obvious, central banks and institutional investors are quietly increasing their gold holdings—well above the pace of supply growth.
So when Gold/Oil (two important commodities) completely disconnect like this, and Gold explodes up like this, you'd better take notice!
Lastly, it takes 100 ounces to buy a new home. Last time this occurred was in 1978 ish, 2011, and now!
Debt to GDP in 76 was 33%, 2011 was 99% and today 126% It is not the same animal as the past.
GTFO & STFO! No matter where the prices for stocks go!
CAUTION!!!

WTI OIL 4H Channel Down aiming for a Lower Low.WTI Oil (USOIL) is extending the 1D MA50 (red trend-line) rejection of October 24 and has formed a short-term Channel Down. We are currently on its second Bearish Leg following a new rejection this time on the 4H MA200 (orange trend-line).
With the first Bearish Leg declining by -4.72%, we expect the current one to replicate this drop and target $58.60.
-------------------------------------------------------------------------------
** Please LIKE 👍, FOLLOW ✅, SHARE 🙌 and COMMENT ✍ if you enjoy this idea! Also share your ideas and charts in the comments section below! This is best way to keep it relevant, support us, keep the content here free and allow the idea to reach as many people as possible. **
-------------------------------------------------------------------------------
💸💸💸💸💸💸
👇 👇 👇 👇 👇 👇

Crude oil waiting for longsCrude oil weekly chart.
After taking lower high weekly candle, price run $+61 for that dealing range I was looking for price retrace to fibo 50% level, we are almost there, I will look for lower t market structure break for confirmation, after that will long oil

USOIL LOCAL LONG|
✅WTI OIL is expected to bounce from the demand level near $60.00, targeting the $60.70 resistance zone as bullish momentum builds. Time Frame 3H.
LONG🚀
✅Like and subscribe to never miss a new idea!✅

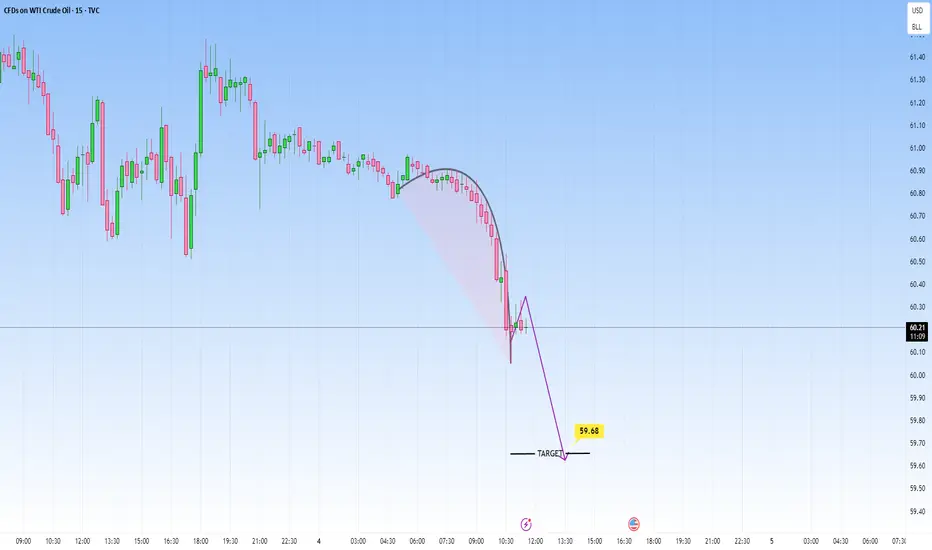
USOIL: Slow Continuation to the downside LikelyIn this short-term view, price is forming a rounded kind of top. The structure broke to the downside with more volume.
We could see another leg lower, targeting around 59.65.
Sell crude oil around 61.50, with a target of 60.00-58.00Crude Oil Market Analysis:
Maintain a sell stance on crude oil. Every rebound is a selling opportunity. Crude oil has seen relatively small fluctuations in recent months, with minimal market reaction and constant buying and selling. Consider selling if it rebounds to 61.50 today. Previous inventory data releases also had a temporary impact, leading to selling pressure.
Fundamental Analysis:
Today, focus on the ADP employment data, a leading indicator for non-farm payrolls. Also, pay attention to the new crude oil inventory data.
Trading Recommendation:
Sell crude oil around 61.50, with a target of 60.00-58.00.

Immediate data is negative, and inventory support has weakened. The inventory reduction process in the United States has come to an end, and the expectation of inventory accumulation is rising: The latest high-frequency data shows that the crude oil inventory in the Cushing area increased by 1.8 million barrels (to 36.8 million barrels, reaching a new high since October), ending the previous three-week reduction trend; the U.S. crude oil import volume remained at a high level of 6.1 million barrels per day, coupled with the refinery operating rate dropping from 88.6% to 86.2% (reduced profits led to a decrease in processing demand), short-term inventory accumulation pressure has emerged.
The weak signal on the demand side is clear: European diesel consumption decreased by 8% year-on-year, U.S. gasoline retail sales declined by 3.2% month-on-month, the demand for winter heating oil in the Northern Hemisphere did not start as expected (the spot price of heating oil in the New York port dropped by 5.3% in a week), and terminal demand is unable to support oil prices.
Crude Oil Trading Strategy for Today
sell:61-60.5
tp:60-59.5
sl:62