USOIL: Short Trading Opportunity
USOIL
- Classic bearish setup
- Our team expects bearish continuation
SUGGESTED TRADE:
Swing Trade
Short USOIL
Entry Point - 60.87
Stop Loss - 61.10
Take Profit - 60.44
Our Risk - 1%
Start protection of your profits from lower levels
Disclosure: I am part of Trade Nation's Influencer program and receive a monthly fee for using their TradingView charts in my analysis.
❤️ Please, support our work with like & comment! ❤️
Oil

The attack committee's risk has triggered supply anxietyDirect supply disruption risk: 900,000 barrels/day capacity at risk of zeroing out
The current daily crude oil production in Venezuela is 940,000 barrels (accounting for 0.9% of the global total). Although the absolute scale is limited, as the only OPEC oil-producing country not subject to production quotas, its production capacity has strategic resilience. Actions such as the arrival of US B-1B bombers and the deployment of the "Ford" aircraft carrier strike group in the Caribbean Sea, if escalated to military strikes, the core facilities of PDVSA, such as Lake Maracaibo oil field (accounting for 60% of the capacity) and Jose Port (the only deep-water oil port), will be directly paralyzed. Short-term exports may drop from 900,000 barrels/day to zero, forming a dual supply shock of "sanctions + war".
Replacement supply gap difficult to fill: OPEC+ remaining capacity in crisis
Currently, the total remaining capacity of OPEC+ is only 210,000 barrels/day, and it is concentrated in Saudi Arabia (180,000 barrels/day). If combined with the sanctions on Iran and disruptions in Red Sea transportation, Saudi Arabia needs to increase production by 170,000 barrels/day to fill the gap, which is close to its maximum idle capacity limit. Although US shale oil has potential, due to capital discipline restrictions, the maximum monthly increase in production is only 30,000 barrels/day, far from covering the supply vacuum in Venezuela. The price spread of heavy crude oil (the main type in Venezuela) has expanded from 1.2 US dollars to 1.8 US dollars, and structural tension has emerged.
Market sentiment preview: Risk premium accelerating inclusion
Historical data shows that after the US imposed sanctions on PDVSA in 2019, the weekly fluctuation range of oil prices expanded to 8%; while the impact intensity of military conflicts is 3-5 times that of sanctions - the oil facilities in Iran were attacked in 2019 (similar supply disruption), pushing oil prices to surge by 7.3% in a single day. Currently, the CFTC crude oil volatility index has risen from 18 to 25, and funds have begun to layout geopolitical risks in advance. The premium of near-month contracts over far-month contracts has expanded to 1.2 US dollars, reflecting short-term supply concerns.
Next week's crude oil trading strategy
buy:59.5-60
tp:61-61.50
sl:58.5

USOIL Will Collapse! SELL!
My dear subscribers,
This is my opinion on the USOIL next move:
The instrument tests an important psychological level 60.87
Bias - Bearish
Technical Indicators: Supper Trend gives a precise Bearish signal, while Pivot Point HL predicts price changes and potential reversals in the market.
Target - 60.50
My Stop Loss - 61.09
About Used Indicators:
On the subsequent day, trading above the pivot point is thought to indicate ongoing bullish sentiment, while trading below the pivot point indicates bearish sentiment.
Disclosure: I am part of Trade Nation's Influencer program and receive a monthly fee for using their TradingView charts in my analysis.
———————————
WISH YOU ALL LUCK

USOIL BEARS WILL DOMINATE THE MARKET|SHORT
USOIL SIGNAL
Trade Direction: short
Entry Level: 60.87
Target Level: 55.71
Stop Loss: 64.31
RISK PROFILE
Risk level: medium
Suggested risk: 1%
Timeframe: 1D
Disclosure: I am part of Trade Nation's Influencer program and receive a monthly fee for using their TradingView charts in my analysis.
✅LIKE AND COMMENT MY IDEAS✅

Crude Oil's Critical Breakdown: Is a Plunge to $58 Imminent?Hello, TradingView community! 👋 SpotCrude (WTI) has taken a significant turn, closing the week at a precarious 61.168 . After failing to sustain its recent rally, oil is now teetering on the edge of a major support level. Is this the beginning of a new downtrend, or will buyers step in to defend the line? The upcoming week, November 3rd to 7th, will be decisive.
Let's drill down into the multi-timeframe data, blending classic technical theories with key indicators to forge a robust trading strategy for the days ahead. 💡
🌍 The Macro Outlook: Weekly & Daily Charts - The Bears Are Back in Town
The market is a battlefield, and the trend is your strongest ally.
The higher timeframes are flashing significant warning signals, suggesting the recent strength was merely a correction in a larger downtrend.
Weekly Chart (1W) : The long-term picture remains bearish. As per Dow Theory , the primary trend is down, with the recent push higher failing at a key resistance zone. The price is firmly below the Ichimoku Cloud, and the formation of a Bearish Engulfing candle last week is a powerful rejection signal.
Daily Chart (1D) : On the daily chart, the story of failure becomes clearer. We have a potential Double Top formation right at a major resistance level. The RSI is exhibiting a clear bearish divergence where price made a higher high, but the RSI failed to confirm, indicating weakening momentum. The price has been decisively rejected and is now threatening to break down from this topping pattern.
⚔️ The Swing Trader's Battleground: 4-Hour & 1-Hour Analysis
For swing traders, a classic and powerful reversal pattern has taken center stage.
4-Hour Chart (4H) : This timeframe is the most critical. A clear Head and Shoulders pattern has formed, and crucially, the price has already broken below the neckline . This is a textbook bearish reversal signal. The Bollinger Bands are expanding, pointing to an injection of downside volatility . From a Wyckoff Theory standpoint, this breakdown represents a "Sign of Weakness" (SOW) following a distribution phase at the highs.
1-Hour Chart (1H) : The hourly chart confirms the breakdown with conviction. Price is trading well below the VWAP and the Ichimoku Cloud, both of which are now acting as overhead resistance. Any attempt to rally back to the broken neckline (around the 62.00-62.20 area) is likely to be met with significant selling pressure.
🔬 The Intraday Scalpel: 30M, 15M, & 5M Insights
For intraday traders, the path of least resistance is clearly down.
30M/15M Charts : These timeframes are displaying a strong, impulsive downtrend. Following the initial breakdown, we are seeing the formation of a Bearish Pennant or flag. This typically represents a brief pause as sellers reload for the next push lower. The RSI is hovering near oversold levels, so a minor bounce is possible, but this is likely a selling opportunity, not a reversal.
5M Chart : On the 5-minute chart, the VWAP is the key level to watch. As long as the price remains below it, bears are in full control. Scalpers should be wary of any sudden spikes upward, as they could be a bear trap designed to lure in buyers before the next decline. Watch for volume to increase on down moves as confirmation of the bearish intent.
⏳ Gann Theory & Price/Time Analysis
Applying the principles of W.D. Gann, the rejection occurred at a key Gann resistance angle. The price has now broken below a key support angle, suggesting an acceleration of the downtrend. Gann's range analysis points to the $58.00 - $58.50 area as the next major price magnet to the downside.
🎯 Actionable Trade Plan for the Week Ahead
Based on this comprehensive analysis, the bearish case is overwhelmingly strong.
The Primary Bearish Scenario 🐻
Entry: The ideal entry is to short a pullback to the broken Head and Shoulders neckline, targeting the 62.00 - 62.20 resistance zone. An alternative entry is to short the breakdown of the current bearish pennant, below 61.00 .
Targets: The first target is the psychological 60.00 level. The main target, derived from the Head and Shoulders pattern measurement, is the major support zone at 58.50 .
Invalidation: A strong and sustained 4H candle close back above the right shoulder of the pattern, specifically above 63.00 , would negate the immediate bearish thesis.
The Low-Probability Bullish Scenario 🐂
Entry: This is a counter-trend trade and is not recommended. It would require an exceptionally strong reclaim of the 62.50 level, effectively invalidating the entire Head and Shoulders pattern.
Targets: Resistance at 63.50 and 64.50 .
Invalidation: Any drop back below 62.00 .
Conclusion: The Evidence Points Down
The technical picture for Crude Oil is decidedly bearish. With a confirmed Head and Shoulders breakdown on the 4H chart, supported by weakness on both higher and lower timeframes, the path of least resistance is to the downside.
This week, the strategy is to sell the rallies . Be patient and wait for a high-probability entry near established resistance.
What are your thoughts on oil? Are you positioning for a further drop, or do you see a reversal in the cards? Share your analysis in the comments below! 👇
Disclaimer: This is not financial advice. This analysis is for educational purposes only. Always conduct your own research and manage your risk appropriately.

Crude Oil Trading Strategy for TodayThe spot market and capital are in resonance, and short-term support is clear.
1.Strengthening of spot structure: The near-month WTI contract has returned to a spot premium structure, and the Brent-WTI spread is stable, reflecting the expectation of short-term supply tightness and providing a fundamental support for the current price.
2.Dual benefits of inventory and capital: U.S. EIA inventories have been reduced for several consecutive weeks, and the latest published value is significantly lower than expected, confirming the marginal improvement in demand; trend trading funds have recently increased their long positions, driving short-term short-squeeze momentum.
3.Cost and reserve support: Warren Buffett's Western Oil holdings imply a long-term equilibrium price of WTI at approximately $58.2, and the current price of $60.26 is close to the value support range; the U.S. SPR is at its lowest level since 1990, reducing its ability to stabilize oil prices and strengthening the bottom support.
Crude Oil Trading Strategy for Today
buy:59.5-60
tp:61-61.5
sl:58.5
USOIL Is Very Bullish! Long!
Please, check our technical outlook for USOIL.
Time Frame: 1D
Current Trend: Bullish
Sentiment: Oversold (based on 7-period RSI)
Forecast: Bullish
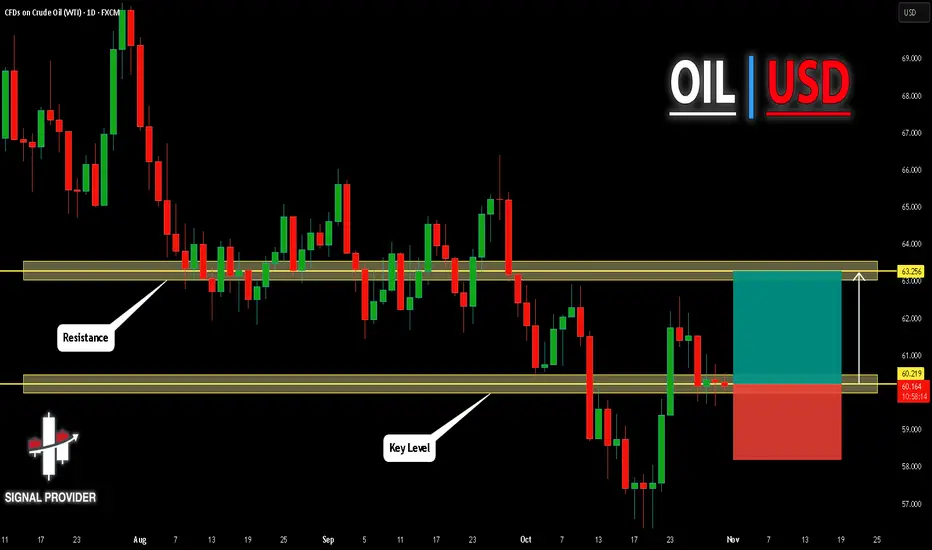
The market is approaching a significant support area 60.219.
The underlined horizontal cluster clearly indicates a highly probable bullish movement with target 63.256 level.
P.S
Please, note that an oversold/overbought condition can last for a long time, and therefore being oversold/overbought doesn't mean a price rally will come soon, or at all.
Like and subscribe and comment my ideas if you enjoy them!
USOIL H4 | Bearish Drop OffUSOIL is reacting off the sell entry, which is a pullback resitance that aligns with the 38.2% Fibonacci retracement and could drop from this level to the downside.
Sell entry is at 60.77, whichis a pullback resistance that lines up with the 38.2% Fibonacci retracement.
Stop loss is at 62.09, which is a swing high resistance that lines up with he 78.6% Fibonacci retracement.
Take profit is at 58.74, which is a pullback support that aligns with the 61.8% Fibonacci retracement.
Stratos Markets Limited (tradu.com ):
CFDs are complex instruments and come with a high risk of losing money rapidly due to leverage. 68% of retail investor accounts lose money when trading CFDs with this provider. You should consider whether you understand how CFDs work and whether you can afford to take the high risk of losing your money.
Stratos Europe Ltd (tradu.com ):
CFDs are complex instruments and come with a high risk of losing money rapidly due to leverage. 70% of retail investor accounts lose money when trading CFDs with this provider. You should consider whether you understand how CFDs work and whether you can afford to take the high risk of losing your money.

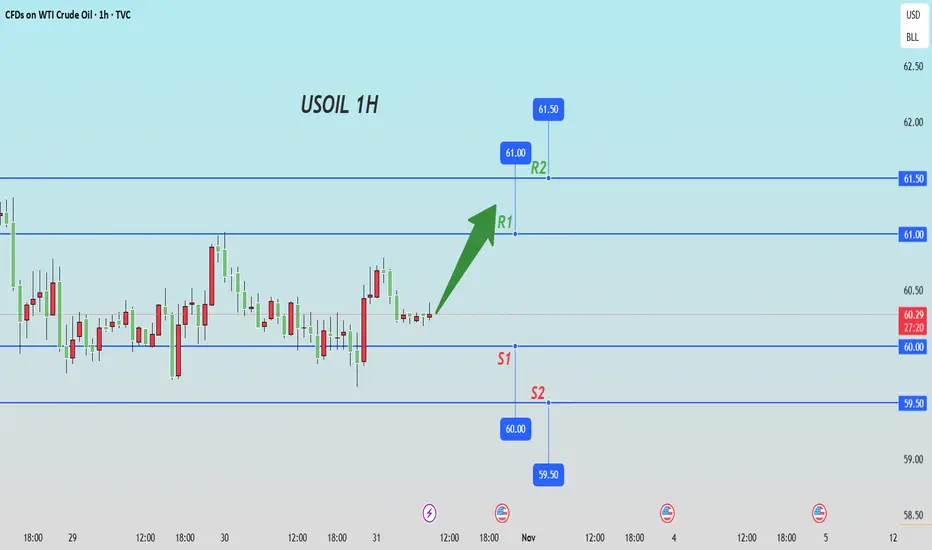
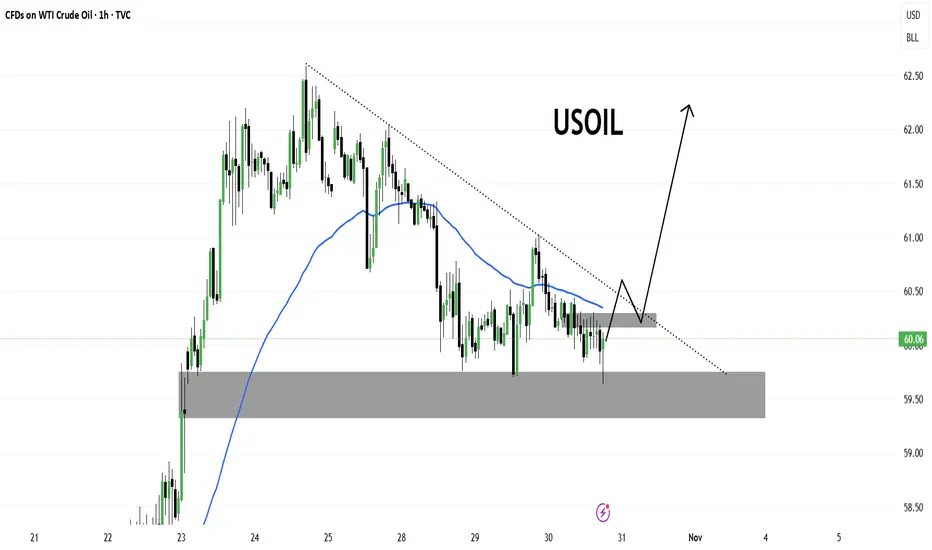
USOILCrude oil is currently trading around the $60.00 level, consolidating after a recent bearish phase. Price has respected the support zone near $59.50–59.80, forming a potential accumulation base.
A descending trendline is acting as dynamic resistance, while the 50-period moving average is flattening—indicating that bearish momentum is losing strength.
The projection suggests a possible breakout above the trendline, followed by a retest of the breakout zone before a potential rally toward the $62.00–62.50 area.
As long as the price holds above the support zone, the bullish scenario remains valid. A breakdown below $59.50 would invalidate this setup.
The gap is likely to be coveredThe price gaps tend to be covered. So I see the continuation of downtrend. Price is also likely to make a new lower low in a sharp move to the downside anytime soon.

"Policy + Spot" dual support, short-term recovery potentialThe expectation of Fed rate cut strengthens the financial attributes
The current market probability of a 25BP rate cut by the Fed in October is 88%. The implementation of the rate cut will lower the US dollar index (currently at 93.5, if the rate cut occurs, it may drop to 92.5), and the cost of non-US currencies for purchasing crude oil decreases - the Brent crude oil price denominated in euros may decrease by 3%-4%, stimulating non-US demand countries such as India and China to replenish stocks, and short-term pushing up oil prices.
Spot supply and demand are marginally tight
The Dubai crude oil premium in the Middle East spot market remains at 1.8 US dollars per barrel (higher than 0.6 US dollars a month ago), and the crude oil purchase volume of Chinese refineries in October increased by 28% (for replenishment demand), and the execution rate of OPEC+ for an increase of 13.7 thousand barrels per day in November was only 58% (Saudi Arabia and Russia did not fully increase production), the spot market supports the 60 US dollar price level.
Crude Oil Trading Strategy for Today
buy:59.5-60
tp:61-61.5
sl:58.5

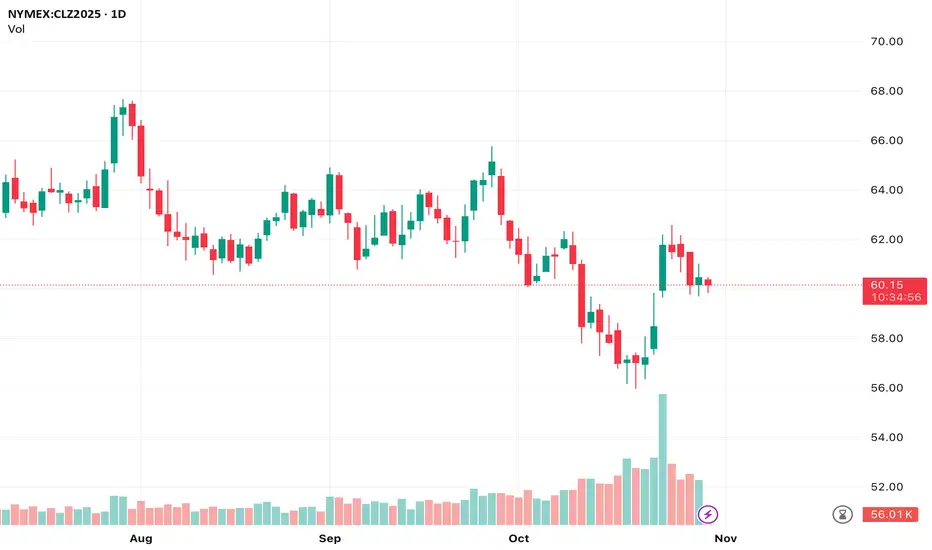
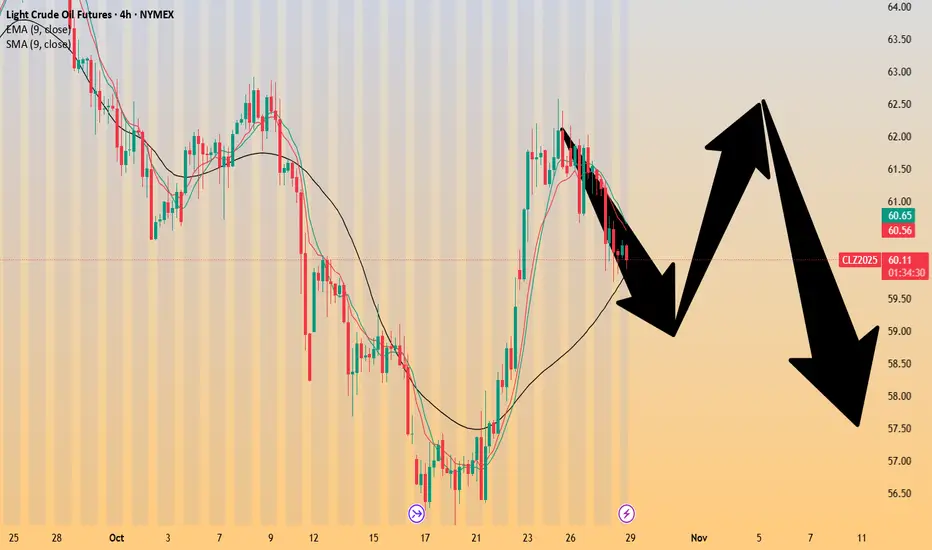
Crude Oil Futures (Dec 2025) Daily Chart Analysis
Crude Oil Futures (Dec 2025) Daily Chart Analysis
Price is trading around 60.15 after a bounce from the 56 area. The recent move up has slowed, shown by smaller candles and reduced volume. Structure shows a lower-high pattern overall, but the market is currently holding above a short-term higher low. This suggests consolidation, not a confirmed trend continuation yet.
Key Levels:
Resistance at 62. Price has rejected this zone twice.
Support at 60. Market is sitting just above this level.
Major support at 56. Strong reaction level where price last bounced.
What I See:
Volume increased on the push up, then faded.
Recent candles show hesitation, indicating indecision.
Price is ranging between 60 support and 62 resistance.
Bullish Scenario:
A break and daily close above 62 would signal upside momentum.
Targets: 64 then 67.
Bearish Scenario:
A break and close below 60 sets up a move toward 58 and potentially a retest of 56.
Current Bias:
Neutral. Price is consolidating. Waiting for a clear breakout or breakdown is prudent.
Range trades are possible between 60 and 62 with tight risk management.
Catalysts to Watch:
Crude reacts strongly to fundamentals including geopolitical events, US inventory data, and OPEC communication. Manage risk accordingly.
Follow for more. Happy Trading.
The Professor
USOIL H4 | Bearish Reversal from Pullback ResistanceUSOIL has rejected the sell entry, which is a pullback resistance that aligns with the 38.2% Fibonacci retracemnt and could drop from this level to the downside.
Sell entry is at 60.77, whichis a pullback resistance that aligns with the 38.2% Fibonacci retracement.
Stop loss is at 62.09, which is a swing high resistance.
Take profit is at 58.74, which is a pullback support that lines up witht he 61.8% FIbonacci retracement.
Stratos Markets Limited (tradu.com ):
CFDs are complex instruments and come with a high risk of losing money rapidly due to leverage. 68% of retail investor accounts lose money when trading CFDs with this provider. You should consider whether you understand how CFDs work and whether you can afford to take the high risk of losing your money.
Stratos Europe Ltd (tradu.com ):
CFDs are complex instruments and come with a high risk of losing money rapidly due to leverage. 70% of retail investor accounts lose money when trading CFDs with this provider. You should consider whether you understand how CFDs work and whether you can afford to take the high risk of losing your money.

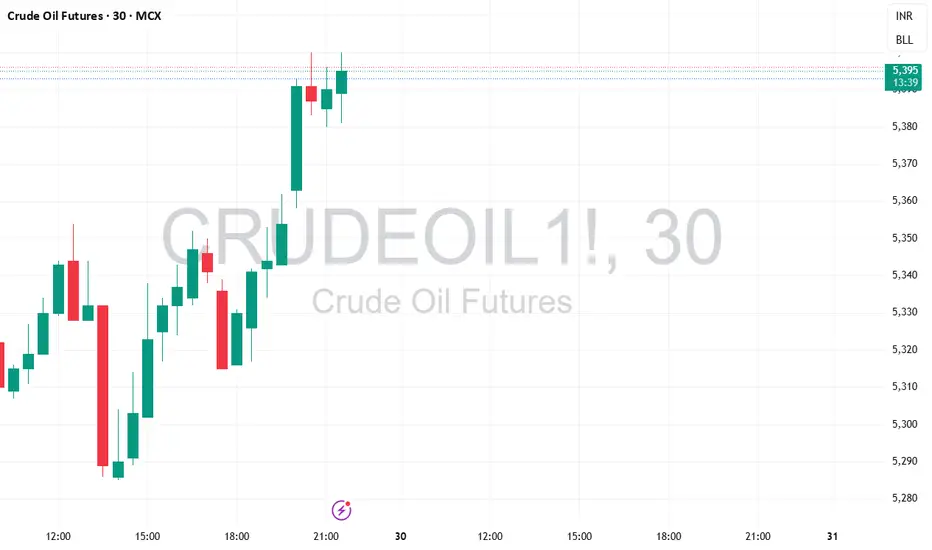
Crude Oil November Contract Breakdown Setup – 5450 PE in PlayMCX Crude Oil – November Contract
CMP: ₹5398
Bearish view
Holding 5450 Put Option (Expiry: 17 Nov 2025)
Avg Price: ₹251.50
Target: ₹320 to ₹325
Target valid till 14 Nov 2025
Tracking price action closely. Will reassess if momentum fades or structure breaks.
#CrudeOilOptions #MCX #OptionsTrading #TradeSetup #PriceAction #TradingViewIndia #DerivativeStrategy #PutOption
Sell crude oil around 62.00, with a target of 60.00-58.00Crude Oil Market Analysis:
Crude oil has been trending downwards with fluctuations recently. Our strategy remains to sell at higher prices; any rebound is an opportunity to sell. Today, watch for opportunities to sell around 62.00. Currently, the interest rate cut appears to be having an effective impact on crude oil. Our strategy remains unchanged: if it breaks below 60.00, consider selling on any small rebound.
Fundamental Analysis:
The Federal Reserve cut interest rates by 25 basis points as expected. The Fed lowered its benchmark interest rate by 25 basis points to 3.75%-4.00%, marking the second consecutive rate cut at its meeting, in line with market expectations...
Trading Recommendation:
Sell crude oil around 62.00, with a target of 60.00-58.00.

WTI OIL 1D MA50 rejection. Sell Signal.Last time (October 14, see chart below) we took a look on WTI Oil (USOIL), we gave a Buy Signal right at the bottom of its 3-month Channel Down, which eventually hit our 62.00 Target:
This time we have a Sell Signal as the price and the Channel's Bullish Leg got rejected on its 1D MA50 (blue trend-line). When that happened in September, the market started to decline and reached its lower Support.
As a result, we expect Oil to turn bearish here, targeting $56.00.
-------------------------------------------------------------------------------
** Please LIKE 👍, FOLLOW ✅, SHARE 🙌 and COMMENT ✍ if you enjoy this idea! Also share your ideas and charts in the comments section below! This is best way to keep it relevant, support us, keep the content here free and allow the idea to reach as many people as possible. **
-------------------------------------------------------------------------------
💸💸💸💸💸💸
👇 👇 👇 👇 👇 👇

CRUDE OIL Local Short! Sell!
Hello,Traders!
CRUDE OIL is reacting from the horizontal supply area after liquidity above previous highs was taken. Expect continuation to the downside as the market rebalances toward the target level.
Sell!
Comment and subscribe to help us grow!
Check out other forecasts below too!
Disclosure: I am part of Trade Nation's Influencer program and receive a monthly fee for using their TradingView charts in my analysis.

Crude Oil is InflationOne of the best ways to gauge where inflation is heading is by tracking the relationship between crude oil prices and the U.S. Consumer Price Index (CPI).
If we take a moment to observe their movement from the 1980s to today, we can see that they have generally moved in tandem. The year of their peaks and troughs are in synchronization.
So, who is leading whom?
Is it the inflation data that drive crude oil prices higher or lower — or is it crude oil prices that influence the inflation trend?
WTI Crude Oil Futures & Options
Ticker: MCL
Minimum fluctuation:
0.01 per barrel = $1.00
Disclaimer:
• What presented here is not a recommendation, please consult your licensed broker.
• Our mission is to create lateral thinking skills for every investor and trader, knowing when to take a calculated risk with market uncertainty and a bolder risk when opportunity arises.
CME Real-time Market Data help identify trading set-ups in real-time and express my market views. If you have futures in your trading portfolio, you can check out on CME Group data plans available that suit your trading needs www.tradingview.com

Crude oil: Sell around 62.50, target 60.00-58.00Crude Oil Market Analysis:
Crude oil fell again, in line with our expectations. Today's crude oil price remains bearish. Sell on any rebound. The strategy for crude oil remains to follow the market. Consider selling if crude oil rebounds to 62.50 today. This level has been successfully suppressed. The impact of crude oil inventory data is only temporary. There are no recent data that will have a significant impact on crude oil prices. Focus on the impact of the Federal Reserve's monetary policy.
Fundamental Analysis:
The previous smooth Sino-US trade negotiations were positive for the US dollar, leading to a sharp drop in gold's safe-haven sentiment. Another major data point this week is the Federal Reserve's monetary policy.
Trading Recommendations:
Crude oil: Sell around 62.50, target 60.00-58.00.
USOIL Bearish swing tradeEntry from last higher low breakout
RRR 1:2
overall in bearish momentum
have touch it's major support zone before going up

Oil bounced from POC. Sanctions aganst russia did't push it upOil bounced from POC. Sanctions aganst russia did't push it up
which is so good for down trend)
in a case of retest of POC - u can take short trade with goals $55 and $49

MCX Crude Oil: Bearish Setup with 5550 PEMCX Crude Oil – November Contract
CMP: ₹5467
Bearish view
Bought 5550 Put Option (Expiry: 17 Nov 2025)
Target: ₹320 to ₹325
Target valid till 14 Nov 2025
Tracking price action closely. Will reassess if momentum fades or structure breaks.
#CrudeOilOptions #MCX #OptionsTrading #TradeSetup #PriceAction #TradingViewIndia #DerivativeStrategy #PutOption #ExpirySetup

Crude Oil Long Idea (WTI, 15m)After an extended correction, WTI has reached the lower boundary of the ascending channel, where buying volume spikes are appearing. The market is testing support near $60.70–$60.50, aligning with the median line structure from previous swings.
A potential reversal setup may form if price holds above this zone and reclaims $61.20.
The first bullish target lies near $62.30–$62.60, followed by the upper channel resistance around $63.50.
Bias: short-term long within the broader bullish channel; invalidation if candle closes below $60.00.
In essence — buying oil at the lower edge of the channel, expecting a rebound toward midline resistance.
