Crude OilFRED:DCOILBRENTEU
View from the Daily Timeframe. A bullish market structure forming.
If I bought. I would go to a price take profit price of 98.00.
Open Interest

NQ Power Range Report with FIB Ext - 11/18/2022 SessionCME_MINI:NQZ2022
- PR High: 11760.50
- PR Low: 11718.25
- NZ Spread: 94.25
Evening Stats (As of 1:25 AM)
- Weekend Gap: -0.39% (filled)
- 8/19 Session Gap: -0.04% (open > 13237)
- Session Open ATR: 343.30
- Volume: 26K
- Open Int: 247K
- Trend Grade: Bear
- From ATH: -30.2% (Rounded)
Key Levels (Rounded - Think of these as ranges)
- Long: 12391
- Mid: 11820
- Short: 10678
Keep in mind this is not speculation or a prediction. Only a report of the Power Range with Fib extensions for target hunting. Do your DD! You determine your risk tolerance. You are fully capable of making your own decisions.

NQ Power Range Report with FIB Ext - 11/17/2022 SessionCME_MINI:NQZ2022
- PR High: 11784.50
- PR Low: 11769.00
- NZ Spread: 34.50
Evening Stats (As of 12:05 AM)
- Weekend Gap: -0.39% (filled)
- 8/19 Session Gap: -0.04% (open > 13237)
- Session Open ATR: 347.45
- Volume: 18K
- Open Int: 258K
- Trend Grade: Bear
- From ATH: -30.0% (Rounded)
Key Levels (Rounded - Think of these as ranges)
- Long: 12391
- Mid: 11820
- Short: 10678
Keep in mind this is not speculation or a prediction. Only a report of the Power Range with Fib extensions for target hunting. Do your DD! You determine your risk tolerance. You are fully capable of making your own decisions.

BTC Open Interest has broken through resistanceBitcoin price was half asleep.
It seems that now the dormant volcano has woken up.
Overview
Open interest is a traditional term used to quantify the total dollar value of investors' positions in a futures contract.
These positions can be long or short. For example, imagine that the Bitcoin futures contract has just opened and Alice buys $100.
At this point, both volume and open interest equal $100. So Alice decides she wants to sell her half of her position.
Therefore, by closing half of the market's open positions, open interest decreases to $50, while volume increases to $150.
Open interest aggregates all positions and gives traders an idea of the dollar value that is at stake for a given contract.
For perpetual swaps, open interest can be held for an indefinite period, while for futures contracts, open interest reaches zero the moment a contract expires and usually starts to decline a few weeks before the settlement date.
How can I use it?
Similar to volume, open interest can be used to gauge trend strength.
For example, if open interest increases as the price increases, this indicates that more longs are being opened.
On the contrary, if prices increase and open interest rates decrease, it points to the weakening of the trend as derivatives traders' positions are being closed.
Therefore, the example above points to strong conviction among perpetual swap traders as the amount of open positions has increased along with the price of Bitcoin.
Source:
resources.intotheblock.com

Large Move to ComeOpen interest on Binance (yellow line above) has increased significantly since mid June, while open interest on CME (blue line above) has stagnated. An over-heating retail derivative market along with a weakening institutional derivative market often leads to price declines for bitcoin.
Liquidity issues continue and long-term holders are still selling in losses. With the U.S. Dollar Index at all time high, the rising opportunity costs lower the chance of entering a cyclical bull market. Furthermore, bitcoin has retested the 17-18k support from June many times now. Without signs of strength, the more times this level gets tested, the more likely it’s going to break.

btcusdtperpHello, dear trader, according to the volume and open profit and other indicators, the probability of this move is higher
This is my opinion
I will be happy to contribute and comment

ABCAPITAL looks good for Breakout in Weekly TimeFrameNSE:ABCAPITAL
Abcapital looks good for potential breakout in Weekly . breakout might be happen around 112-115. but after breakout , NSE:ABCAPITAL might do consolidation or trendline retest . hence need to be watchful
A/c to Derivative Data
1. New Long addition seen
2. High Interest in Future Open Interest

BTC Relief RallyThe open interest money flow index is now extremely oversold on the daily timeframe. With the futures market now contributing to 80-90% of BTC’s trading volume, this index has been extremely useful in the current cycle.
Institutional bulls also have signs of returning. After trading at discounts since early May (BTC $40k), institutional spot traders on Coinbase are finally trading at premiums compared to retail spot traders. On the futures market, both asset managers and leveraged funds have increased their net positions on CME in the last week of July. Furthermore, all of the trader categories on CME are now net long, which is a rare occurrence. While the increase in open interest on CME has not caught up with that on Binance, the existing institutional participants have changed from a bearish bias to a bullish one.

Short XAU USD as VSA studiesDollar is gaining strength price and OI comparison and XAU OI is showing bearish sign so it is quite possible that it will go short.

TATA MOTORSHello and welcome to this analysis based on Harmonic Trading Patterns
In the daily time frame it has made a Bearish Harmonic ABCD pattern with perfect balance symmetry.
It could retrace down to 440 - 430 as long as it does not trade above 461
As per Option Data also July Series 460CE is seeing fresh shorts being added and 440PE is seeing short covering. While August Series 460CE has already formed a very strong OI resistance with more being added currently.

BELUSDT - Short Open interest is struggling to catch up. Sign of exhaustion! I'm anticipating a correction to 0.6 fib level, or if we're lucky, we might test the support @ 0.436.
If the price manages to close above 0.94, I'd close my position.

Bitcoin levels to trade-can we break out to $23000?BYBIT:BTCUSD
Bitcoin has broken out of its previous range and looks like it is testing the previous resistance as support.
I look at the trade I took yesterday and the levels I am waiting for. Bullish and bearish scenarios could play out and it's important to be ready for both.
Not Financial Advice. DYOR. Papertrade before trading with real money.
Safe trading!
Shawn

HNTUSDT - Short - 1:7 ReturnHigh volume + open interest divergence is the perfect recipe for exhaustion. The recent rally was mostly short-covering hence why no significant uptick in O.I.
I anticipate a corrective move to the 0.5 fib level. If the price manages to close above 8.56, or if the O.I catches up, I'd close my position.

How did Open Interest tell me: Stay long as BTC Dumped!?!BYBIT:BTCUSD
I was in 3 long trades as Bitcoin dumped on the 26th of May 2022.
I had 2 choices. Close my longs because I saw price dumping below my entry
or
look at what Open interest was telling me to determine if this was a fakeout.
I saw price dropping as OI was dropping. This meant that longs were closing out their positions, which means that when this ended, price could reverse quickly.
Longs were closing out their positions and re-entering as shorts. As soon as this selling dried up, Longs started entering and then suddenly shorts were being liquidated, pushing the price up again.
This is known as a stop run. Hit long stops and then hit short stops. Be aware of this kind of fakeout as it happens again and again!
Learn to trade the retest and why it is important not to short at support and inversely why it is NB not to long at resistance, UNLESS you get a retest of that level!
Not financial advice, DYOR. Papertrade before using real money.
If this educational snipped helped you, please consider giving it a thumbs up and follow for more like this!
Trade Safely and Learn something every day!
Shawn

Relationship Between Price & volume & open interesthello everyone.
today i want to explain the relationship between price and volume and open interest.
we know that open interest means the number of positions (long/short)that is open.(in short OI)
if the price going up and volume and OI is going up too we can see very strong bullish sentiment in market.
if price going up but volume and OI going down it means that the price weakening and long positions is closing
so we have bearish sentiment in market.
if the price going down but volume and OI going up it means traders interst to open short positions
and the sentiment is very bearish.
and in the end if the price is going down and vol and OI going down too we can understand that
traders are tired from falling and want to close their short positions so we have a bullish sentiment in market.
hope that this is useful for you.
if you support me i will try to be better day by day...
thank you friends

High sell volume + O.I dropPrice is rising while the O.I is dropping. Which means the recent rally was mostly short-covering/liquidation hunt.
Take profit is around 4.82. If the price closes above 5.7 with an Open interest of 2M or higher, I'll close my position.

Going short after tomorrow Ethopen interest is down ( people are closing positions)
RSI is in a bearish divergence ( losing strength)
and prise is forming and ascending wedge
Options on eth are at 3300 for fridays weekly
www.coinoptionstrack.com

NQ Power Range Report with FIB Ext - 3/11/2022 SessionCME_MINI:NQH2022
- PR High: 13615.50
- PR Low: 13558.00
Evening Stats (As of 12:25 AM)
- Gap: = N/A
- Session Open ATR: 462.92
- Volume: 24k
- Open Int: 237k
- Trend Grade: Neutral
- From ATH: -19.0% (Rounded)
Key Levels (Rounded - Think of these as ranges)
- Long: 14675
- Mid: 13500
- Short: 12390
Keep in mind this is not speculation or a prediction. Only a report of the Power Range with Fib extensions for target hunting. Do your DD! You determine your risk tolerance. You are fully capable of making your own decisions.

High sell volume + O.I dropThe idea is the same as previous trades. We look for high volume with open interest divergence. ZEN has rallied with a decent volume, but O.I is not up to the mark. This suggests the recent rally was mostly short covering.
If we manage to close above 42.8 I'd close my short/ if the O.I catches up. Take profit is at 0.6 retracement of the current range.

#Oil - Is shorting this market wise?As the oil market continues to rise, there are clear intentions from a number of market analysts to short the Oil market.
Keeping an eye on the current futures expiries for WTI Oil there are strong indications that buyers are easing off, while sellers are coming in strong. While Geopolitical issues could change and of course change the direction of the market, this has not happened.
Let's focus on what we know! there is an overall decrease in the open interest across the market, while the price continues to rise. This is indicating that there is divergence in the interest in this trend, and we should be on high alert that the uptrend is aggressively slowing down.
But, with all this information we still can't change the overall focus that there is a global increase in oil prices and the market has not indicated a turn.
Summary: the current balance area is just below $90, and until we see a new balance area created or a drop below $90 we still need to go with what is obvious.
If you want to talk more about trading/analysing the markets check out our Tradingview profile or send a message via the Tradingview chat feature.
"Trend is your friend UNTIL IT BENDS"
Happy Trading
Ionic Capital - Little Big Movement

GOLD. Decline from 50%-61.8% Fibo range.The GOLD trading instrument will most likely continue its decline from the 50%-61.8% Fibo range within wave (C).
The downside targets are the huge accumulation of PUT options that CME professional participants use to hedge their futures contracts at the 1750, 1720 and 1700 levels.
At the level of 1750, at the moment, there are hedgers (professional market participants whose goal is solely to hedge the currency risks of their clients), which once again confirms the likely downward movement.

GOLD. A price decrease in wave (c) is likely.It is likely that the trading instrument will decrease in wave (c) with initial targets in the area of accumulation of PUT option contracts, with which professional market participants hedge their BUY futures transactions, in the amount of $840M and $838M. Upon reaching these levels, it is very likely that a corrective growth will occur, followed by a continuation of the decline already in the area of 1700, where there are accumulations of PUT option orders in the amount of $2.5B, as well as the level of hedgers (professional market participants whose goal is solely to hedge the currency risks of their clients).

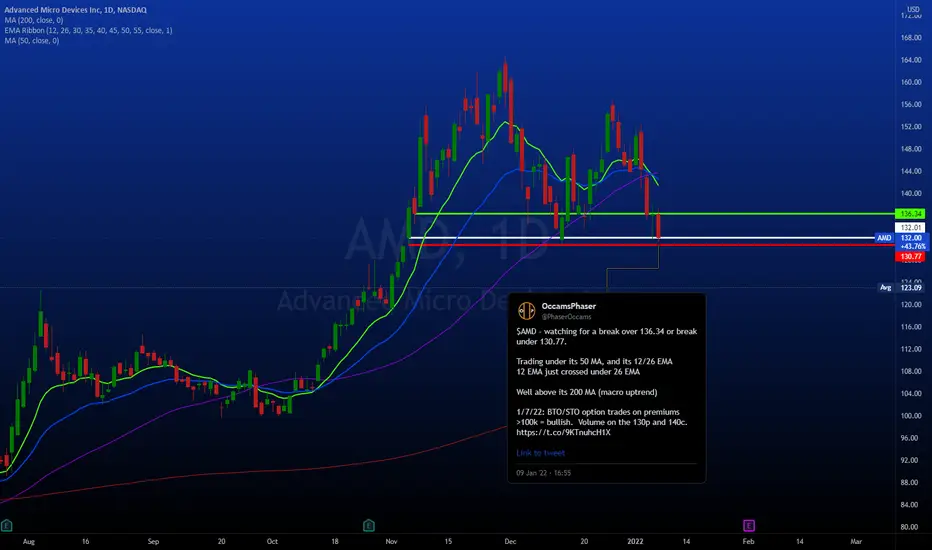
AMD levels to watch going in to 1/10/22NASDAQ:AMD
$AMD - watching for a break over 136.34 or break under 130.77.
Trading under its 50 MA, and its 12/26 EMA
12 EMA just crossed under 26 EMA
Well above its 200 MA (macro uptrend)
1/7/22: BTO/STO option trades on premiums >100k = bullish. Volume on the 130p and 140c.
Lots of OI on the 150c\1 35p - watch for changes in these
Local support at 132.01 - created on Nov 4, tested on Dec 14, confirmed on Jan 7
AMD closed on 1/7 at 132.00
If AMD breaks below 130.77 = consider bearish trades
If AMD breaks above 136.34 = consider bullish trades