SPX – GEX 6800 Put Support Holds🔶 SPX – 6800 Put Support Holds, Pricing Skew Mean-Reversion 🔶
On the daily chart, SPX found clean support at the 6800 put level , tied to the Jan 23 expiration . That level absorbed yesterday’s downside pressure, and price has been rotating higher since the bounce. 🟢
🔶 Options Structure 🔶
From an options structure perspective, the range is now clearly defined:
6800 acts as the primary put support 🔴
6915 marks the next call resistance on the weekly expiration 🟢
One of the most important signals comes from the Options Oscillator . Yesterday, put pricing skew reached a historically extreme level , indicating significant put overpricing relative to calls. Since then, we’ve seen a sharp mean-reversion in skew, suggesting that downside hedging pressure is easing.
That said, caution is still warranted . SPX remains below the High Volatility Level (HVL) , a regime where price action tends to be faster and more reactive, with elevated volatility. 🔵
If 6800 continues to hold , the next key test is the HVL zone around 6895 . A reclaim above HVL would shift the regime toward more controlled price behavior and opens the path toward 6915 call resistance as the next upside reference. 🟢
🔶 Key Levels to Watch 🔶
6800 – put support / downside anchor 🔴
6895 (HVL) – regime pivot 🔵
6915 – next call resistance (weekly) 🟢
As long as price holds above 6800 , the structure favors continued upside rotation , but sustained strength likely requires a reclaim above HVL . Failure to hold 6800 would quickly reintroduce downside volatility .
Optionstrading

GOOGL Alphabet Options Ahead of EarningsIf you haven`t bought GOOGL before the rally:
Now analyzing the options chain and the chart patterns of GOOGL Alphabet prior to the earnings report this week,
I would consider purchasing the 305usd strike price Calls with
an expiration date of 2026-1-16,
for a premium of approximately $8.30.
If these options prove to be profitable prior to the earnings release, I would sell at least half of them.

SPX – GEX Back to Positive🔶 SPX – HVL Reclaim & GEX Shift 🔶
SPX briefly traded below the High Volatility Level (HVL) yesterday, entering a 🔴 negative GEX regime , which increased downside sensitivity and intraday volatility. However, that breakdown failed to follow through.
Price has since reclaimed the HVL , and based on the 01/16 GEX profile , SPX is now back in 🟢 positive GEX territory , signaling a structural shift away from downside acceleration and back toward dealer-supported price behavior.
On the daily chart, this reclaim occurred directly off the rising trendline , which has defined the broader uptrend. The successful defense of this trend support suggests that the move below HVL was a temporary liquidity sweep rather than a regime change.
With HVL reclaimed and GEX flipping positive again, 🟢 upside flows regain control , and price becomes more responsive to call-side positioning rather than put hedging pressure.
🔶 Options Structure – Upside Reference 🔶
From an options structure perspective, the next major upside reference is the 7000 level , which represents:
a key call resistance zone
the dominant upside magnet in the current positive GEX environment
a natural extension target following the trendline bounce
🔶 Key Structure to Monitor 🔶
HVL – reclaimed, now acting as regime pivot 🟢
Rising trendline – trend integrity confirmed 🟢
Positive GEX (01/16) – supportive dealer positioning 🟢
7000 – primary upside target / call resistance 🟢
As long as SPX holds above HVL and the rising trendline , downside volatility should remain contained, and 🟢 rotation toward 7000 remains the higher-probability path. Failure to hold HVL would be the clearest signal that 🔴 negative GEX dynamics are reasserting.

IONQ (swingtrading ) Market is Bearish right now, be awake
---------------------
-The price couldn’t break below the 50 SMA on IONQ
-It moved sideways for a while and is now breaking out
-The uptrend is still intact

BULL – In My Top 10 Picks for 2026: Is Webull the Next HOOD?I’ve been following BULL (Webull) closely, and it’s firmly in my top 10 picks for 2026. Structurally, the story is very compelling.
Retail participation in financial markets continues to grow, and platforms that serve these investors—brokerages like Webull—are direct beneficiaries of this trend.
When I think about the trajectory, BULL reminds me a lot of our early calls on HOOD.
Robinhood currently trades at a market capitalization of roughly $97 billion. BULL, on the other hand, is valued at only around $4 billion.
That gap highlights the potential upside if Webull can continue to grow its user base and improve monetization.
The numbers alone are not the full story, of course. Financial results and execution matter, and Webull will need to prove that it can convert its growing user base into consistent revenue streams.
But structurally, the ingredients are there. As user monetization improves, I expect financial performance to start reflecting this, which could be a major catalyst for the stock.
The stock's 52-week range of $7.57 to $79.56 further fuels my bullish stance.
After dipping to its lows amid broader market volatility, BULL has shown resilience, trading around $8.16 as of mid-January 2026.
This setup strongly reminds me of our early HOOD call positions when the stock was trading around $9, back in its post-IPO correction phase. Robinhood eventually surged as retail trading boomed, and I anticipate a similar catalyst for Webull—perhaps through strategic partnerships, international expansion, or even acquisition interest in a consolidating industry.
In my view, BULL represents a rare combination of structural tailwinds, compelling valuation, and optionality. For those looking for a top pick for the year, it checks all the boxes.

Options Blueprint Series [Intermediate]: Lunar Timing and ThetaIntroduction
This edition of the Options Blueprint Series focuses on gold futures and micro gold futures, using an iron condor options structure to explore how time decay (theta) can be positioned in an environment where signals conflict rather than agree.
Gold has been trading at elevated levels, attracting strong participation from momentum-driven traders while simultaneously showing signs of short-term exhaustion. This creates a valuable learning environment for options traders, particularly those interested in non-directional strategies that rely more on time and range behavior than outright price direction.
This article is presented as a case study. All tools, indicators, and trade structures discussed are used for educational purposes only. Lunar timing, in particular, is included as a belief-based analytical lens used by some market participants, not as a predictive mechanism.
Market Context: Gold at Elevated Levels
Gold futures have experienced a powerful rally since the reopening of U.S. Sunday evening trading hours, extending an already strong longer-term uptrend. Price is now operating at new all-time highs, a condition that often amplifies emotional behavior among trend followers.
In such environments, markets frequently display two competing forces:
Continued upside pressure driven by momentum and fear of missing out
Short-term vulnerability driven by overextension, crowding, and mean-reversion dynamics
Rather than attempting to resolve which force will dominate, this Options Blueprint explores how options structures can be used to frame uncertainty itself.
Analytical Inputs Used in This Case Study
This framework combines multiple analytical perspectives. None are presented as definitive signals; instead, they are used to illustrate how diverse inputs can shape options structure selection.
Lunar Timing (Moon Phases Indicator)
The chart highlights waxing and waning moon phases:
Waxing moons are displayed in blue
Waning moons are displayed in gray
The current market condition coincides with a waxing moon phase, which some traders interpret as a potentially bearish timing window. It is important to stress that lunar analysis is belief-based, not empirically causal. Its inclusion here is intentional for educational diversity and contextual layering, not validation.
Bollinger Bands® on Multiple Timeframes
Two Bollinger Bands® sets are applied:
One based on the daily timeframe
One based on the weekly timeframe
Price is approaching, and in some instances penetrating, the upper bands on both timeframes simultaneously. This alignment often signals volatility expansion and late-stage trend behavior, increasing the probability of range stabilization or consolidation, even if the broader trend remains intact.
RSI and Divergence
The Relative Strength Index is set to standard parameters: Length = 14
A bearish divergence is visible, where momentum fails to confirm new price highs. Notably, the
RSI length coincides numerically with half of a lunar cycle. This coincidence is observational only and does not imply a functional relationship.
Structural Support Below Price: UFO Context
Below current price, the chart highlights UFOs (UnFilled Orders) clustered near 4,527. These represent areas where prior price discovery was incomplete, often acting as zones of liquidity and structural interest.
This region introduces an important counterbalance:
While short-term indicators lean bearish
Structural market mechanics suggest potential downside cushioning
This combination reinforces the idea of a bounded market environment, rather than a clean directional thesis.
Why an Iron Condor Fits This Environment
When markets present conflicting directional evidence, strategies that benefit from price containment and time decay become particularly relevant.
An iron condor:
Does not require a bullish or bearish forecast
Defines risk in advance
Benefits from theta as time passes
Allows strike placement around known volatility and structure zones
In this context, the iron condor serves as a framework for uncertainty, not a directional expression.
Iron Condor Structure (Illustrative Example)
This case study uses a January 27 expiration within the GCG contract cycle.
Call Side
Short 4,850 call
Long 4,900 call
Put Side
Short 4,500 put
Long 4,450 put
The strikes are positioned at approximately equal distance from current price, with the downside aligned near known UFO structural support.
Key Characteristics
Net theoretical credit: approximately 10.3 points
Theoretical maximum risk: approximately 39.7 points
Lower break-even: near 4,490
Upper break-even: near 4,860
As long as price remains within this range through expiration, the structure benefits from time decay. If price exits the range, losses are predefined and limited.
Theta: Time as the Primary Variable
In short-option structures, theta becomes the dominant driver of performance when price remains stable.
Key educational takeaways:
Theta accelerates as expiration approaches
Time decay is not linear
Volatility changes can amplify or offset theta
Direction matters less than location and pace
This structure highlights how patience and risk definition often matter more than directional conviction.
Managing an Iron Condor
There are many ways traders manage iron condors as conditions evolve. Without going into procedural detail, common approaches include:
Rolling positions forward in time
Adjusting strikes to rebalance risk
Reducing exposure on one side of the structure
Management decisions depend on price behavior, remaining time, volatility, and individual risk tolerance.
Contract Specifications: GC vs MGC
Gold Futures (GC)
Contract size: 100 troy ounces
Tick size: 0.1
Tick value: $10
Outright margin: $22,900
Micro Gold Futures (MGC)
Contract size: 10 troy ounces
Tick size: 0.1
Tick value: $1
Outright margin: $2,290
Both contracts follow the same structural logic, allowing traders to scale exposure while maintaining identical analytical frameworks.
Margin requirements for futures and futures options are dynamic rather than fixed, meaning they may vary over time in response to changes in market volatility, price levels, and risk conditions as determined by exchanges and clearing firms.
Depending on the broker and clearing arrangements, the specific margin requirement for an iron condor is frequently set near the position’s maximum theoretical risk; in this illustrative case study, that risk is approximately 39.7 points ($397), though margin treatment can vary.
Risk Management Considerations
Even defined-risk strategies carry meaningful risk. Key principles include:
Position sizing relative to account equity
Awareness of gap and volatility risk
Understanding assignment and expiration mechanics
Options limit risk by design, but do not eliminate uncertainty.
Final Thoughts
This Options Blueprint demonstrates how lunar timing, volatility structure, RSI behavior, and UFO context can coexist within a single framework, without requiring directional certainty.
The iron condor is not presented as a solution, but as a lens through which uncertainty can be structured, with time decay acting as the central variable.
Markets rarely offer clarity. Options allow traders to respond to that reality with structure, discipline, and predefined risk.
Data Consideration
When charting futures, the data provided could be delayed. Traders working with the ticker symbols discussed in this idea may prefer to use CME Group real-time data plan on TradingView: www.tradingview.com - This consideration is particularly important for shorter-term traders, whereas it may be less critical for those focused on longer-term trading strategies.
General Disclaimer
The trade ideas presented herein are solely for illustrative purposes forming a part of a case study intended to demonstrate key principles in risk management within the context of the specific market scenarios discussed. These ideas are not to be interpreted as investment recommendations or financial advice. They do not endorse or promote any specific trading strategies, financial products, or services. The information provided is based on data believed to be reliable; however, its accuracy or completeness cannot be guaranteed. Trading in financial markets involves risks, including the potential loss of principal. Each individual should conduct their own research and consult with professional financial advisors before making any investment decisions. The author or publisher of this content bears no responsibility for any actions taken based on the information provided or for any resultant financial or other losses.

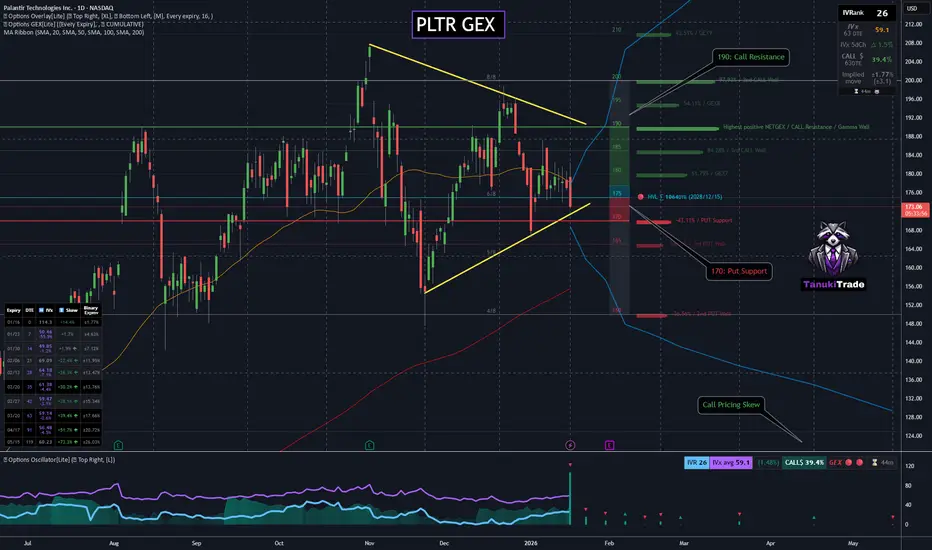
PLTR - GEX Compression Signals BreakoutPLTR has entered a tight volatility compression phase , both on price and in the GEX profile , which is now clearly squeezed between well-defined option levels. 🔵
🔶 Current Structure 🔶
Call resistance sits at 190
Put support is defined at 170
Price has been trading in a narrow range for over a week , confirming balance rather than trend 🔵
This type of GEX compression + price compression rarely persists for long, especially in a high-beta tech name like PLTR. Historically, these regimes resolve via sharp directional expansion , not slow grind.
From a regime perspective, PLTR is currently trading below the HVL , which keeps downside sensitivity elevated. A clean break below 170 would likely trigger 🔴 negative gamma dynamics , opening the door for accelerated downside.
🔶 Options Sentiment 🔶
Call pricing skew is elevated near 40% , signaling stronger call demand despite range-bound price 🟢
Implied volatility has been rising steadily over the past 5 sessions , confirming positioning ahead of a catalyst
Earnings are scheduled for 02/02 , adding fuel to an already compressed structure
🔶 Key Structure to Watch 🔶
170 – put support / downside trigger 🔴
190 – call resistance / upside breakout level 🟢
HVL – regime pivot 🔵
Compressed GEX profile – volatility expansion risk 🔵
With price, GEX, and volatility all compressing simultaneously, PLTR is setting up for a near-term breakout , with earnings acting as a potential catalyst. Direction will be determined by which side of the GEX range resolves first.
1/14 Recap – POI Breakdown Day (Bear Trend)
POI map did its job today — market gave us a clear bearish continuation and respected levels like stair-steps.
Key Levels (POIs):
26106.25 / 26083.50 / 26006.00 / 25920.50 / 25871.25
25738.75 / 25652.75 / 25615.50 / 25554.50 / 25538.00
25498.75 / 25464.75 / 25425.25 / 25385.50 / 25356.25 (FVG Mid)
Refs: PDH 26046.25 • PDL 25803.25 • NY AM High 26043 • NY AM Low ~25469.5
How it played:
• Bearish pressure stayed in control → breaks below POIs → retests failed → continuation to next POI.
• Best edge was confirmation + retest, not chasing.
Trades (QQQ 0DTE puts):
1. 618P x2 1.58 → 2.37 (+$158)
2. 617P x1 0.91 → 1.36 (+$45)
3. 614P x1 0.58 → 0.87 (+$29)
4. 613P x1 0.27 → 0.01 (-$26) (late/decay lesson)
Stats: 4 trades | 3W/1L | +$206 | 75% WR
Lesson of the day:
✅ Take the first clean continuation and retest failures at POIs.
❌ Avoid midday/late entries unless there’s a fresh A+ setup (decay eats).
Not financial advice — just journaling + execution review.

ServiceNow (NOW) — Trading at Discount Zones
I’m looking at ServiceNow (NOW) as a potential trade idea. In my view, the stock is currently trading in a discount zone. Most professional analyst ratings still classify NOW as a Strong Buy, with 12 month price targets roughly ranging from the $180s on the low end to the $260s on the high end.
From a liquidity and structure perspective, I’m watching $136 as a nearby liquidity area, with a stronger and more meaningful support zone around $129, where prior liquidity from May 2024 sits. That zone has historically acted well as support, and I want to see continued acceptance above it.
We also have a key catalyst ahead with earnings on January 28, so patience and reading institutional intention is critical in the coming sessions. Historically, NOW has reacted bullish in 9 of its last 12 earnings, with an average post-earnings move of around +2.5%, so this is a name that tends to reward proper positioning. That said, the market may still adjust and sweep liquidity first before revealing its true direction.
My personal Trade structure Idea, Buy Shares for mid term investment or an options spread
Sell Short Put: 130
Buy Long Put: 125
Expiration: March 20
Risk: ~$500 (per spread)
Net Credit Received: ~$120 (Approx.)
That $120 credit on ~$500 of risk represents approximately a 24% return per contract. The number of contracts depends on each trader’s portfolio size and risk management, but this structure can be executed with as little as ~$500 per spread.
The thesis is that NOW does not need to rally. As long as price remains above the short strike, time decay works in favor of the position. If price consolidates or slowly moves higher, I’ll look to manage profits before expiration rather than waiting passively.
This is a patience trade, focused on structure, liquidity, and risk management, I’ll continue watching price action closely and will share updates as part of my trading journey.
Questions or feedback are always appreciated. If you have any questions about my strategy, options spreads, or how I approach liquidity and risk, feel free to reach out. I answer everything for free. Your feedback helps me grow, and we all learn in the process.
This is not a recommendation. This post is part of my personal trading journal.
Options spreads are intermediate to advanced strategies and should not be traded without proper education, proper risk management, and a full understanding of the risks involved.
#777Bless

Why Is Duolingo Down 70% from ATH - Analysis1) Why Duolingo’s Stock Fell ~70% from Its ATH:
Duolingo’s stock peaked around $540+ in May 2025 and has since fallen sharply (~65–70% down). Main reasons for the drop:
-Sentiment / Valuation Concerns:
Investors have been worried about slower near-term growth, especially in bookings and guidance. Analysts say the company’s long-term narrative isn’t broken, but short-term worries dragged the stock down.
-AI Competition Fears:
Some investors feared that advances in AI (like GPT-based tools) could reduce Duolingo’s need. However, some analysts argue those fears are overblown, and Duolingo is incorporating AI itself.
-Guidance & Expectations:
Even with strong revenue growth, some guidance for the future was viewed as cautious, which disappointed the market. So the stock was driven down more by expectations and fears than by a collapse in underlying business performance.
2) Company Fundamentals: Strengths
-Strong Revenue Growth:
Revenue grew strongly: 40%+ year-over-year, heading toward $1B in 2025. Revenue growth has been consistent for years.
Large & Growing User Base:
Duolingo surpassed 50 million daily active users (DAUs) with 36% growth year-over-year, and monthly users are huge. Large monthly active user base shows strong engagement and stickiness.
Diversified Offerings:
Duolingo expanded from just language to chess, music, math and is using AI to create content faster. Multiple revenue streams: premium subscriptions, in-app purchases, English Test certification.
-Freemium Monetization Model:
This attracts a huge audience and converts some free users into paying subscribers over time.
Business of Apps
-AI Integration:
The company is using AI to personalize lessons, which could help user retention and future monetization.
3) Company Weaknesses / Risks:
-Valuation Uncertainty:
Even though fundamentals are decent, many investors think the valuation needs to justify growth prospects, and when expectations slow, the stock suffers.
-AI Disruption Narrative:
Some fear AI language tools could make Duolingo less indispensable; however, analysts say Duolingo’s gamified, interactive experience plus its subscription model still differentiates it.
Profit vs Growth Tradeoff:
Recent shifts in focus toward long-term growth rather than immediate monetization undercut short-term results in the eyes of some investors.
-Guidance Disappointments:
Some analysts say guidance hasn’t been strong enough to excite markets recently.
Disclaimer:
This analysis is for informational and educational purposes only and does not constitute financial advice, investment recommendation, or an offer to buy or sell any securities. Asset prices, valuations, and performance metrics are subject to change and may be outdated. Always conduct your own due diligence and consult with a licensed financial advisor before making investment decisions. The information presented may contain inaccuracies and should not be solely relied upon for financial decisions. I am not a licensed financial advisor or professional trader. I am not personally liable for your own losses; this is not financial advice.

MSFT Market Structure, Liquidity & my Trade Journal 1-2 monthMicrosoft continues to present one of the cleanest large-cap structures in the market right now.
Market & Financial Context
From a broader standpoint, MSFT remains financially solid, with strong cash flows and continued leadership in cloud and AI. Even during recent periods of market rotation, the stock has held relative strength versus the broader tech space — a behavior that typically aligns with sustained institutional involvement rather than distribution.
Liquidity & Participation
What stands out most at current levels is how price interacts with liquidity. Pullbacks have been controlled and occur into areas where liquidity is already present, rather than breaking structure impulsively. Volume expands selectively on advances and contracts during retracements, which suggests that larger participants are not exiting positions, but rather managing inventory efficiently.
In environments like this, price does not need to trend aggressively higher to remain constructive. Stability above key liquidity zones is often enough. When liquidity is respected, time-based strategies become more favorable than purely directional bets.
Technical Structure
Technically, MSFT continues to respect its higher-timeframe structure. Key demand areas remain intact, and no meaningful breakdown has occurred. As long as price holds above these zones, downside risk remains defined and manageable, while upside remains optional.
Options trade (Opened Today)
Based on this context, I opened a bullish put credit spread expiring Feb 27:
Sell Short put: 455
buy Long put: 450
Risk $500 (per contract) Net Credit received $99
In simple terms, this setup risks approximately $500 per spread to potentially make $99, which represents roughly a 19% return on risk if held to expiration to Feb. 27
The number of contracts is always adjusted based on individual portfolio size and risk tolerance, but this trade can be executed with a minimum risk of around $500 per position.
The thesis is that MSFT does not need to rally. As long as price remains above the short strike, time decay works in favor of the position. If price moves higher or consolidates, I’ll look to manage profits before expiration rather than waiting passively.
Questions or feedback are appreciated. If you have any questions about my strategy, options, spreads, or how I approach liquidity, feel free to reach out. I answer everything for free. Your feedback also helps me grow, and we all learn in the process.
This is not a recommendation. This post is part of my personal trading journal.
Options spreads are intermediate to advanced strategies and should not be traded without proper education, risk management, and understanding of the risks involved.
#777Bless

NVDA – Consolidation Breakout Toward 200 Core Resistance?🔶 Downside structure
Looking at NVDA on the daily chart, one level clearly stands out on the downside:
170 PUT support , where price has bounced multiple times in the past. This level has been well defended by put positioning, creating a solid structural floor. 🔴
🔶 Consolidation behavior
Over the past weeks, price spent a considerable amount of time sitting on the 50-day moving average , repeatedly testing it from below but failing to break through decisively. That dynamic now appears to be changing. NVDA is starting to push higher, suggesting a potential breakout from this consolidation range. 🟢
🔶 Upside reference level
If this breakout holds, the next key level to watch is 200 Call Resistance . This is currently the largest Call Resistance on the board, and it also aligns with an 8/8 MM level , adding technical confluence to the zone. 🟢
🔶 Options sentiment context
What’s important here is sentiment:
🔵 Call Pricing Skew is currently minimal, meaning the options market is not aggressively positioned for upside yet. This keeps the move cleaner and reduces the risk of an overcrowded bullish trade. In other words, this is not a euphoric call-heavy environment, which often allows price to travel further if momentum builds.
🔶 Scenario
🟢 If NVDA successfully breaks out of this consolidation and holds above the 50-day MA , a move toward the 200 Call Resistance becomes a very realistic upside target.
🔶 Key levels
🔴 PUT Support: 170
🔵 Trigger: Sustained breakout above the 50-day MA
🟢 Upside Target: 200 Call Resistance (8/8 MM)
Not financial advice — just a clean structure driven by price, positioning, and option market context.

Options Greeks + AI: The New Era of Derivatives Trading
Options Already Feel Like 4D Chess - AI Just Adds More Dimensions
For many traders, options feel intimidating because there isn't just "price" — there are Greeks, volatility, time decay, and complex payoffs.
AI doesn't magically simplify options. What it does is help you see and manage all those moving parts at once.
---
Quick Greek Refresher (The Calm Version)
Delta (Δ) – How much the option price moves when the underlying moves
Gamma (Γ) – How fast Delta itself changes
Theta (Θ) – How much you pay or collect per day in time decay
Vega (ν) – How much the option responds to changes in implied volatility
Think of it like this:
Delta: Direction
Gamma: Acceleration
Theta: Rent for time
Vega: Sensitivity to fear/volatility
---
Where AI Actually Helps With Options
Instead of guessing, AI‑driven tools can:
Monitor your total portfolio Greeks in real‑time (net Delta, net Vega, etc.)
Run what‑if scenarios : "What happens to my P&L if we gap 3% overnight? If IV drops 10 points?"
Search across chains to find structures that fit your risk profile
You still choose the playbook. AI just gives you a clearer picture of the board.
---
Example: Using AI for Volatility, Not Just Direction
Most traders focus on "Will price go up or down?".
Options traders (and their models) often focus on:
"Will price move more or less than the market expects?" (Realized vs implied volatility)
AI can:
Compare current implied volatility to realized volatility over multiple windows
Flag when options look historically expensive or cheap
Suggest whether you should be long or short volatility for your idea
Direction is still a bet - but at least now, your bet on volatility is informed.
---

Positive GEX Profile Points Toward 700 Gap FillMETA – Holding Above HVL, 50 DMA Reclaim in Progress, Upside Call Resistance at 700
META is currently trading below the 200-day moving average , but recent price action suggests a potential structural improvement rather than continued weakness.
From an options perspective, the broader structure remains Positive GEX , indicating that dealer positioning is still supportive on pullbacks. At the same time, IV remains low , which typically favors range expansion and directional follow-through once key technical levels are reclaimed.
On the daily chart, price is now starting to reclaim the 50-day moving average , a level that previously acted as dynamic resistance. Importantly, META is also holding above the High Volatility Level (HVL) , which keeps the short-term regime constructive rather than defensive.
Volatility conditions remain favorable:
Call Pricing Skew is elevated (~31.6%), showing persistent call demand
IV remains controlled, allowing price to move without immediate volatility compression pressure
Looking forward, the most important upside call resistance is the 700 level, which represents:
Highest core call resistance on the Feb 20 (Optimal Monthly) expiration
A major gap fill from the prior breakdown
A clear technical resistance zone visible on the daily chart
This confluence makes 700 a logical upside target if price can hold above HVL and fully reclaim the 50 DMA.
Key structure to watch:
200 DMA – higher timeframe resistance overhead
50 DMA – short-term trend reclaim in progress
HVL – holding above keeps structure constructive
700 – primary upside target (gap fill + core call resistance)
As long as price holds above HVL with supportive GEX structure, rotational upside toward 700 remains the higher-probability path .

(FIIs-DIIs) Nifty levels & range for tomorrow 31-12-2025(FIIs-DIIs) Nifty levels & range for tomorrow 31-12-2025
use levels in 5 minutes time frame for intraday trading

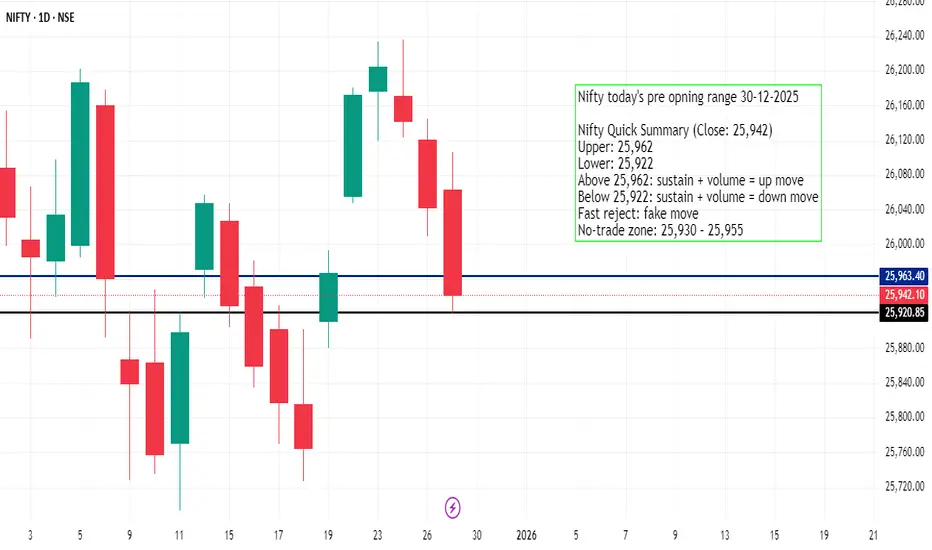
today's nifty analysis 30-12-2012Nifty Quick Summary (Close: 25,942)
Upper: 25,962
Lower: 25,922
Above 25,962: sustain + volume = up move
Below 25,922: sustain + volume = down move
Fast reject: fake move
No-trade zone: 25,930 – 25,955
Buying CCLI’ve looked at the company’s numbers, and I can see that this ticker has momentum for at least the next 53 days. This is why I’m buying cash secured calls, nothing fancy, strike at $31, expiry on March 20th, 2026. I’ve had quite a few successful trades, especially in the last quarter of 2025, so I’m hoping this starts the year off right.
There’s nothing major behind the fundamentals, but I noticed that cash is flowing into the Consumer Discretionary sector, which makes sense with Q4 buyers. Still, this company is trading very cheaply compared to what it makes versus peers and the broader market. I try not to marry my bias, just seeing a lot of rational business being done in 2026 as well.
I will probably have 2 to 5 more trades added with similar expiries. Happy New Year!

DIXON | Weekly Bearish Options Setup | Jan ExpiryTrade Idea
• Sell 12,500 CE
• Buy 13,000 CE
• Defined-risk bear call spread
Why this setup works
DIXON NSE:DIXON has broken below the mid-band and is trading under key short-term moving averages. The recent bounce attempt near the upper band was sold into, confirming supply at higher levels.
Momentum is weak, RSI is slipping below the mid-zone, and price is now making lower highs on the weekly chart. As long as DIXON stays below the 12,600–12,700 resistance zone, upside looks capped.
With steady IV, call spreads offer a clean risk-defined way to express this view.
View
Moderately bearish — expecting DIXON to stay below resistance and drift sideways to lower levels.
This post is for education only. It’s not financial advice or a recommendation to trade.
#WeeklyOptions
#BearishSetup
#DIXON
#OptionsTradingIndia
#BearCallSpread
#ThetaDecay
#NSEOptions

Ticker - $BULLWe have a triple inversed bottom with yoru inverse head and shoulders coming out of a head and shoudlers. I have my decision zone marked where I expect it to break here soon 8.77 with my first and second price targets mixed. I am personally in 2028 ITM leaps

Disney's Possible Swing SetupHi Traders!
As I analyze Disney, I am seeing it's in a counter trend on the 24HR with a resistance at $120. I'm staying patient watching to see how far price will retrace with a 24HR CHOCH sitting at around $102.50. That seems far away, but that would help fill in some of the gap, and give a nice set up for a reversal. In addition, there are 4 days left in the current Monthly candle, and they've been closing small. IMO that could indicate that price could eventually make it to $130.
For now, I have alerts set and I'm planning to take a long swing.
Let me know what you guys think in the comments! Good luck!
*DISCLAIMER: I am not a financial advisor. The ideas and trades I take on my page are for educational and entertainment purposes only. I'm just showing you guys how I trade. Remember, trading of any kind involves risk. Your investments are solely your responsibility and not mine.*

Why Bitcoin Feels Stuck And What Options Have To Do With ItWhat are options? 🧾
- An option is a contract on Bitcoin.
-Calls = right to buy BTC later at a fixed price.
-Puts = right to sell BTC later at a fixed price.
Big traders and market‑makers hedge these contracts by buying or selling real BTC and futures. When there is a lot of options at a few key prices, their hedging can hold BTC in a tight range.
Why BTC feels stuck around 85k–93k 🧲
For December there is a lot of open interest around:
~85k (many puts).
~100k (many calls).
Because of this:
- When BTC moves up, dealers often sell to hedge → upside gets capped.
- When BTC moves down, they often buy → downside gets supported.
Result: price just chops sideways in a band, instead of trending strongly.
What changes after 26 December? 🎄➡️📈📉
On 26 December, a huge batch of Bitcoin options expires (tens of billions in notional value). When they expire:
- Those hedges are no longer needed.
- The “invisible wall” around 85k–100k weakens.
BTC is freer to move.
What that usually means:
Before 26 Dec: sideways range is likely to continue.
After 26 Dec: we can expect bigger, faster moves, either:
Up, if fresh spot buying / ETF inflows stay strong and macro is calm.
Or down, if sentiment turns risk‑off and new buyers don’t step in.

HDFC Bank Option Chart Near Major Support AreaHDFC Bank – 1 Hour Timeframe Analysis OPTION 980 CE Chart .
This is the 1-hour timeframe chart of HDFC Bank. The stock is currently moving within a descending parallel channel, with a key support zone near ₹12–13.
A bullish candle formation is visible at this support level.
If the price sustains above this zone, a potential reversal can be expected, with the stock likely to move towards higher resistance levels from here.
Thank you.

GOOGL GEX & Bullish Decision Point at 320February 20 Expiration – GEX & Options Structure
Looking at the February 20 expiration, the options and GEX structure suggests that price is currently sitting at a critical decision zone .
Put side
The chart shows a clear put support level around 310 .
Price has briefly traded through this level, but there has been no strong downside continuation .
This keeps the scenario alive that 310 can still act as put support into this expiration.
Call side / Decision point
The next core resistance is located around 320 .
This level represents a bullish decision zone .
A clean break and acceptance above 320 could quickly shift dealer positioning.
Such a move would open the door for a potential gamma squeeze to the upside.
Technical context
Since summer, this is already the third similar bull flag structure on the daily chart.
The previous two structures resolved to the upside.
The current pattern has not yet confirmed a breakout.
This makes the 320 level especially important for technical confirmation.
Upside scenario
If price accepts above 320 , the next logical magnet becomes the next core resistance.
Based on daily structure and call wall positioning, this sits around 350 .
Volatility & Skew
Core pricing skew is currently around +25% , favoring calls.
Implied volatility has been compressing for several sessions .
This supports the idea that a directional expansion could follow once price resolves this range.
Summary
310 = key put support
320 = bullish decision point
Acceptance above 320 increases the probability of gamma-driven upside toward higher call resistance levels
