The #1 Trading Strategy: The Butter Knife Trading SystemI told you once in while
i will be posting about forex trading.
This strategy is a bit advanced and am sorry
for introducing this to you so early in your trading
journey but its okay
to be open minded the key is i want you
to learn how to trade to the point
You can have multiple strategies.
The truth is you only
need one powerful strategy
to make it in this game.But my calling
is different
Because i want to tech you and build
you, and help you and share with you
So i have to make sure that i kept learning
new strategies to entertain you
with trading knowledge
The truth is A.I. is boring
if all you do is talk to A.I. the whole day
you wont have anything interesting
to share with people.
Am old school buddy.I use old school methods
Now are these new school methods such as
A.I. powerful yes...
But nothing beats the old tricks man.
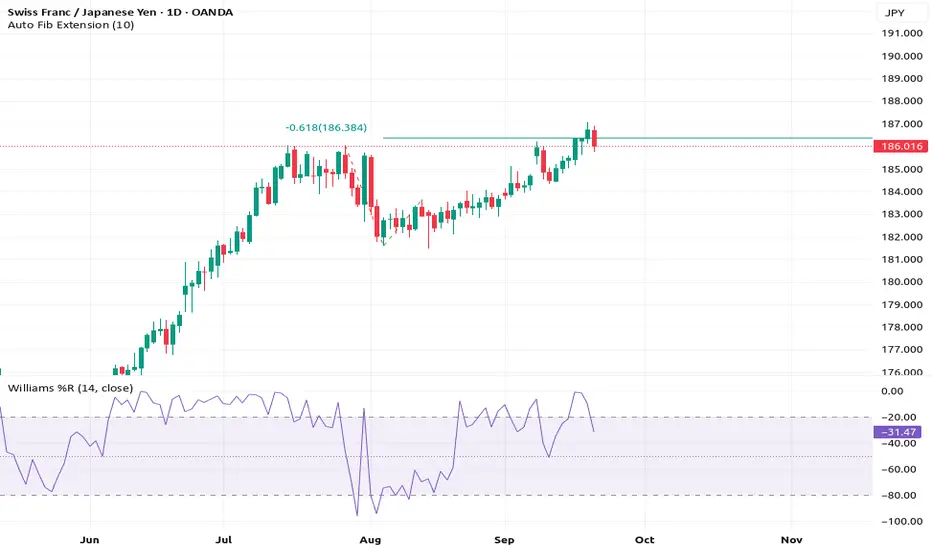
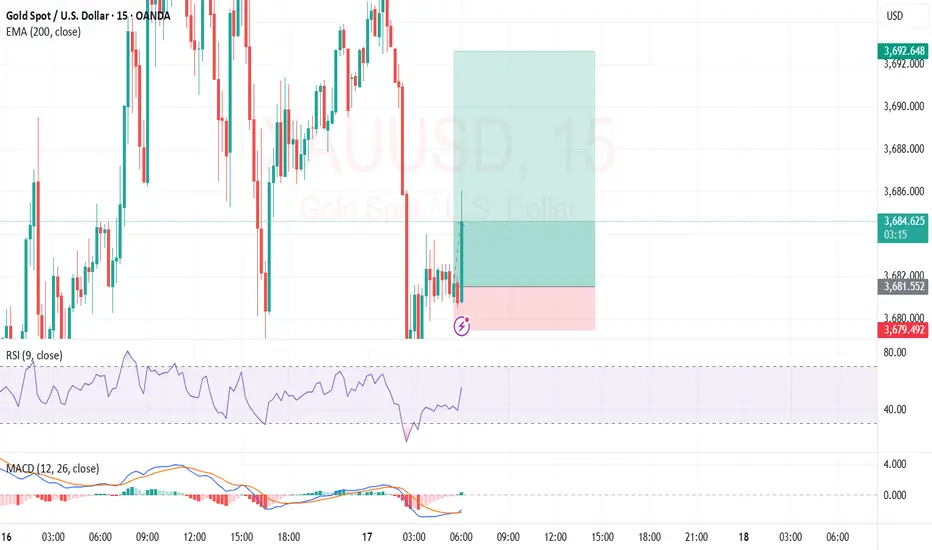
So now look at the Fibonacci.
I call this the Butter Knife Trading system.
Because when that Fibonacci level
cuts through the price.
oh boy..Its going to crash!
If you dont believe this forex will
crash look at the
momentum on the William %r
Its hit the Oversold zone.
This is a short selling strategy
my friend.
If you want to learn more rocket boost this content
Disclaimer:Trading is risky
please learn risk management and profit
taking strategies
also feel free to use a simulation trading account before
you trade with real money.
Oscillators
The #1 Trading Mindset Shown On This ChartMan this is crazy there is this girl
that am digging.It was crazy i just
spoke my mind
bro she kept laughing..i honestly
dont think am very funny.
But she kept laughing
at my talk.
She insisted i see her tomorrow again.
Now am doubting if am ready to be
in a relationship with her.
Anyway we will see how this goes.
I will update on the story. Tomorrow,
after i see her tomorrow.
Meanwhile there is this other girl that
i really love but she doesn't see me man.
Its like i don't have a body
Bro she ignores me like
no mans business
i cant even get her attention.
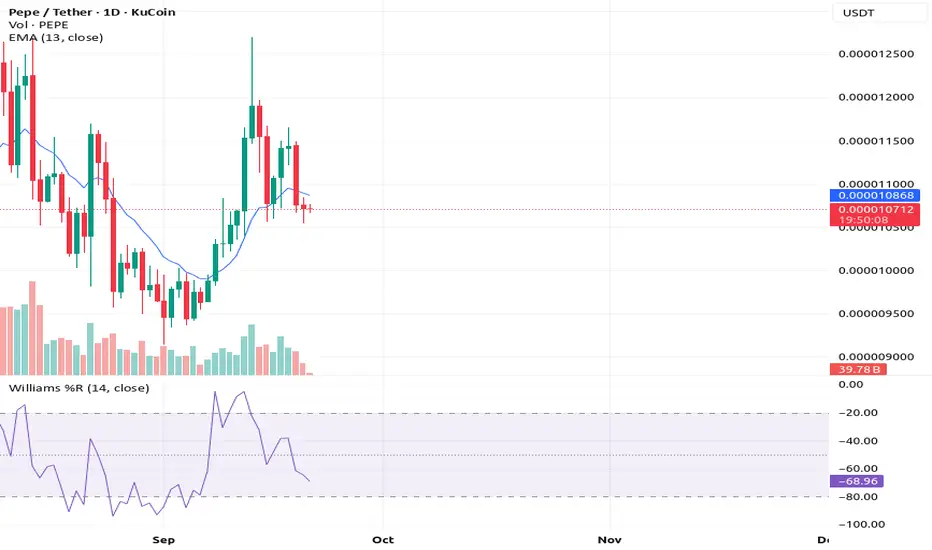
Look at this chart KUCOIN:PEPEUSDT
what you see is a doji .
Thats fear my friend.
This is when you have to enter
During fear.
The price action looks like a double
bottom meanwhile
on the momentum chart below
you can see a new low..
Have you seen the new low
on the william %R ?
This is very important for you
to understand because
this is called the new high new low
chart pattern .
Its pure trading psychology at
its best and am sharing it with you.
Rocket boost this content to learn more.
Disclaimer: Trading is risky please risk management
and profit taking strategies.Also feel free
to use a simulation trading account before you
trade with real money.
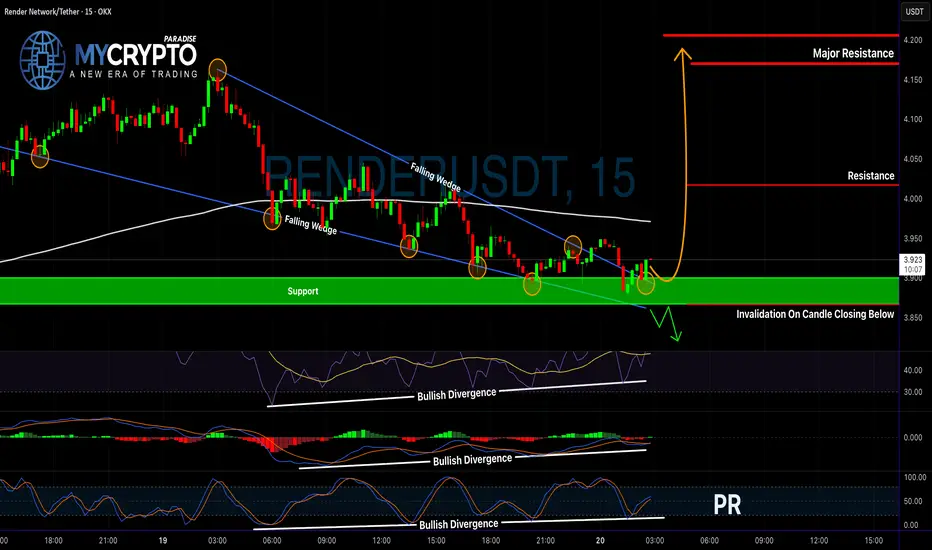
Is RENDER About to Explode?Yello Paradisers, are you watching closely? RENDERUSDT just completed a textbook breakout—and it might be your best shot at catching a high-probability move before the crowd even notices.
💎RENDERUSDT has officially broken out of a falling wedge—a powerful bullish pattern—confirmed by bullish divergence on the RSI, MACD, and Stochastic RSI. When all three indicators align like this, the probability of a strong upside move significantly increases.
💎Even better, price action has already retested the wedge breakout, and from the current levels, the market is offering a favorable risk-to-reward (RR) setup.
💎Now, if you’re looking for additional confirmation, a more cautious play would be to wait for a pullback into the nearest support zone, and then enter on a bullish candlestick formation. This approach could not only boost your confidence but also improve your overall RR.
💎However, stay sharp—if price breaks and closes below the support and our invalidation level, the entire setup gets invalidated. In that case, patience is key. Wait for stronger price action before considering re-entry.
🎖Strive for consistency, not quick profits. Treat the market as a businessman, not as a gambler. Be patient, stay focused, and let the market come to you, Paradisers. That’s how the winners play this game long-term.
MyCryptoParadise
iFeel the success🌴
BTC 4H Analysis - Key Triggers Ahead | Day 43😃 Hey , how's it going ? Come over here — Winter got something for you!
⏰ We’re analyzing BTC on the 4-Hour timeframe.
👀 On the 4H timeframe of Bitcoin, we see that after the recent interest rate cut news, price started moving down. It seems that the potential upside from the news was already priced in by traders. Right now, BTC is trading in a range between resistance at $117,573 and support at $114,828. A breakout of either side could send the price toward the next support or resistance. For now, the market will likely move into a range condition, where the win rate of most setups drops, so it’s better to trade with lower risk.
🧮 Looking at the RSI oscillator, it is near a support zone below the 50 level. The two key levels to watch are 40 and 70. If RSI breaks above or below these zones, Bitcoin could start a new move.
🕯 Currently, the size, volume, and number of red candles are increasing. As BTC approaches support, some buy orders have been triggered. The key question is whether this support zone is strong enough to hold the price until the new week begins. Since the ATH, every correction has faced strong selling pressure from major sellers (maker sellers).
🧠 At this stage, Bitcoin itself may not provide the best setups for positions. However, altcoins that are showing bullish divergence or relative strength against BTC could present better opportunities. We can track these coins on platforms like TradingView or CoinMarketCap, identify their triggers, and look for long entries if the setups are valid.
❤️ Disclaimer : This analysis is purely based on my personal opinion and I only trade if the stated triggers are activated .

The Power Of Risk Management - "i want 100% profit!!"Am angry let me tell you the reason.
I was up about 50% profit on this trade...
guess what? i didnt take profit...
I feel so stupid and helpless
because am following my risk management
to the T..meaning i have to cross
my t when writing.
Dont fear volatility.
The entry was at a higher low .
Now it has dropped to a new low .
What makes this the perfect re-entry?
its because people, buyers and sellers, are fearful.
The buyers and sellers are fearful right now.
Imagine 3 days of profit Poof!!! gone!!
And here you are holding the bag on this trade.
Meanwhile the short term investors have taken
their share of profit
Am sticking to risk managment buddy.
i want 100% profit!!
Look at this chart KUCOIN:PEPEUSDT
you will see two things:
1-The bullish harami
2-The doji
The bullish harami shows you reversal entry.
The doji shows you fear.
Dont let fear stop you.
Also look at the william %R have you seen the New low?
Rocket boost this content to learn more.
Disclaimer: Trading is risky.Please learn risk management
and profit taking strategies.
Also feel free to use a simulation trading account
Before you trade with real money.
Full Disclosure: I am a marketing expert

$PUMP Battle Between Buyers and SellersWill be an interesting next couple of days to watch for NYSE:PUMP
Appeared to be forming a bull pennant but that failed and lost the 9EMA.
Now is the battle between buyers and sellers at previous ATH.
Must hold this level otherwise it will print 3 Black Crowes and retest ~.006

The 13 EMA System On Re- Entry (Swing Trading)So am sitting on my computer desk.
Trying to register my publishing business..
then it hit me man.
Its more affordable to start a business
than to get a driving license.
So which one would you do?
Would you start a business or get a driving
license?
Starting a business is something
i wish i did in my younger days.
Those days i had so much imagination
and no guidance on how to monetise
my ideas.
Starting this publishing business
is something am so proud of myself by.
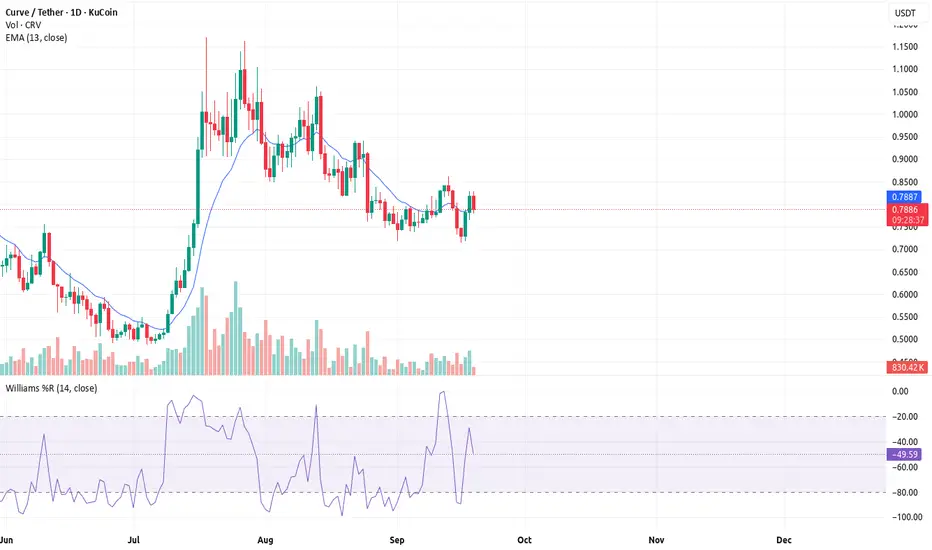
Now look at this chart KUCOIN:CRVUSDT
you will see something called a failure swing.
What is a failure swing?
This is the break even point or the re entry signal.
Dont get sacred of this
its a sign that the next bullish move in KUCOIN:CRVUSDT
is going to be huge!!
Am using the William %R to see this swing
because its my favourite indicator..
Which indicator do you use to see the failure swing?
Do you think this is where the name
swing trading comes from?
If you remember on the last idea
i told you i saw a dragonfly doji as an entry
This failure swing signal is the icing on the cake.
Trade safe.
Rocket boost this content to learn more
Disclaimer:Trading is risky please learn risk managment
and profit taking strategies.Also feel free to use
a simulation trading account before you trade with real money.
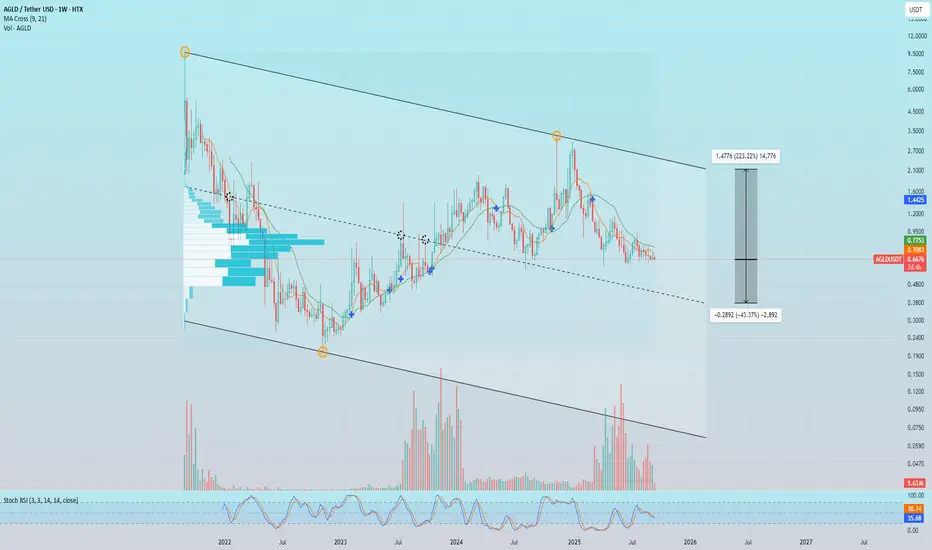
AGLD. The Next Chapter.global chart structure is neutral with high amplitude in both directions, there is some empirical priority down simply because eco is in the development stage and it looks like they are building L3 for GameFi
the core value was established in '21 as NFT project
Bitcoin Cornered as Bulls and Bears Battle for ControlWe’re approaching what may be a key moment for bitcoin’s medium-term directional risks, with the price sandwiched between horizontal resistance at $117,600 on the topside and the 50-day moving average and September uptrend on the downside. Whichever way it breaks—if that happens—may provide clues as to whether we’ll see another retest of the record high of $124,500.
From a momentum perspective, upside is favoured: RSI (14) continues to set higher highs above 50, while MACD has staged a bullish crossover of the signal line and is now pushing into positive territory. It’s not a slam-dunk case for bulls, but it’s a better backdrop than for bears.
Should we see a break above Thursday’s high and preferably a close, longs could be established above $117,600 with a stop beneath for protection. Minor resistance is located at $119,000, putting that on the radar as an initial target. If that level is cleared, eyes will then turn to a potential retest of the August highs.
Of note, bitcoin has performed particularly well in the December quarter recently, coinciding with the Fed’s dovish pivot in 2023 and Fed rate cuts and Donald Trump’s re-election in 2024. That doesn’t guarantee a similar outcome this time, but with the Fed signalling further rate cuts this year, it probably doesn’t hurt the bullish case either.
Should bitcoin break beneath the 50DMA/September uptrend, it could sow the seeds for a bearish setup, where shorts could be established beneath with a stop above, targeting $113,500 initially.
Good luck!
DS

GBPUSD LONGPrice is sitting at a strong demand area
RSI is above 40 line suggesting potential strong area
Trade SAFE

Follow the stories from chart-Be still enough 2hear them b4 moveHello everyone!
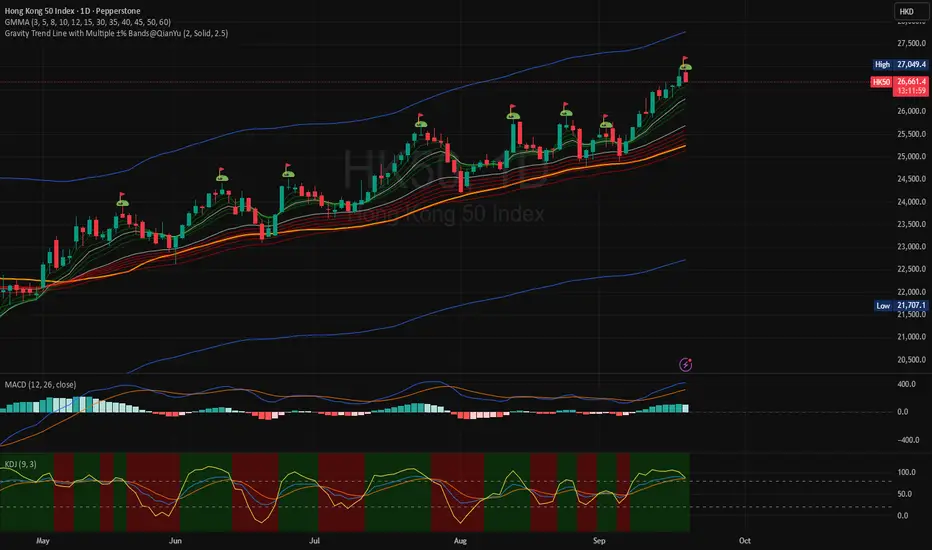
From previous update, HSI uptrend mode continue on track.
At point of writing ✍️:
The HSI hit and break 4-year peak 27058 (the next target to break 5-year peak at 31,181 at 2021; do you think is possible?)
PEPPERSTONE:HK50 This morning hit 27049
What's your take with the recent fed rate cut and the news?
** Following the overnight U.S. Federal Reserve's 25-basis-point interest rate cut, China's central bank left a key rate unchanged on Thursday, as authorities appear in no rush to ease monetary settings.
** Hong Kong's central bank lowered its base rate charged via the overnight discount window by 25 bps to 4.50%, tracking the Fed move.
** The benchmark Hang Seng index
HSI surpassed the 27,000 mark for the first time since July 2021, before edging down 0.18% by midday.
www.tradingview.com
Trade as usual. Manage your risk/reward. Be patient.
For 4H - it seems gonna to take a pause; to retrace back before to charge up again to next Hi.
🗝️ 26730, 26450
If so that's the golden zone to take a bold slightly aggressive position ride the trend to break 27320 (then 27660)
MACD Signal above zero level
KDJ is above 80 and curving down a retracement is inevitable.
currently on D Chart PEPPERSTONE:HK50
🗝️ Resistance Level : 27050
Support Level : 26585
Support level 26300 (EMA30)
If break below, huge retracement from current level to 25300.
🗝️ Strong Support Level : 25250 (from 24767 @28Aug25, Gravity TrendLine support lifting circa 484pts).
Uptrend is intact.
Notice the trend, after the ⛳ , it always retrace back to GravityTrend Line area,
GMMA squeezing again (around 4,5 Sep 25 from the previous squeeze 27,28Aug25) before it spreading out again to rise again.
Well it's quite predictable the movement of the Index like 🌊 it's completing its cycle for the next wave to form; it maybe a ripple and it maybe a huge wave.
This could apply on shorter timeframe for your position on swing or intraday trade.
It's not a rocket science just a little patient and contemplation is suffice.
Following your own tradeplan/SOP.
Take your position, setting stop loss and ride on the trend (up/down).
At point of writing ✍️
Be aware that Index is about to being attracted towards to D GravityTrendLine likely tomorrow and next week.
However, the uptrend is very much intact and steady (W chart - see above) - the rippling 🌊 last longer, this seems mirroring how the Index hovering above 10% GravityTrend Line back in 2017, guess the party🕺💃is still on.
🗝️ Next Resistance Level : 25300
🗝️ Next Support Level : 24970
🗝️ Strong Support Level : 24920 (EMA30)
When in doubt, sit. Not every candle needs a response.
— Sometimes, the wise action is non-action, you always have options with wise discernment.
The 13 EMA System Rocket Booster StrategyHave you ever been labelled as a loser?
Thats what happened to me last night.
I was talking to an old buddy of mine.
He told me off.
He said:
"Lubosi you are old, grow up
and leave your parents home."
"Lubosi find a job and get married"
I replied telling him
that i have options.
In this case am talking
about crypto options trading.
Now am not in this trade.But i want to
share it with you because i appreciate
you following me.I think
i saw one of my followers
with a tag from
"the real world" i am humbled
to know that my reach goes
even to you.
You see am not the "cool" guy
but one thing about me man is that
i bust my behind to get isshh done.
Am like the video director
for the real world - That guy is cool
sadly he gets bullied. Once in a while
but they love him, because
he produces good results.
The market doesn't care about
your race, past, or present
All it cares about is what you are
going to give it today.
If you give the market high value.
You will get
high value in return
Thats why am so humbled
to be part of
this community.
My goal is to take you with me on
my journey.
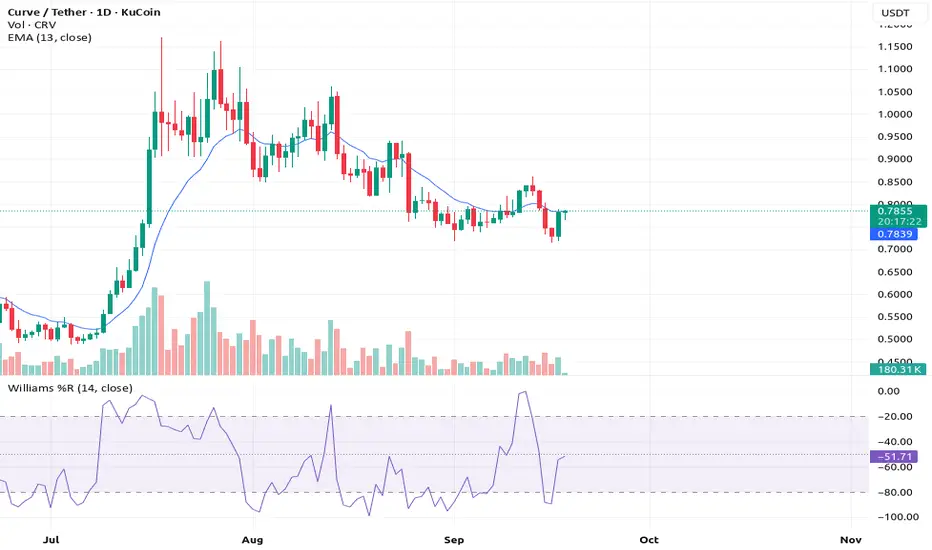
Now look at this crypto KUCOIN:CRVUSDT
its below the William %R -50
that's your entry No negotiation.
You should exit at above the -20
that's your profit taking target and risk
management no negotiation
man do it.
This is called the 13 EMA System
Rocket Booster Strategy
Rocket boost this content to learn more.
Thank you for reading.
P.S.
The entry pattern you are seeing is called the
Dragon Fly Doji
Its got a long wick at
the bottom.
I learnt this from candlestick patterns
book by Steve Nison
Thanks for reading again
remember to rocket boost the content.
So that you learn more
Disclaimer: Trading is risky please learn risk management
and profit taking strategies.Also
feel free to use a simulation trading account
before you trade with real money .
Silver: Will It Hold or Fold?An obvious bearish reversal pattern has tilted near-term directional risks for silver lower, but unless we see a clean break of uptrend support, traders should keep an open mind on whether to play the metal from the long or short side. The uptrend is located around $41.30 today.
If the price were to breach and hold beneath the level, shorts could be established with a stop
above for protection, targeting the intersection of horizontal and uptrend support at $39.53.
If the price bounces again from the uptrend, the setup could be flipped, with longs established above it with a stop beneath for protection, targeting Tuesday’s high of $42.97.
Momentum indicators provide a message of waning bullish pressure, with RSI (14) setting lower lows, while MACD looks set to cross the signal line from above. The signal suggests more emphasis should be placed on price action when assessing potential setups.
Good luck!
DS

NVDA: A Stoic Approach to a Losing Trade (The Second Breath)As we just discussed, a loss is not a failure; it's information.
This trade on NVDA is a perfect, real-time application of that Stoic and Douglas-inspired philosophy. The first attempt was stopped out for a small "paper cut" loss. The Stoics teach us to focus only on what we can control. We couldn't control the price hitting our first stop, but we can absolutely control our reaction.
Our reaction is not one of frustration, but of calm acceptance. We take the information the market gave us, remain balanced, and execute the next step of our plan.
The New Trade Plan
This second attempt is an action taken with more wisdom and an even better potential reward.
Style: Long / Re-Entry
Entry: Limit Order at $167.75
Stop Loss: A tight, strategically placed stop at $162.25 (3.28% risk)
Target: $192.50
Risk/Reward Ratio: Approximately 1 : 4.5
The #limitlessTrader's Mindset
The first trade was simply an exhale. This second trade is the next breath, taken with more clarity and from a place of balance. This is the process.
Just shine.
Disclaimer: This is not financial advice. It is for educational and informational purposes only. Please conduct your own research and manage your risk accordingly.

DOGE Breakout or Bull Trap? Read Before You Enter!Yello Paradisers! Could this be the breakout that finally sends DOGE flying, or is it just another trap designed to lure in early bulls before dumping hard? If you’re thinking about entering here, you’ll want to read this entire breakdown — because the price action is sending mixed signals, and it’s critical to stay sharp right now.
💎DOGEUSDT has just broken out of a classic falling wedge pattern — a historically bullish setup that often marks the end of a corrective phase. What strengthens this move even more is the presence of a hidden bullish divergence on the RSI and a bullish divergence on the MACD, both suggesting that momentum is building to the upside. In addition, we’ve now seen a bullish CHoCH (Change of Character) right after a liquidity grab, which further increases the probability that this could be the start of a new impulsive move upward.
💎That said, the current risk-reward ratio from this level is sitting at around 1:1, which is not ideal for a high-conviction trade — especially if you're managing capital with a long-term mindset. For that reason, the more strategic move here would be to wait for a pullback and watch for a strong bullish candlestick confirmation on the lower timeframes. This would offer a better entry with improved risk-reward, giving you more confidence and cleaner structure to trade off.
💎Still, if you're an aggressive trader, taking a small position now with that same 1:1 RR could make sense — but only if your risk is clearly defined and well managed. Chasing a breakout without a confirmed entry trigger or without patience could cost you, especially in a choppy market like this one.
💎However, if DOGE breaks back down and closes below the invalidation level, then the entire bullish setup is invalidated. In that case, it’s best to step aside, wait for cleaner structure, and only re-enter once we see stronger bullish confirmation or a new range develop.
🎖We are playing it safe right now. If you want to be consistently profitable, you need to be extremely patient and always wait only for the best, highest probability trading opportunities.
MyCryptoParadise
iFeel the success🌴

RSI up from 17% on M15 + MACD Cross + EngulfingRSI up from 17% on M15 + MACD Cross + recent Engulfing, TP at edge of FVG above.
Woke up to this perfect setup. RSI coming up from an earlier low of 17% on M15, the MACD had just crossed over bullish, and earlier a bullish engulf had printed. Price has stayed above the EMA200 line on M15 and higher TFs are also bullish. TP placed at the edge of FVG above and got a great R:R.
Very happy with this. 1:5 here we come.
Warning!! The Number #1 Breakout Is HereStarting a business is the hardest thing
i have ever done in my life.
Of course capitalism is also hard.
Business is a team support and i would not
have known the secrets without
the OG's helping me out.
Shout out to my pops and my uncle
for giving me the opportunity to express my
publishing business ideas.
Hopefully i will get my business name
and start working as a entrepreneur in
the sales agency and marketing industry
Am hoping this happens before the end of the year.
I really never
thought of myself as an entrepreneur
but hey life has its ways of teaching
all of us.
Am sure by now you
have gotten the news
that i will no longer talk about
stocks trading..maybe once in a while
i will speak on Forex trading...
for now am sticking
to crypto trading only.
This is because i want to focus on
my trading and become a better
article writer and educator
when it comes to sharing my
ideas with you.
Trade safe out there
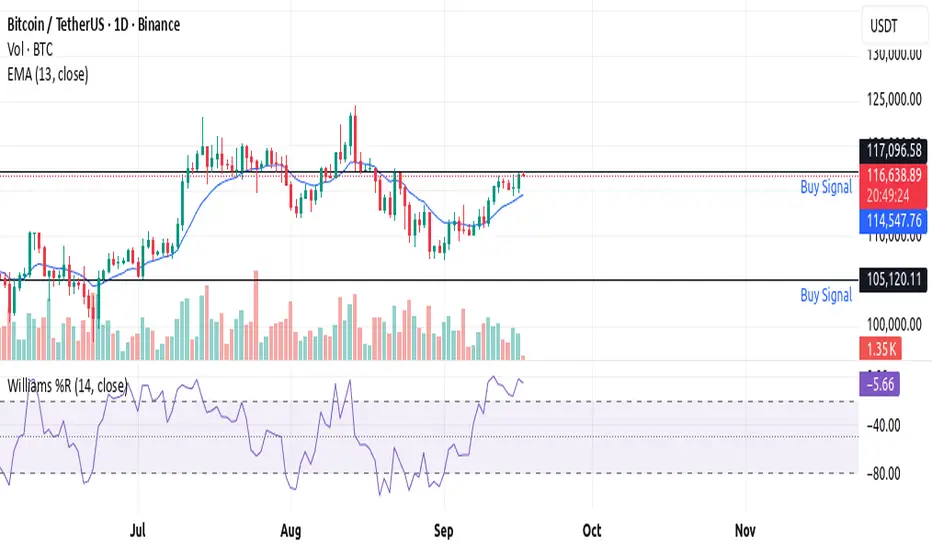
Bitcoin is going to blow within
the next week
Please prepare for this
explosive market
move because the fed interest rate
decision is this week!!
This is going to be
one of the crazy weeks of your
trading career..Now look at
the price of Bitcoin BINANCE:BTCUSD
Do you think its over bought?
If so how come it keeps going up?
How did you know its overbought?
What indicator is showing you this?
Rocket boost this content to learn more.
Disclaimer:Trading is risky please learn risk
management and profit taking strategies.
Also feel free to use a simulation trading
account before you trade with real money
EUR/JPY: Triangle Tension Nears BoilBanging up against resistance within an ascending triangle, traders should be on alert for a possible bullish breakout in EUR/JPY.
A clean break above 173.90 could see longs established with a stop beneath for protection, looking for either 174.50 or the July 2024 swing high of 175.42, depending on desired risk-reward from the setup.
Slight negative divergence with RSI (14) is a minor concern, although the message is still one that favours upside over downside, especially with MACD trending further into positive territory having already crossed the signal line from below.
While longs are favoured, if the pair can’t clear 173.90, the setup could be flipped with shorts established beneath the level with a stop above for protection. Possible targets include uptrend support/50DMA along with minor support levels at 172.13 or 171.00.
Good luck!
DS

ETF MON100 BullishETF MON100 represents Nasdaq100, price is near 52week high, looks promising if it breaks this level.
Can consider for short term and long term based on fundamentals and if price breaks 52week high position.
Short term 🟢 position

ETF VAL30IETF LongBreaking the resistance level, Expect a short term long position based on RSI levels going strong on daily and weekly time frame. Also trading above 200 moving average.
🟢 Long

ETF MODEFENCE LongExpect a short term long position based on RSI levels going strong on daily and weekly time frame. Also trading above 200 moving average.
🟢 position.

ELLIOTT WAVE EURUSD Daily update
EW Trade Set Up daily
minute ((i)) seems finished
H4 scenario 210725:
the price upward movement from 1.1557 area on 17/07/25 has broken decisively 1.1684-1.1705 area but it had not the
strenght to go further so that the lagging span (green line) could break upward the leading span B (red line).
A decrescent high has been registered at 1.1800 area on 24/07/25.
In this new scenario it looks like that the impulsive movement that started from 1.0180 on 13/01/25
finisced at 1.1834 on 010725 in the minute wave (i). (EWO divergence, break down of the upward (ii)/(iv) channel).
So i have to register that a correction to minute wave ((ii) has started
key levels VP area
1.1800
1.1370 POC
1.0850
note :
monitor the price reaction at any supports level: VP area and LVN

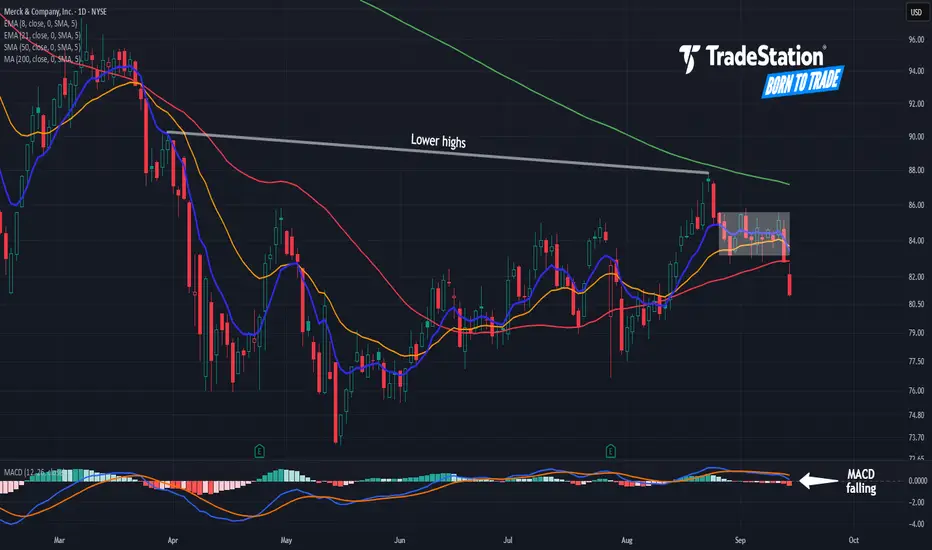
More Downside in Merck?Merck has been sliding for more than a year. Now, following a period of consolidation, some traders may see further downside risk.
The first pattern on today’s chart is the range between the August 26 high of $85.59 and the August 28 close of $83.21, where the pharmaceutical giant spent almost three weeks. It closed under support on Friday and continued lower yesterday. That may suggest that support has been broken.
Second, the 8-day exponential moving average (EMA) crossed below the 21-day EMA. MACD is also falling. Those signals could suggest the short-term trend has grown bearish.
Next, August saw a lower high relative to late March (which also featured lower peaks than previous months). That may confirm a longer-term downtrend is in effect.
Finally, MRK is back under its 50-day simple moving average.
TradeStation has, for decades, advanced the trading industry, providing access to stocks, options and futures. If you're born to trade, we could be for you. See our Overview for more.
Past performance, whether actual or indicated by historical tests of strategies, is no guarantee of future performance or success. There is a possibility that you may sustain a loss equal to or greater than your entire investment regardless of which asset class you trade (equities, options or futures); therefore, you should not invest or risk money that you cannot afford to lose. Online trading is not suitable for all investors. View the document titled Characteristics and Risks of Standardized Options at www.TradeStation.com . Before trading any asset class, customers must read the relevant risk disclosure statements on www.TradeStation.com . System access and trade placement and execution may be delayed or fail due to market volatility and volume, quote delays, system and software errors, Internet traffic, outages and other factors.
Securities and futures trading is offered to self-directed customers by TradeStation Securities, Inc., a broker-dealer registered with the Securities and Exchange Commission and a futures commission merchant licensed with the Commodity Futures Trading Commission). TradeStation Securities is a member of the Financial Industry Regulatory Authority, the National Futures Association, and a number of exchanges.
TradeStation Securities, Inc. and TradeStation Technologies, Inc. are each wholly owned subsidiaries of TradeStation Group, Inc., both operating, and providing products and services, under the TradeStation brand and trademark. When applying for, or purchasing, accounts, subscriptions, products and services, it is important that you know which company you will be dealing with. Visit www.TradeStation.com for further important information explaining what this means.