AALTechnical Analysis:
-Accumulation with clear presence of institutional volume.
-Noticeable buying pressure in a bullish divergence on the MACD indicator.
Fundamental Analysis:
American Airlines has secured its long-term capacity growth and fleet modernization with a massive order for 440 aircraft. The order is strategically diversified among the main manufacturers: 85 Airbus A321neo, 85 Boeing 737 MAX 10, and 90 Embraer E175. Spreading the order across Airbus, Boeing, and Embraer is a key risk-mitigation tactic.
For summer 2026, AAL has announced new routes that strengthen its global network. This includes new services from Dallas/Fort Worth (DFW) to Zurich (ZRH) and Milan (MXP), and from Philadelphia (PHL) to Budapest (BUD) and Prague (PRG). Additionally, new services to Tokyo Haneda (HND) from both DFW and Los Angeles (LAX) have been scheduled.
This expansion underscores AAL’s strategy of leaning into high-yield markets where it has shown particular strength, such as Mexico, the Caribbean, and Central and South America.
On the labor front, all disputes have already been resolved, and the Trump administration waived $16.7 million in fines related to wheelchair-handling issues.
BMO has initiated coverage of the U.S. airline sector with a constructive outlook for 2026, arguing that the industry is finally emerging from a challenging 2024-2025 period marked by domestic overcapacity and weak corporate travel demand.
Oscillators

How to Make 18% in a Week: RSS3 Reversal Trading Across 4 MarketHow to Make 18% in a Week: RSS3 Reversal Trading Across 4 Markets
On November 27, Bitcoin was trading at $91,400. Classic overbought indicators were flashing red, but timing the entry was the million-dollar question. When exactly to short? And more importantly—when to exit?
Four days later, price crashed to $83,800 (-8.3%). Then two days after that, it rallied to $93,600 (+10.1% from the bottom). Full cycle result: +18.4% in one week . Both entries and both exits were marked by a single indicator.
This article demonstrates real trades across four different markets—crypto, US stocks, forex, and index futures—with exact dates, prices, and percentages. All examples from November 2025, all data-verified.
🔗 Free indicator: RSS3 - Reversal Score System v3
═════════════════════════════════════════════════════════════
THE DIVERGENCE PROBLEM
You've likely experienced this:
• RSI shows divergence, you enter—price moves against you another 5%
• MACD signals "perfect" setup—you hit stop-loss two hours later
• Counter-trend divergence works 1 out of 5 times
Three critical issues:
1. All divergences look identical —but one leads to 10% reversal, another to 1%
2. No trend filter —divergences against strong momentum often fail
3. Subjectivity —which pivot to use? What lookback period?
RSS3 (Reversal Score System v3) solves these by adding numerical strength scoring from -1 to +1 and multi-timeframe filtering .
═════════════════════════════════════════════════════════════
HOW RSS3 WORKS—SIMPLIFIED
No formulas. Three key concepts:
1. Final Score shows reversal strength:
• Score < -0.5 → bullish zone (potential upside)
• Score > +0.5 → bearish zone (potential downside)
• Closer to ±1.0 = stronger signal
2. Automatic divergences marked with triangles:
• Green below price = bullish
• Red above price = bearish
• Lime/Maroon = double confirmation (both VPI+TDFI)
3. MTF filter protects against counter-trend entries:
• Gray triangles = filtered signals
• "Reduce" mode—weakens counter-trend divergences
• "Block" mode—hides them completely
Now let's see it in action.
═════════════════════════════════════════════════════════════
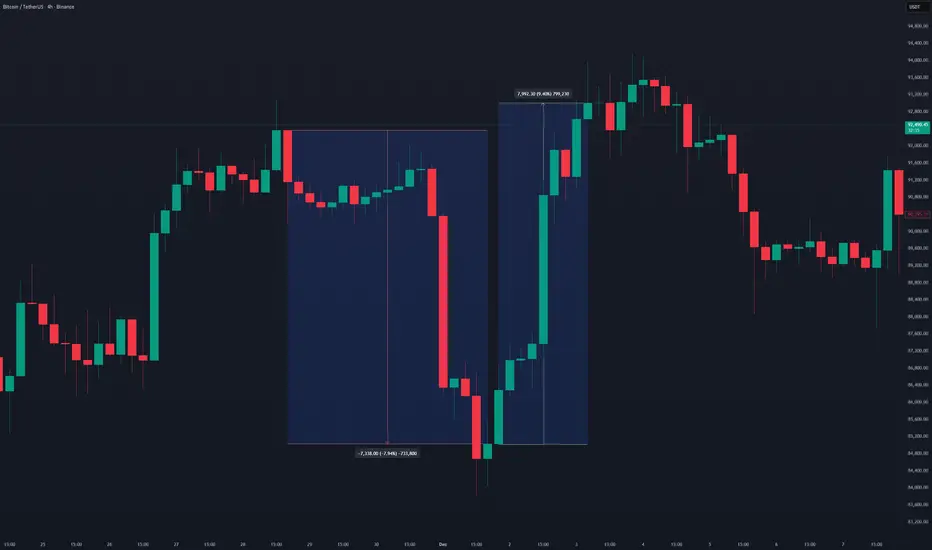
CASE 1: CRYPTO SWING—BITCOIN FULL CYCLE
Asset: BTC/USDT (Binance)
Timeframe: 2 hours
Period: November 27 - December 3, 2025
Double Bearish Divergence—Short Entry
November 27 brought two bearish divergences within 10 hours on BTC:
Divergence 1: Nov 27, 09:00
Price: $91,408
Score: 0.537 (above 0.5 threshold = extreme)
Entry: $91,372 (+2 bars delay)
Divergence 2: Nov 27, 19:00
Price: $91,479
Score: 0.188
Entry: $91,417
Double divergence = amplified signal. Both pointed to bearish reversal. Price dropped to $83,823 by December 1.
Short Result: 8.26-8.31% profit (~8.3% average) in 4.5 days
─────────────────────────────────────────────────────────────
Extreme Bullish Signal—Long Entry
December 1, 17:00—at the same $83,823 low, a bullish divergence appeared with Score -0.885 :
Signal: Dec 1, 17:00
Price: $84,678
Score: -0.885 (near theoretical minimum -1.0!)
This is an exceptionally strong bullish signal —Score in the bottom 5% of all values for the period. After entry at $85,025, price rallied to bearish divergence on Dec 3:
Entry: $85,025 (Dec 1, 21:00)
Exit: $93,643 (Dec 3, 07:00, bearish divergence)
Score: 0.592 (bearish zone)
Profit: 10.14%
─────────────────────────────────────────────────────────────
BTC Statistics:
Period: Nov 27 - Dec 3 (7 days)
Price range: $83,823 - $93,959
Score range: -1.000 to +0.647
Total divergences: 6 (1 bullish, 5 bearish)
Short: ~8.3%
Long: +10.1%
════════════════
TOTAL: ~18.4% 🚀
Key insight: Score -0.885 on bullish divergence was the lowest value for the entire analysis period, confirming reversal strength.
═════════════════════════════════════════════════════════════
CASE 2: TECH STOCKS—NVIDIA EXTREME SCORE ENTRY
Asset: NVDA (NASDAQ)
Timeframe: 15 minutes
Period: November 20-21, 2025
Score-Based Entry WITHOUT Divergence
Unlike traditional setups, this trade demonstrates entering on extreme Score alone —no divergence required.
Nov 20, 17:30—Score hits 1.000 (theoretical maximum bearish pressure):
Entry signal: Score = 1.000
Entry price: $194.23
Date: Nov 20, 17:30
This showcases RSS3's dual functionality: divergence-based reversals AND pure momentum exhaustion signals.
─────────────────────────────────────────────────────────────
Two Exit Strategies
Option A: Divergence Signal (Conservative)
Exit: Bullish divergence same day
Time: Nov 20, 22:00 (4.5 hours later)
Price: $181.73
Score: -0.177
Profit: 6.44%
Option B: Opposite Extreme Score (Aggressive)
Exit: Strong bullish Score next day
Time: Nov 21, 18:30 (25 hours later)
Price: $175.14
Score: -0.873 (strong bullish signal)
Profit: 9.83%
Maximum potential: $169.56 reached on Nov 25 (12.70%)
─────────────────────────────────────────────────────────────
Key Takeaway:
Entry on Score = 1.000 demonstrates that RSS3 works as both:
1. Divergence detector (traditional)
2. Overbought/oversold extremes indicator (alternative)
No need to wait for pivot confirmation when Score hits absolute limits.
═════════════════════════════════════════════════════════════
CASE 3: FOREX PRECISION—GBP/USD SWING
Asset: GBP/USD
Timeframe: 30 minutes
Period: November 17-19, 2025
Classic Divergence Setup
Nov 17, 15:00—Bearish divergence with solid Score:
Signal: Nov 17, 15:00
Price: 1.31870
Score: 0.663 (strong bearish zone)
Entry: 1.31845 (+2 bars, 16:00)
Nov 19, 22:30—Bullish divergence signals exit:
Exit: 1.30458
Score: -0.900 (extreme bullish signal, near -1.0!)
Profit: 1.05%
Pips: 139
Duration: 54.5 hours (~2.3 days)
─────────────────────────────────────────────────────────────
Forex-Specific Advantages:
1️⃣ Conservative but Consistent
- 1% in 2 days = ~180% annualized (if repeatable)
- Low risk, steady returns
2️⃣ Perfect Entry/Exit Symmetry
- Entry Score: +0.663 (bearish extreme)
- Exit Score: -0.900 (bullish extreme)
- Mirror-image reversal pattern
3️⃣ Double Divergence Confirmation
- Entry: Bearish divergence
- Exit: Bullish divergence
- No guesswork
4️⃣ Ideal Timeframe for Part-Time Trading
- 30M filters noise but stays responsive
- Suitable for traders with day jobs
Exit Score of -0.900 was near the period's minimum, providing high-confidence reversal confirmation.
═════════════════════════════════════════════════════════════
CASE 4: INDEX FUTURES—E-MINI S&P 500 WITH LEVERAGE
Asset: E-mini S&P 500 (ES)
Timeframe: 4 hours
Period: November 20-26, 2025
Institutional-Grade Swing Trade
Nov 20, 22:00—Bullish divergence on higher timeframe:
Signal: Nov 20, 22:00
Price: 6552.00 points
Score: -0.761 (strong bullish)
Entry: 6577.00 (+2 bars / 8 hours, Nov 21 06:00)
Nov 26, 18:00—Bearish divergence signals exit:
Exit: 6833.00 points
Score: 0.385 (bearish zone)
Points: 256.00
Profit: 3.89%
Duration: 132 hours (~5.5 days)
─────────────────────────────────────────────────────────────
Leverage Advantage:
E-mini S&P 500 contract specifications:
• Multiplier: $50 per point
• Typical margin: ~$14,000 per contract
• Contract value: ~$328,850
Profit Calculation:
Spot profit: 3.89%
Points gained: 256.00
Per contract: 256 × $50 = $12,800
ROI on margin: $12,800 / $14,000 = 91.4%!
With 2 contracts: $25,600
With 5 contracts: $64,000
⚠️ Risk Note: Leverage amplifies both gains AND losses. Always use proper position sizing and risk management!
─────────────────────────────────────────────────────────────
4H Timeframe Benefits:
1️⃣ Institutional-Quality Signals
- Filters intraday noise
- Perfect for swing traders and fund managers
2️⃣ Work-Life Balance
- Only 6 bars per day
- Can be monitored part-time
3️⃣ Capital Efficiency
- 3.89% spot → 91.4% ROI on margin
- Professional-grade risk/reward
4️⃣ Tax Advantages
- 60/40 tax treatment in US
- Lower spreads vs cash index
═════════════════════════════════════════════════════════════
COMPARATIVE ANALYSIS
All four trades shared common patterns while demonstrating versatility:
1. Double Divergences Increase Reliability
BTC showed two bearish divergences within 10 hours—both delivered.
2. Extreme Scores Predict Strong Moves
• BTC Score -0.885 → +10.1% rally
• NVDA Score 1.000 → 6-10% drop
• GBP Score -0.900 → reversal confirmation
3. Reversal Divergences = Perfect Pivot Points
All exits occurred at opposite divergences, capturing full swings.
4. Works Across All Market Types
From 15M daytrading (NVDA) to 4H swing (ES), signals remained consistent.
─────────────────────────────────────────────────────────────
Performance Summary:
Asset Market TF Strategy Profit Duration Special
BTC/USDT Crypto 2H Double Div ~18.4% 7d Full cycle
NVDA Stocks 15M Score 1.0 6.4-9.8% 4-25h No div entry
GBP/USD Forex 30M Divergence 1.05% 2.3d Conservative
E-mini S&P 500 Futures 4H Divergence 3.89% 5.5d 91% ROI leverage
Win Rate: 100% (5 out of 5 trades)
═════════════════════════════════════════════════════════════
PRACTICAL TRADING GUIDE
Basic Reversal Strategy:
Entry:
1. Wait for divergence (green/red triangle on chart)
2. Check Score: |Score| > 0.5 strengthens signal
3. Score near ±1.0 = extreme reversal zone
4. Enter +2 bars after divergence (accounts for pivot delay)
Exit:
• Conservative: opposite divergence
• Aggressive: Score crosses opposite threshold (±0.5)
• Stop-loss: ATR × 2-3 from entry
─────────────────────────────────────────────────────────────
Settings for Different Styles:
Scalping/Intraday (5-15M):
Pivot Lookback: 2 (aggressive)
Cloud Mode: Gradient
MTF: off or 1H
Swing Trading (1H-4H):
Pivot Lookback: 3 (balanced)
Cloud Mode: Threshold
MTF: on, 4H-D, Reduce mode
Position Trading (Daily):
Pivot Lookback: 5 (conservative)
MTF: on, Weekly, Block mode
─────────────────────────────────────────────────────────────
When NOT to Trade Divergences:
• Tight range: Score oscillates within ±0.2
• Low volatility: clouds don't form or are very weak
• Against strong trend without MTF: gray triangles = filtered signals
─────────────────────────────────────────────────────────────
Combining with Other Tools:
RSS3 is a confirmation tool , not a standalone system:
• Use support/resistance levels for targets
• Confirm with volume (OBV, CVD) for reversal strength
• Consider fundamentals during news events
• Apply risk management: max 2-3% capital per trade
═════════════════════════════════════════════════════════════
CONCLUSIONS
Analysis of four different assets during November 2025 demonstrated RSS3's effectiveness across markets and timeframes:
✅ High Returns: 18.4% on BTC in one week via full cycle
✅ Consistency: 100% win rate across all four trades
✅ Versatility: 15M to 4H timeframes, all asset classes
✅ Leverage Efficiency: 91.4% ROI on E-mini futures margin
Key advantages over classic divergences:
1. Quantitative strength scoring: Score -1 to +1 vs binary yes/no
2. Automation: no manual pivot hunting
3. MTF context: filters counter-trend signals
4. Adaptive clouds: visualizes pressure accumulation zones
Alternative entry methods demonstrated:
• Traditional: divergence-based (BTC, GBP, ES)
• Modern: pure Score extremes (NVDA)
• Both work with appropriate risk management
The indicator is free and can serve as either a complementary filter to your existing system or the foundation for a complete reversal trading strategy.
🔗 Download RSS3: Get it on TradingView
═════════════════════════════════════════════════════════════
DISCLAIMER
This article is provided for informational and educational purposes only and does not constitute financial, investment, or trading advice. All trading involves risk, and past performance does not guarantee future results. Users are solely responsible for their own trading decisions and should conduct independent research or consult with a qualified financial advisor before making any investment decisions. The author assumes no liability for any losses incurred through the use of this information.
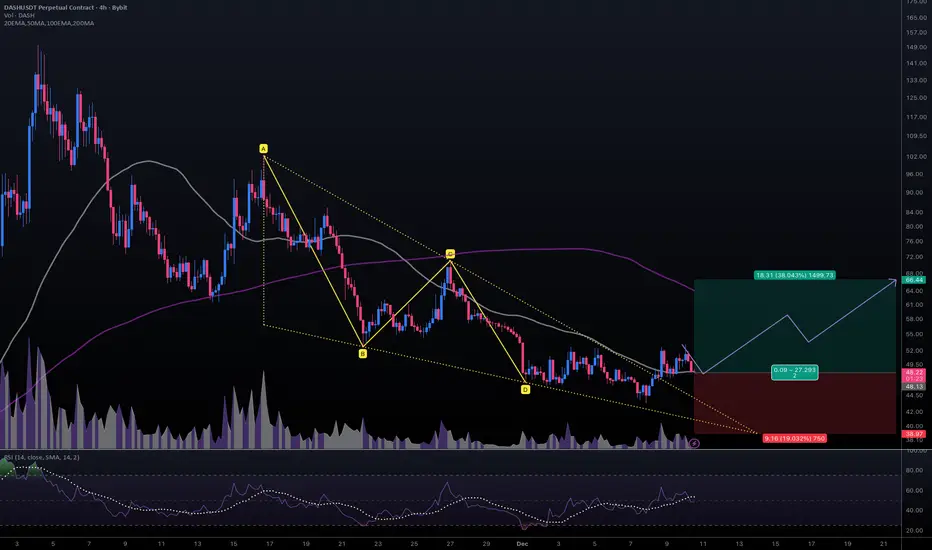
#DASHUSDT #4h (ByBit) Falling wedge breakout and retest [LONG]Digital Cash is pulling back to 50MA regained support where it seem likely to bounce towards 200MA resistance.
⚡️⚡️ #DASH/USDT ⚡️⚡️
Exchanges: ByBit USDT
Signal Type: Regular (Long)
Leverage: Isolated (2.0X)
Amount: 5.3%
Current Price:
48.22
Entry Targets:
1) 48.13
Take-Profit Targets:
1) 66.44
Stop Targets:
1) 38.97
Published By: @Zblaba
CRYPTOCAP:DASH BYBIT:DASHUSDT.P #4h #DigitalCash #Privacy dash.org
Risk/Reward= 1:2.0
Expected Profit= +76.1%
Possible Loss= -38.1%
Estimated Duration= 1-2 weeks
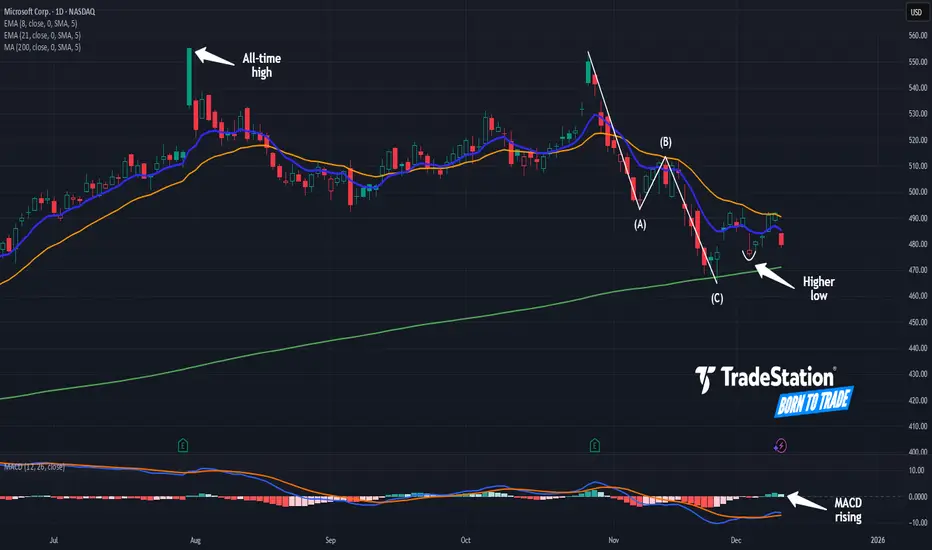
Microsoft May Be TurningMicrosoft struggled in November, but some traders may think it’s turning this month.
Consider the slide after MSFT jumped in late October. MACD was falling throughout the period, giving bulls little opportunity for a rally despite strong quarterly results.
However, a few things seem to the changing.
First, MACD has turned higher. That may suggest that short-term momentum has grown more bullish.
Second, the software giant tested and held its 200-day simple moving average. That may confirm its longer-term uptrend remains intact.
Third, prices made a higher low this month compared with late November.
Next, the pullback may be viewed as a finished A-B-C corrective wave. Completion of that pattern could mark an end to the selling pressure.
Finally, MSFT is an active underlier in the options market. (Its average daily volume of 328,000 contracts ranks 11th in the S&P 500, according to TradeStation data.) That may help traders take positions with calls and puts.
TradeStation has, for decades, advanced the trading industry, providing access to stocks, options and futures. If you're born to trade, we could be for you. See our Overview for more.
Past performance, whether actual or indicated by historical tests of strategies, is no guarantee of future performance or success. There is a possibility that you may sustain a loss equal to or greater than your entire investment regardless of which asset class you trade (equities, options or futures); therefore, you should not invest or risk money that you cannot afford to lose. Online trading is not suitable for all investors. View the document titled Characteristics and Risks of Standardized Options at www.TradeStation.com . Before trading any asset class, customers must read the relevant risk disclosure statements on www.TradeStation.com . System access and trade placement and execution may be delayed or fail due to market volatility and volume, quote delays, system and software errors, Internet traffic, outages and other factors.
Securities and futures trading is offered to self-directed customers by TradeStation Securities, Inc., a broker-dealer registered with the Securities and Exchange Commission and a futures commission merchant licensed with the Commodity Futures Trading Commission). TradeStation Securities is a member of the Financial Industry Regulatory Authority, the National Futures Association, and a number of exchanges.
Options trading is not suitable for all investors. Your TradeStation Securities’ account application to trade options will be considered and approved or disapproved based on all relevant factors, including your trading experience. See www.TradeStation.com . Visit www.TradeStation.com for full details on the costs and fees associated with options.
Margin trading involves risks, and it is important that you fully understand those risks before trading on margin. The Margin Disclosure Statement outlines many of those risks, including that you can lose more funds than you deposit in your margin account; your brokerage firm can force the sale of securities in your account; your brokerage firm can sell your securities without contacting you; and you are not entitled to an extension of time on a margin call. Review the Margin Disclosure Statement at www.TradeStation.com .
TradeStation Securities, Inc. and TradeStation Technologies, Inc. are each wholly owned subsidiaries of TradeStation Group, Inc., both operating, and providing products and services, under the TradeStation brand and trademark. When applying for, or purchasing, accounts, subscriptions, products and services, it is important that you know which company you will be dealing with. Visit www.TradeStation.com for further important information explaining what this means.
CCL Industries (CCL.B) — Swing Trade💰 CCL.B — Swing Trade Breakdown (TSX)
CCL Industries (CCL.B) is pulling back into a major support zone with extreme oversold conditions — a classic RSI2 mean-reversion setup. The long-term trend remains intact, fundamentals are steady, and the current retracement is happening on controlled volume, not panic selling.
🏢 Snapshot
Global leader in labeling/packaging. Defensive industrial with consistent cash flow. Pullback into support while the broader industrials sector rotates back into low-vol compounders.
📊 Fundamentals (Quick Read)
• P/E ~18× — fair for a defensive industrial
• P/B ~2.9× — slight premium, justified by stable ROE
• ROE ~12% — solid vs. peers
• Debt/Equity ~0.5 — moderate and well-managed
• Dividend ~1.4% — growth-oriented profile
• Strong free cash flow (~$650M) + ~$550M cash on hand
Overall: clean balance sheet, consistent profitability, and cash flow strong enough to support acquisitions + defensive stability.
📈 Trend & Catalysts
• Revenues steady; EPS trending mildly higher
• Cash flow improving YTD
• Input costs easing → margin stabilization
• Defensive rotation favors industrials
• Seasonally stronger Q4–Q1 demand
• Watch FX (USD/CAD) + global industrial slowdown as risks
📐 Technicals
• Price: $81.62
• 50-SMA: $82.01 (price sitting right on it)
• 200-SMA: $80.39 (long-term trend still bullish)
• RSI(2): extreme oversold (~8–11)
• Structure: pullback into support, no breakdown yet
• Volume: normal → slightly elevated; controlled sell-off
Support: $81.00 → $81.30, then $80.00 (200-SMA)
Resistance: $84.00 + $84.88 swing high
🎯 Trade Plan
Entry Zone: $81.00 – $81.80 (bounce off 50-SMA & oversold RSI2)
Stop: $80.00 (below 200-SMA + structure)
Target: $84.00 – $84.90 (breakdown level + swing high)
Risk/Reward: ~2.0–2.3×
Alternate Entry: Reclaim + retest of $84.00 if current bounce fails.
🧠 My Take
This is a high-probability TSX mean-reversion setup: oversold RSI2, price resting on stacked 50-SMA/200-SMA support, and a clear R/R path back to the mid-$84s. Fundamentals remain solid, and nothing in the structure suggests real breakdown — just rotation and short-term pressure. I like the bounce long as long as $80 holds.

Benchmark Yield Teeters as Politics Loom LargeFutures tied to the world’s benchmark interest rate sit at a pivotal level, reflecting a market clouded by extraordinary uncertainty. Political risk, legal challenges, and shifting global policy expectations are colliding with technical signals to create a backdrop where directional conviction is scarce. With the Federal Reserve’s decision looming and structural questions about U.S. fiscal and trade policy unresolved, the next move in U.S. 10-year Treasury futures could prove highly consequential.
While the latest unwind is partially being driven by a global repricing of medium-term interest rate expectations as several central banks signal the next move in policy rates is likely to be higher, the steepening of the curve may also reflect concern about the FOMC being compromised politically next year through the potential appointment of close Trump ally Kevin Hassett as chair, along with the future of current governor Lisa Cook. She was dismissed by Donald Trump earlier this year only to see her reappointed by a court order. A final ruling from the U.S. Supreme Court is expected early in the new year.
If rates at the front of the curve are cut for political rather than economic reasons, you’d expect to see curves react to the prospect of stronger nominal growth expectations. Throw in uncertainty as to whether Trump’s reciprocal tariffs will be ruled legal in a separate court case—an outcome that could significantly widen the U.S. primary deficit and open the door to litigation proceedings against the government—and it makes the price action in this contract so interesting as we move towards 2026.
Rejected comprehensively at the influential 50DMA last week, U.S. 10-year Treasury note futures have spent the period since sliding lower, leaving the contract teetering at 114’20’0 less than 24 hours out from the Federal Reserve’s December FOMC meeting, where it’s widely expected to deliver a third consecutive 25-basis point rate cut, taking the funds rate to a range of between 3.5–3.75%.
114’20’0 has acted as support and resistance for lengthy periods in 2025, underlining its importance when it comes to medium-term directional risks. With RSI (14) pushing lower below 50, it favours downside over upside, especially with MACD confirming the bearish signal.
Should we see an extension of the unwind through 114’20’0, it would put a retest of the 200DMA on the radar and, beyond that, the intersection of 113’16’0 support and the uptrend running from the lows set in January.
If the bearish move stalls at 114’20’0, the 50DMA may be targeted by bulls looking for a retracement, although price action beneath 115’00’0 should be monitored given there were buyers lurking beneath it for periods in November.
Beyond technicals, I’m not entirely convinced we’ll see an overly hawkish cut from the Fed on Wednesday—something that may temporarily relieve downside pressure on the price. Unless a significant proportion of FOMC members no longer deem a funds rate of 3% as neutral for economic activity, it still lends itself to the median member signalling one cut in both 2026 and 2027, even though there has been an extra one added to the 2025 profile relative to the prior dot plot forecasts released three months ago.
If that does eventuate and we don’t see a significant minority of members dissent in favour of keeping rates steady at this meeting, it would not surprise to see a bid across the curve as traders price in the prospect of more than two cuts over that period, as was the case earlier this month.
Good luck!
DS

NZDUSD to find buyers at market price?NZDUSD - 24h expiry
There is no clear indication that the upward move is coming to an end.
Although we remain bullish overall, a correction is possible with plenty of room to move lower without impacting the trend higher.
Risk/Reward would be poor to call a buy from current levels.
A move through 0.5800 will confirm the bullish momentum.
The measured move target is 0.5875.
We look to Buy at 0.5775 (stop at 0.5740)
Our profit targets will be 0.5850 and 0.5875
Resistance: 0.5800 / 0.5825 / 0.5850
Support: 0.5775 / 0.5750 / 0.5725
Risk Disclaimer
The trade ideas beyond this page are for informational purposes only and do not constitute investment advice or a solicitation to trade. This information is provided by Signal Centre, a third-party unaffiliated with OANDA, and is intended for general circulation only. OANDA does not guarantee the accuracy of this information and assumes no responsibilities for the information provided by the third party. The information does not take into account the specific investment objectives, financial situation, or particular needs of any particular person. You should take into account your specific investment objectives, financial situation, and particular needs before making a commitment to trade, including seeking, under a separate engagement, as you deem fit.
You accept that you assume all risks in independently viewing the contents and selecting a chosen strategy.
Where the research is distributed in Singapore to a person who is not an Accredited Investor, Expert Investor or an Institutional Investor, Oanda Asia Pacific Pte Ltd (“OAP“) accepts legal responsibility for the contents of the report to such persons only to the extent required by law. Singapore customers should contact OAP at 6579 8289 for matters arising from, or in connection with, the information/research distributed.

XIC LongTrend Respect Continues - Pullback Entry Executed
Just entered XIC on a clean structural pullback into the 1-hour MA cluster. The broader trend remains intact, with rising 20MA and 50MA on the 1h and solid support from the Daily 50MA well below. Recent price action shows momentum cooling without breaking structure, which fits the system’s ideal reset conditions.
Why I entered:
Trend confirmed:
1h 20MA > 50MA, both rising. Price continues to hold above the 1h200 and is respecting the staircase of higher lows.
Daily structure is supportive with the 1D 50MA still trending upward beneath price.
Pullback behaved correctly:
Price retraced cleanly into the 20/50 buy window, CCI reset, and now recrossed back into positive momentum.
RSI held midline structure, no breakdown.
Structure-led risk placement:
Initial stop placed at the purple level beneath the most recent swing lows.
As trend progresses, the plan is to move the stop up toward the Daily 50MA (standard system approach for slow-moving ETFs).
XIC is typically a steady mover, not explosive, but it respects structure extremely well. The goal here is slow compounding and disciplined trailing rather than chasing momentum.

The Top 3 Strategies To Find Stocks To Buyi feel so happy because i am about
to start my online business journey
and finally get to live on my own outside
the guidance of my parents,relatives
and friends.
This means i am about to find financial independence.
At the same time i have mastered how
to trade stocks, forex, and crypto.
I remember talking about how frustrated i am
with my life, that i was ready to get a job at
the fast food restaurant
But i have not given up on my
business man dreams.
Trading is just like a business
its not enough to learn the technical
you need to study business strategy
By W.Chan and Renee the book
is called blue ocean strategy
Inside this book i learnt the
art of elimination in
business strategy,
This is what helped me find a
strategy for trading
that is both powerful
and follows risk management.
Based on my stock trading system
i used the following to find
these stocks:
-The 50 EMA
-The 200 EMA
-Chart patterns such as - Ascending Triangle
50 EMA > Chart pattern < 200 EMA
I placed the chart pattern
between the two EMA's
and then i found the best one
based on risk
management i used the Stochastic+RSI
making sure the price is below the 50 RSI.
This gives me a place to stop buying.
I make sure both the %k and %d are
below the 50 line.
Trade safe and never ever give up
on your trading journey
keep learning and growing.
Rocket boost this content to learn more.
Disclaimer: Trading is risky please use a simulation trading account
and learn risk management and profit taking
strategies before you trade with real money.

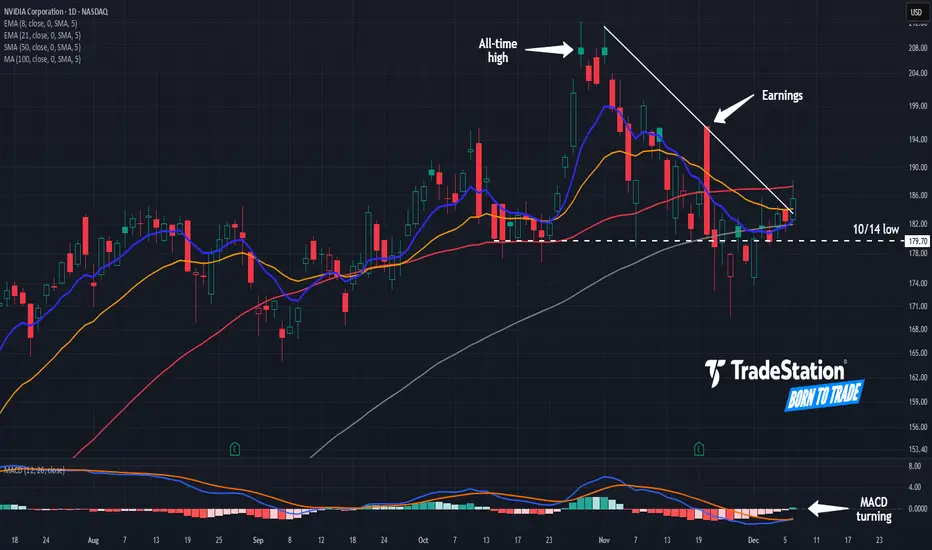
Is Nvidia’s Next Up Leg Coming?Nvidia has paused after a rally, and some traders may think the next up leg is coming.
The first pattern on today’s chart is the series of lower highs since November 3. The AI chip giant closed above that falling trendline yesterday, which could mean that the short-term resistance is fading.
Second is the failed rally on November 20 after earnings and revenue beat estimates. MACD was falling at the time, which prevented the shares from holding their gains. But now the oscillator has turned up, which may suggest that momentum has grown more favorable.
Third, prices have consolidated around their 50- and 100-day simple moving averages. That could reflect a bullish long-term trend.
Next, the 8-day exponential moving average (EMA) is rising toward the 21-day EMA. Crossing above may signal bullishness in the short term.
Finally, NVDA is a highly active underlier in the options market. (Its average daily volume of 3.6 million contracts ranks first in the S&P 500, according to TradeStation data.) That may help traders take positions with calls and puts.
TradeStation has, for decades, advanced the trading industry, providing access to stocks, options and futures. If you're born to trade, we could be for you. See our Overview for more.
Past performance, whether actual or indicated by historical tests of strategies, is no guarantee of future performance or success. There is a possibility that you may sustain a loss equal to or greater than your entire investment regardless of which asset class you trade (equities, options or futures); therefore, you should not invest or risk money that you cannot afford to lose. Online trading is not suitable for all investors. View the document titled Characteristics and Risks of Standardized Options at www.TradeStation.com . Before trading any asset class, customers must read the relevant risk disclosure statements on www.TradeStation.com . System access and trade placement and execution may be delayed or fail due to market volatility and volume, quote delays, system and software errors, Internet traffic, outages and other factors.
Securities and futures trading is offered to self-directed customers by TradeStation Securities, Inc., a broker-dealer registered with the Securities and Exchange Commission and a futures commission merchant licensed with the Commodity Futures Trading Commission). TradeStation Securities is a member of the Financial Industry Regulatory Authority, the National Futures Association, and a number of exchanges.
Options trading is not suitable for all investors. Your TradeStation Securities’ account application to trade options will be considered and approved or disapproved based on all relevant factors, including your trading experience. See www.TradeStation.com . Visit www.TradeStation.com for full details on the costs and fees associated with options.
Margin trading involves risks, and it is important that you fully understand those risks before trading on margin. The Margin Disclosure Statement outlines many of those risks, including that you can lose more funds than you deposit in your margin account; your brokerage firm can force the sale of securities in your account; your brokerage firm can sell your securities without contacting you; and you are not entitled to an extension of time on a margin call. Review the Margin Disclosure Statement at www.TradeStation.com .
TradeStation Securities, Inc. and TradeStation Technologies, Inc. are each wholly owned subsidiaries of TradeStation Group, Inc., both operating, and providing products and services, under the TradeStation brand and trademark. When applying for, or purchasing, accounts, subscriptions, products and services, it is important that you know which company you will be dealing with. Visit www.TradeStation.com for further important information explaining what this means.
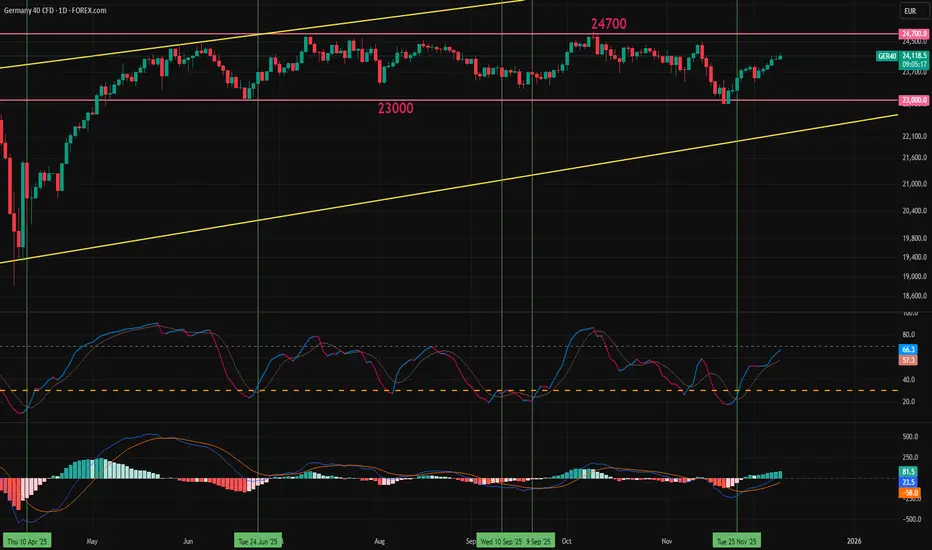
DAX Stuck in Sideways Grind, Year-End-Boost or Continued RangingThe DAX index has been moving sideways since May without any signs of a trend change. Weak German economic data, a struggling auto industry, ongoing Ukraine risks, and de-globalization moves from the US all limit the upside potential. However, with the new year approaching, incoming portfolio adjustments could provide a conservative boost to the index.
From the year start to the March top, the DAX rose more than 18% in a three-month period. After a big selloff and sharp recovery due to the April tariff announcement from Trump, returns from the start of the year reached over 23% by May. During this five-month period, the DAX positively diverged from the S&P 500, reaching above two standard deviations from the five-year average. Since then, the S&P 500 has continued to clinch gains while the DAX has been moving sideways in a 1,700-point-wide channel.
Germany's deep slump is expected to end in 2026, increasing GDP growth from 0.3% to 1% (market consensus). German CPI is expected to stay close to the 2% target like the rest of the EU, and lower ECB rates might give a conservative boost to investments. The changes are positive but not a significant boost for the DAX.
Now that the DAX/S&P 500 ratio has returned to its average, the correlation between the US stock market and the DAX might increase again. Currently, the relative momentum index (RMI) has generated a buy signal, similar to the MACD. Crossovers below “30” on the RMI and below “0” on the MACD usually provide decent bullish signals. However, the main focus will remain on the 24,700 resistance. Unless it is broken to the upside, the sideways move can be expected to continue.
Higher PMI, factory orders, and industrial production data have already shown a positive impact on the index, and post-COVID seasonality for December is historically bullish in December. The question is whether that will be enough to trigger a breakout.
PABC, Falling wedge breakout with bullish divergencePABC, 1D
Falling wedge breakout with bullish divergence
TP: 140, 158
SL: 118 closing below
Arsalan Anwer
Stags

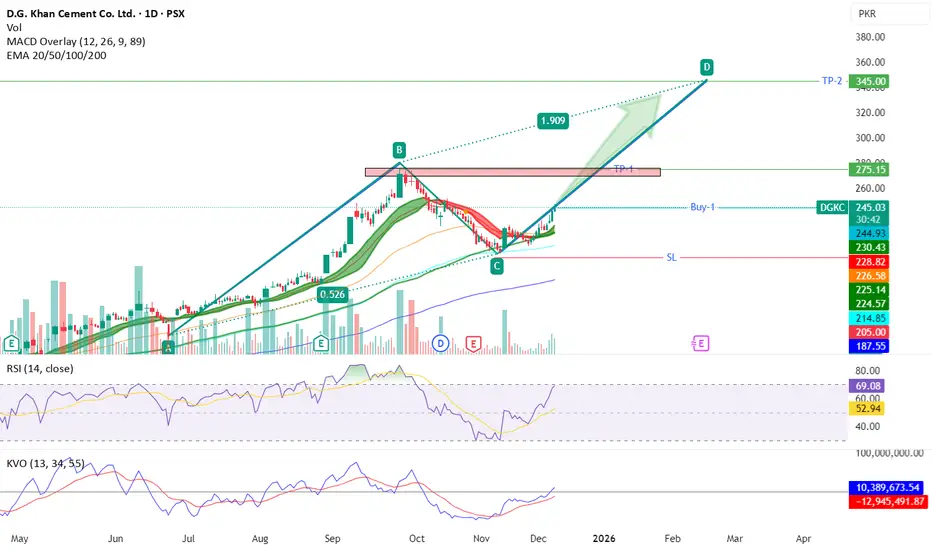
DGKC- PSX - Buy CallOn daily TF, price has just crossed EMA 20 level indicating a bull run. MACD overlay also suggesting start of buying momentum. RSI indicates that buyers are in control means prices are likely to continue the trend. KVO also suggesting that volumes are coming in this SCRIPT as KVO trigger is above Zero now.
AB=CD harmonic pattern has been drawn to arrive to potential TP2.
Trade values:
Buy = 245.50 (CMP)
TP-1: 270~275
TP-2: 345
SL: 205
(Abaxx Technologies — NEO Exchange) — Swing Trade💰 ABXX — Swing Trade Breakdown (Clean TV Idea Format)
(Abaxx Technologies — NEO Exchange)
🏢 Company Snapshot
ABXX is a next-gen commodities + carbon exchange platform builder, gaining attention after a massive multi-month momentum run fueled by regulatory milestones, rising carbon-credit market interest, and speculation around exchange approvals. The stock just pulled back sharply into a major trend support zone.
📊 Fundamentals
• P/E: N/A (pre-revenue; still in buildout phase)
• P/B: High relative to traditional exchanges — typical for early-stage fintech/exchange plays
• Debt/Equity: Low – lean capital structure
• ROE: Negative (expected for pre-revenue)
• Dividend: None — pure growth story
• Free Cash Flow: Negative — early-stage burn
• Cash on Hand: Solid runway based on last filings
Fundamental Summary:
Speculative early-stage exchange platform with a clean balance sheet, strong regulatory tailwinds, and no traditional valuation metrics.
📈 Trends & Catalysts
• Revenue: Pre-commercial; future-driven
• EPS Trend: Negative but stable
• Cash Flow: Controlled burn
• Balance Sheet: Light debt + strong cash reserves
• Catalysts:
– Pending exchange approvals
– Growth in global carbon markets
– Launch updates for LNG + carbon futures platforms
– Regulatory news
• Risks:
– High valuation for pre-revenue
– Volatility and liquidity swings
– Regulatory delays
– Broad-market risk-off selling
🪙 Industry Overview (Condensed)
• Weekly: Slight pullback — profit-taking across speculative growth
• Monthly: Strong trend intact — rotation into alt-exchanges + carbon exposure names
• 12-Month: Significant outperformer vs fintech + carbon peers due to regulatory catalysts and momentum inflows
📐 Technicals
• Price: ~41.80 CAD
• 50-SMA: ~39.70 — primary dynamic support
• 200-SMA: Far below — long-term trend very strong
• RSI(2): Oversold near extreme levels — classic RSI2 pullback
• Structure: Strong uptrend → parabolic extension → hard pullback into 50-SMA retest
• Support: 39.50–40.00 (major level + SMA50 confluence)
• Resistance: 50.30 (TP1), 56.00 (TP2)
• Volume: Elevated on the pullback — emotional selling likely exhausted
🎯 Trade Plan
• Entry Zone: 40.00–41.50 (SMA50 retest + horizontal support)
• Stop Loss: ~39.50 (below the trendline + key structure)
• Target 1: 50.30
• Target 2: 56.00
• Risk/Reward: ~2.0–2.5R depending on entry
• Alternate Setup: If price fails the SMA50, wait for a reclaim above 43.00 to re-trigger the long idea.
🧠 My Take
ABXX is still in a powerful uptrend despite the hard pullback, and the confluence of SMA50 support + RSI2 oversold + prior breakout zone makes this a textbook mean-reversion swing. Volatility is high, but so is the reward. As long as the 39.50 level holds, the bull structure remains intact. The 2:1 R/R into 50–56 is realistic.


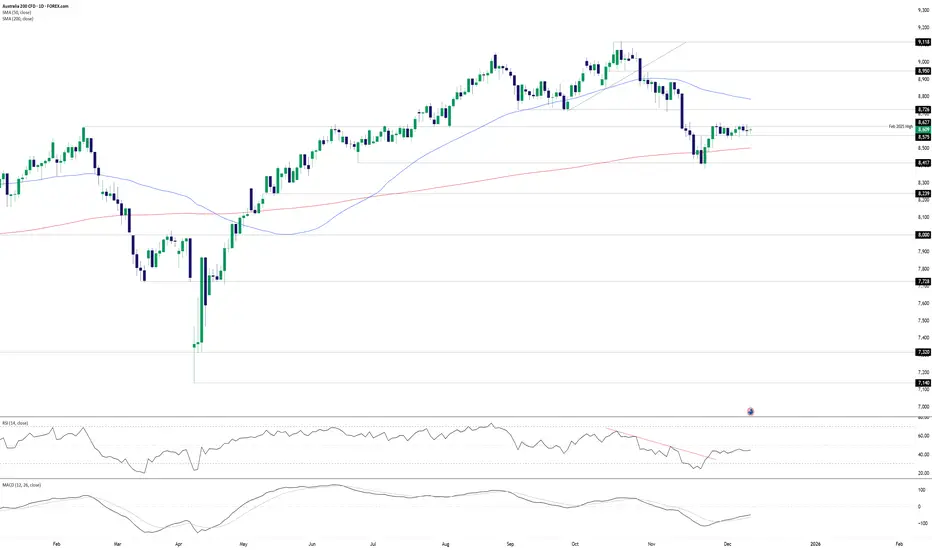
Breakout Risk Builds Before RBAOur ASX 200 contract continues to trade within a narrow range heading into the RBA’s December rate decision, with sellers active above the February high of 8,627 while buyers are lurking on dips below 8,575. Despite multiple probes through both levels over the past fortnight, there has been no close beyond them since 25 November—and that attempt failed.
While there’s no guarantee the RBA decision will deliver a range break, it does present a risk event with the potential to do so. With a well-defined range in play, a sustained breakout in either direction would allow trades to be set targeting a retest of higher or lower levels.
Should the price break and close above 8,627, longs could be established with a stop beneath the level, initially targeting 8,726 given it previously acted as support earlier this year. Conviction in the setup would be bolstered by a close above 8,650.
Conversely, a sustained break beneath 8,575 would flip the setup, with shorts established below the level and a stop above. The 200DMA or 8,417 screen as potential targets. Conviction would grow should the price close beneath the December MTD lows.
Momentum indicators lean marginally bearish on directional bias, though the overall signal is more neutral, placing emphasis on price action. Also note we’re approaching what is traditionally a strong seasonal period for Australian stocks in the second half of December.
Good luck!
DS
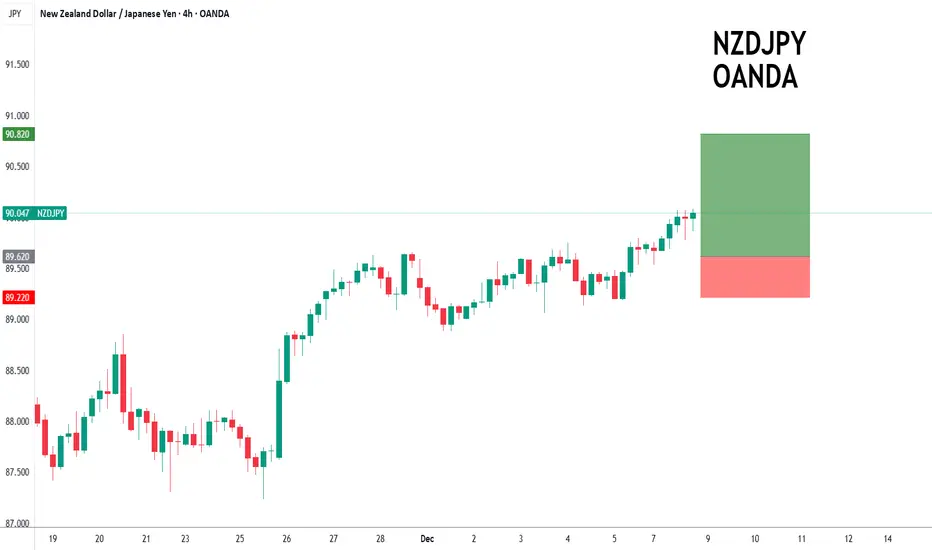
NZDJPY intraday dips continue to attract buyers.NZDJPY - 24h expiry
Intraday dips continue to attract buyers and there is no clear indication that this sequence for trading is coming to an end.
88.88 has been pivotal.
20 4hour EMA is at 89.62.
The RSI is trending higher.
Dip buying offers good risk/reward.
We look to Buy at 89.62 (stop at 89.22)
Our profit targets will be 90.82 and 91.02
Resistance: 90.07 / 90.50 / 91.00
Support: 89.60 / 89.06 / 88.88
Risk Disclaimer
The trade ideas beyond this page are for informational purposes only and do not constitute investment advice or a solicitation to trade. This information is provided by Signal Centre, a third-party unaffiliated with OANDA, and is intended for general circulation only. OANDA does not guarantee the accuracy of this information and assumes no responsibilities for the information provided by the third party. The information does not take into account the specific investment objectives, financial situation, or particular needs of any particular person. You should take into account your specific investment objectives, financial situation, and particular needs before making a commitment to trade, including seeking, under a separate engagement, as you deem fit.
You accept that you assume all risks in independently viewing the contents and selecting a chosen strategy.
Where the research is distributed in Singapore to a person who is not an Accredited Investor, Expert Investor or an Institutional Investor, Oanda Asia Pacific Pte Ltd (“OAP“) accepts legal responsibility for the contents of the report to such persons only to the extent required by law. Singapore customers should contact OAP at 6579 8289 for matters arising from, or in connection with, the information/research distributed.
Hammer Candle Sparks Bullish HopesCoiling within a falling wedge and having printed a hammer candle on the daily timeframe last Friday, a resumption of the broader bullish trend in CHF/JPY may soon be on the cards. However, with RSI (14) and MACD turning neutral on directional bias, confirmation of the bullish signal would be preferred before considering long setups.
192.70 is a level worth keeping an eye on during Monday’s session, coinciding with the high set on 30 October where the price bounced strongly following a failed downside break on Friday. Should we see a retest of the level followed by another bounce, it would strengthen conviction about establishing long positions, creating a setup where entry could be made above the level with a stop beneath it or Friday’s low to protect against an extension of the latest pullback.
The first topside level of note for bulls would be the November downtrend, currently around 194.00. If the pair were to break and hold above this level, it would signal a potential return to the November high of 195.73, putting both it and horizontal resistance at 194.57 on the radar as other bullish targets.
Of course, should CHF/JPY resume its push lower, it would open the door for bearish setups, especially if we see a close beneath 192.70. If that were to eventuate, shorts could be established on the break with a stop above for protection, targeting the influential 50DMA where the price has bounced on six separate occasions since August when breached. A sustained move beyond that level would put 190.54 resistance and uptrend support dating back to February on the radar for bears.
Good luck!
DS

Franc Under PressureEUR/CHF has closed above the 200DMA for the first time since August and is now pressing against resistance at 0.9370, providing a level to build trades around depending on how near-term price action evolves. With RSI (14) pushing higher but not yet overbought, upside strength is building, favouring longs over shorts in terms of directional bias. With MACD confirming the bullish message, the overall signal is strengthened.
Should the pair push above 0.9370 and hold there, longs could be established with a stop beneath the level for protection, targeting 0.9400 initially, with 0.9447 the next option after that.
If the bullish move over the past month stalls at 0.9370, the setup could be flipped, with shorts set beneath the level and a stop above for protection. 0.9350, 0.9320 and the 50DMA screen as potential targets, depending on desired risk-reward from the trade.
With the Swiss National Bank (SNB) interest rate decision looming on Wednesday, it presents a major risk event for traders to be aware of. While the SNB is widely expected to keep its policy rate at 0%, it may come down to signalling on whether taking it into negative territory remains a possibility next year. To this point, the SNB has indicated the bar for doing so is elevated, so any watering down of that assessment may lead to further weakness in the franc.
Good luck!
DS

XAGUSD Long Positioning Headed into FOMCLooking H1 time frame wise closest demand zone around 57.900 is right below Irochimoku cloud, RSI coming it to test and possibly bounce from 50 level, Stochastic RSI in oversold area with a 21/50 SMA cross below price. Were seeing a lot of bullish confluence here if we do end up getting that steeper pullback I would be looking for longs around 57 with a 2 candle swing conformation.

LongBtc long Hello everyone
Bullish position, Bitcoin if it breaks heavy resistance 94k and consolidates above 96k, next target 103k

Aptos Bullish Divergence: Targeting $4.3–$15 Range Aptos has stabilized above the last weekly support; currently, there is a bullish divergence on the weekly chart, so all signals point to a likely upward push. The current range to play is $4.3–$15, and the risk-reward in this case is really good. Thanks to everyone for your attention.

CRM - Minor Downtrend Line Broken!CRM - CURRENT PRICE : 260.57
CRM previously entered a downtrend following a double-top reversal , which pushed the stock into a prolonged bearish trend. However, current price action shows early signs of trend change as CRM successfully breaks above the minor downtrend line with strong momentum.
Momentum indicators are confirming the shift:
⚡RSI has turned bullish and moved decisively above 50
⚡MACD shows a bullish crossover with improving histogram
With improving trend structure and bullish indicators, CRM may continue its upward recovery. Price may extend toward 278.00 and 296.00 as long as it stays above 242.00 (near EMA 50).
ENTRY PRICE : 260.57
FIRST TARGET : 278.00
SECOND TARGET : 296.00
SUPPORT : 242.00
