ETH + BULLISH CROSSEvery time Ethereum has a bullish cross on the Stochastic RSI in the oversold area, we see a rally for a few weeks.
Oscillators

NZDUSD is forming a local bullish reversal structure by FRLNZDUSD is forming a local bullish reversal structure according to the Fractal Reversal Law (FRL).
The market has completed a descending impulse and printed a local FRL neckline, supported by:
1. A completed local impulse channel
2. Bullish MACD divergence
3. A touch of the lower boundary of the main descending structure.
FRL states that a phase transition begins only after the break of the neckline.
This local neckline is the nearest structural trigger for a potential bullish shift.
Until then, this remains a local reversal attempt, not a confirmed trend change.
Share your thoughts on this structure and the nzdusd in general.

Examples of Using the StochRSI Indicator
Hello, fellow traders!
Follow us to get the latest information quickly.
Have a great day!
-------------------------------------
The StochRSI indicator combines the Stochastic indicator with the RSI indicator.
You can find more detailed explanations of this indicator online.
I'd like to explain how to utilize the StochRSI indicator to aid trading.
The standard way to interpret the StochRSI indicator is to interpret chart movements by touching and breaking out of overbought or oversold zones.
The method I use, utilizing this principle, is to draw a trend line.
That is, when the K value of the StochRSI indicator forms a peak in the overbought or oversold zone, I connect those points to create a trend line.
This creates a trend line like the one drawn in the example chart above.
However, when drawing a trend line, the candlestick that forms the peak in the overbought zone must be the open value of a bearish candlestick.
If not, the open value of the first bearish candlestick encountered to the right is used.
In the oversold zone, the peak is the low value.
-
I've also included a second method for interpreting the StochRSI indicator.
When the indicator is activated, the chart above will appear.
This can be intuitively seen by the StochRSI indicator appearing on the price candlestick.
To sustain an uptrend, the price must remain above the StochRSI 80 level.
Therefore, the StochRSI 80 level acts as resistance.
A decline below the StochRSI 20 level likely indicates a downtrend.
Therefore, the StochRSI 20 level acts as support.
This interpretation can be helpful when entering a trade.
However, the most important points are the support and resistance levels drawn on the 1M, 1W, and 1D charts.
Therefore, observing the movement of the StochRSI indicator near the support and resistance levels drawn on the 1M, 1W, and 1D charts can help you determine the trend.
-------------------------------
The StochRSI and RSI indicators are also indicators that utilize averages.
When interpreting indicators that utilize averages, it's important to consider the location of the average and how to interpret it accordingly.
Therefore, the StochRSI 50 indicator point can be used as an average.
Therefore, you can initiate a trade based on whether there is support at the StochRSI 50 indicator point.
As mentioned earlier, the most important points are the support and resistance levels drawn on the 1M, 1W, and 1D charts. Therefore, you should check the movement of the StochRSI indicator around these support and resistance points.
-
Thank you for reading to the end.
I wish you successful trading.
--------------------------------------------------

LINK is Waking Up—But Is This a Bull Trap or the Real Deal?Yello, Paradisers! Did you catch the breakout on LINKUSDT? It looks good at first glance, but there’s a critical detail that could make or break this move—don’t skip this analysis if you’re thinking about jumping in.
💎LINKUSDT has just broken out of a well-defined descending channel, a structure that often marks the end of a downtrend phase. What adds weight to this breakout is the presence of bullish divergence on both the MACD histogram and the Stochastic RSI, two reliable momentum indicators. This confluence significantly increases the probability of a bullish continuation, but that doesn’t mean it’s time to enter blindly.
💎For a higher-probability trade setup, what we want to see next is a small pullback. Ideally, the price should return to the breakout zone, allowing former resistance to flip into solid support. If this area holds, that’s where the opportunity lies—targeting the next major liquidity zones and resistance levels above.
💎However, caution remains essential here. If price breaks back down and closes a candle below the invalidation level, it would invalidate the bullish setup entirely. In that case, it’s far better to remain on the sidelines and wait for a cleaner structure to form, rather than forcing a position during uncertain conditions.
🎖Strive for consistency, not quick profits. This market rewards patience, discipline, and tactical execution. The next big opportunity is always around the corner—but only for those who stay focused and follow the strategy without emotional interference. Be a pro.
MyCryptoParadise
iFeel the success🌴

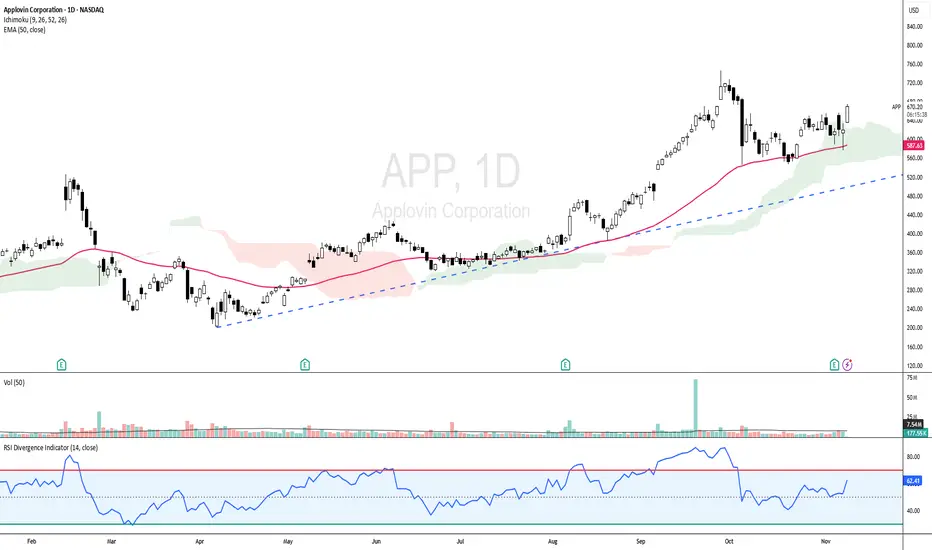
APP - UPTREND STILL INTACT!APP - CURRENT PRICE : 670.00 - 674.00
APP is showing strong bullish momentum as the price trades above the 50-day EMA and ICHIMOKU CLOUD , indicating a sustained uptrend. The RSI is in bullish territory but not yet overbought, indicating room for further upside. With the current setup, the stock has potential to retest its all-time high area if momentum continues.
ENTRY PRICE : 670.00 - 674.00
FIRST TARGET : 727.00
SECOND TARGET : 770.00
SUPPORT : 50-day EMA
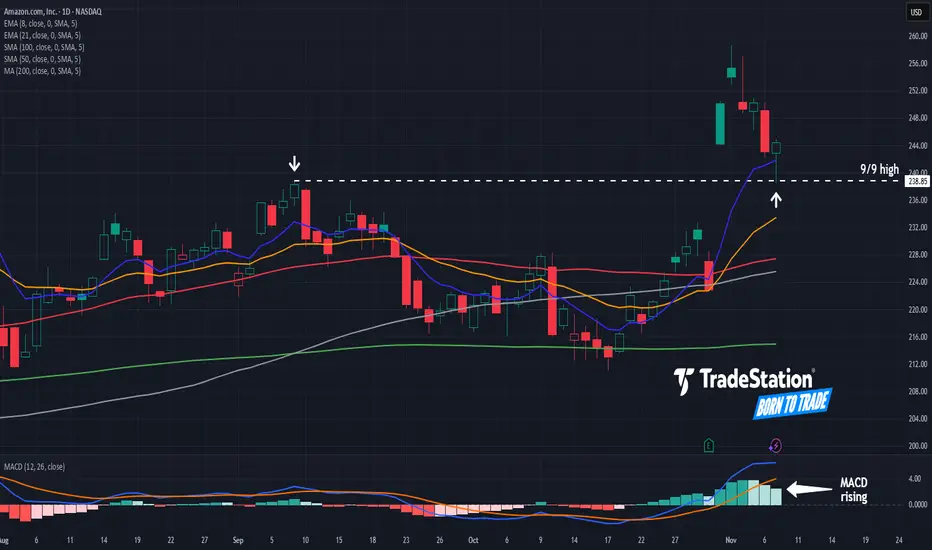
Amazon.com Pulls Back After Earnings BreakoutMomentum from strong earnings propelled Amazon.com to new highs last week, and now it’s pulled back.
The first pattern on today’s chart is the September 9 high of $238.85. The e-commerce and cloud-computing giant tested and held that level last Friday. Has old resistance become new support?
Second, the 8-day exponential moving average (EMA) recently crossed above the 21-day EMA. MACD is also rising. Those signals may reflect short-term bullishness.
Next, AMZN touched its 200-day simple moving average (SMA) less than a month ago. The 50-day SMA and 100-day SMA are also relatively close. Notice how the faster SMAs are above the slower SMAs. That may suggest its long-term trend is getting bullish again.
Last, AMZN is an active underlier in the options market. (Its average daily volume of 977,000 contracts ranked fourth in the S&P 500 last month, according to TradeStation data.) That could help traders take positions with calls and puts.
TradeStation has, for decades, advanced the trading industry, providing access to stocks, options and futures. If you're born to trade, we could be for you. See our Overview for more.
Past performance, whether actual or indicated by historical tests of strategies, is no guarantee of future performance or success. There is a possibility that you may sustain a loss equal to or greater than your entire investment regardless of which asset class you trade (equities, options or futures); therefore, you should not invest or risk money that you cannot afford to lose. Online trading is not suitable for all investors. View the document titled Characteristics and Risks of Standardized Options at www.TradeStation.com . Before trading any asset class, customers must read the relevant risk disclosure statements on www.TradeStation.com . System access and trade placement and execution may be delayed or fail due to market volatility and volume, quote delays, system and software errors, Internet traffic, outages and other factors.
Securities and futures trading is offered to self-directed customers by TradeStation Securities, Inc., a broker-dealer registered with the Securities and Exchange Commission and a futures commission merchant licensed with the Commodity Futures Trading Commission). TradeStation Securities is a member of the Financial Industry Regulatory Authority, the National Futures Association, and a number of exchanges.
Options trading is not suitable for all investors. Your TradeStation Securities’ account application to trade options will be considered and approved or disapproved based on all relevant factors, including your trading experience. See www.TradeStation.com . Visit www.TradeStation.com for full details on the costs and fees associated with options.
Margin trading involves risks, and it is important that you fully understand those risks before trading on margin. The Margin Disclosure Statement outlines many of those risks, including that you can lose more funds than you deposit in your margin account; your brokerage firm can force the sale of securities in your account; your brokerage firm can sell your securities without contacting you; and you are not entitled to an extension of time on a margin call. Review the Margin Disclosure Statement at www.TradeStation.com .
TradeStation Securities, Inc. and TradeStation Technologies, Inc. are each wholly owned subsidiaries of TradeStation Group, Inc., both operating, and providing products and services, under the TradeStation brand and trademark. When applying for, or purchasing, accounts, subscriptions, products and services, it is important that you know which company you will be dealing with. Visit www.TradeStation.com for further important information explaining what this means.
Top 3 Lessons From Trading Since 2017In life you have to know the following:
Learn to keep secrets.
This is very hard especially if you are a leader
i see many many influences make this mistake
Even i myself i have made
this mistake so many times.
Some topics are just to sensitive to share.
Its a sad reality that some people
don't want to know the truth
even if the truth is going to help them.
If you have a business
learn to give your employees more details
The more details you give employees
the more they can help you out.
This also applies to leadership positions.
If you are leader of a group
you have to try your best to give more
details.
Now this does not mean give them
all the details at once
it just means learn to understand
if they did not understand the first time
they did the task you
asked them to do.Be patient with
your employees they are not
perfect give them
time to digest information.
This wont be easy because some employees
dont follow instructions.
Learn to respect monetary limits.
In as much as you want to show off
like every person i know.
You have to hold back and learn to reserve your capital
This is a very powerful lesson that
you can apply
to your trading knowledge as well.
Capital reserving is part of risk management
Look at the MACD indicator on the daily chart
the histogram is Dark green
this is the highest probability of trading that you
could wish for.Of course seeing
such a trade doesn't mean you will
always find good trades
The MACD Histogram is
my favourite indicator
learn more about it
Rocket boost this content to learn more.
Trade safe.
Disclaimer: Trading is risky learn risk management and profit
taking strategies.
Please use a simulation trading account
before oyu trade with real money.

ETHUSD 1H | Bullish Continuation Setup🟢 Market Structure
Price holding above key support at 3,600
4H sell-side liquidity taken below
Bullish structure intact with higher lows
🔵 Key Support Levels
Immediate Support: 3,600 - 3,610 (current zone)
Primary Support: 3,583 - 3,594 (consolidation base)
Strong Support: 3,549 (momentum defense)
🎯 Entry Zones & Targets
🟡 Primary Entry: 3,605 - 3,615 (current retest)
🟠 Secondary Entry: 3,583 - 3,594 (deeper retest)
🔴 Stop Loss: Below 3,548 (support break)
💰 Take Profit Targets
TP1: 3,637 - 3,650 (immediate resistance)
TP2: 3,700 - 3,720 (momentum extension)
TP3: 3,800 - 3,856 (liquidity zone)
⚡ Trade Management
Scale entries on support retests
Move SL to breakeven at TP1
Partial profits at each target
Bullish continuation expected - buying dips toward support
#ETH #Ethereum #TradingView #Bullish #Crypto

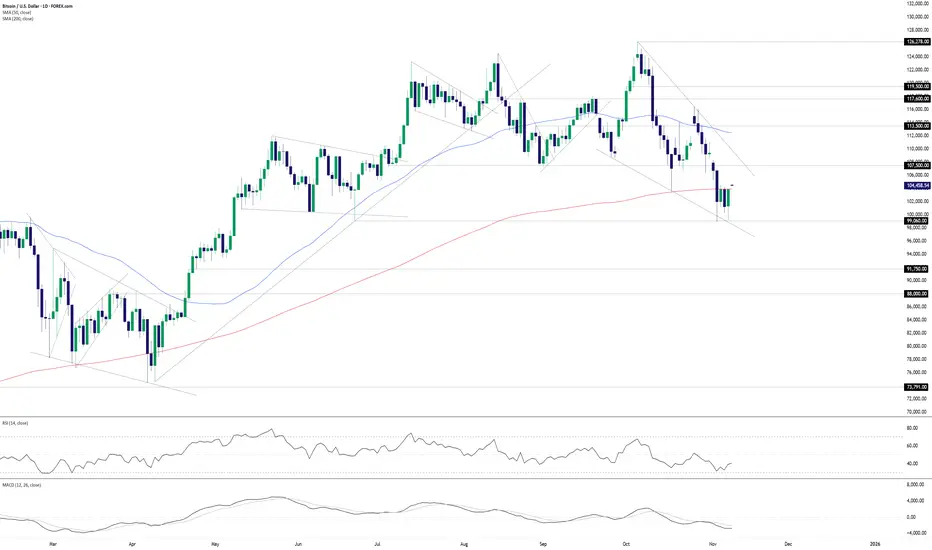
BTC/USD tests 200DMA with trend on the lineBTC/USD continues to bounce strongly from $99,060 support, adding to the sense we may be nearing a bullish turning point if sellers parked above the 200-day moving average are eventually overrun.
Should we see a break and hold above the 200DMA, longs could be established above the level with a stop placed beneath for protection, targeting $107,500 which acted as support earlier this year. It may now flip to resistance.
A break of $107,500 would put the downtrend from the record highs in sight, along with the 50DMA. The former sits around $110,500 and interests me not only because of the falling wedge pattern the price finds itself coiling in but also the reliability prior bullish breakouts from falling wedge patterns have seen in recent times to play out in full.
While RSI (14) and MACD remain firmly entrenched in bearish territory, which favour short setups overall, there’s tentative signs that downside strength may be starting to wane with a higher low set in the former. It’s not a definitive signal and has yet to be confirmed by MACD, but it provides a warning that the tide may be slowly starting to turn.
Of course, should BTC/USD remain capped beneath the 200DMA, the option remains to sell beneath the level with a stop above, targeting another test of support below $100,000. The case for this setup would be strengthened should we see weakness in tech stocks on Monday with BTC/USD demonstrating a strengthening positive relationship with Nasdaq 100 futures over the past fortnight, sitting with a correlation coefficient of just under 0.8.
Good luck!
DS
Improving My Win Loss Ratio In Forex TradingWell, Some good news, actually great news. The experiment worked and in this video I show how I am improving my win loss ratio in Forex trading.
From a disastrous Win Loss ratio using only SMC now with combining the classical school along with the Stochastic I have been nailing it for the past 20 days with 22 trades and 8.6% increase on my balance.
In many cases, especially with advantageous RRR, it is Ok to have the win loss ratio in favor of the Loss, as the RRR will compensate and the balance would increase, but in this case I have the win rate higher and the RRR if it was calculated is also higher.
I depend on opening multiple trades and closing them all at once once they hit an acceptable percentage. In the video I said I will close them around 2%, but to tell you the truth, even if it was 1% I would close because no business I know of would bring 1% profit in a day.
The concern now with this Forex Trading Plan is that it does not use Stop Loss nor Take Profit. I feel that I am hanging in the air, which is not a good feeling and this might get me inside an emotional imbalance in the long run.
Still, the test is going on to evaluate all that.

NQ consolidate US government shutdown and stock price overheat become downward issues. technically weekly chart show stochastic and candlestick pattern potensial make price going down for a few week ahead.
price will consolidation between last high and strong support. will see price next movement later

EURUSD TIMEFRAME-BY-TIMEFRAME ANALYSIS# 💱 EURUSD (EUR/USD) COMPREHENSIVE TECHNICAL ANALYSIS 🎯
## Week of November 10-14, 2025 | Intraday & Swing Trade Mastery
Close Price: 1.15640 | Entry Point: November 8, 2025, 12:54 AM UTC+4 📊
## 🔍 EXECUTIVE SUMMARY - MULTI-TIMEFRAME PERSPECTIVE
EUR/USD is trading at a critical technical inflection point with strong multi-timeframe alignment signaling imminent directional breakout. Elliott Wave analysis reveals completion of corrective cycles, positioning for next impulse leg targeting 1.1650-1.1750 extension zone with substantial momentum. Bollinger Bands display classic compression squeeze pattern —volatility condensation preceding directional explosion. RSI across all timeframes maintains neutral-bullish bias (52-65 range)—optimal momentum positioning without extreme overbought conditions. Volume clustering at 1.1550-1.1630 represents significant institutional accumulation foundation. Wyckoff spring tests near 1.1500-1.1520 provide aggressive entry triggers. Harmonic pattern convergence at 1.1680-1.1750 resistance signals breakout confirmation with measured move targets extending to 1.1850+. ECB/Fed policy divergence supports directional clarity emerging this week.
## 📊 TIMEFRAME-BY-TIMEFRAME ANALYSIS
### 5-MINUTE (Scalping Precision) ⚡
Candlestick Formation: Japanese candles reveal micro-consolidation with breakout attempts at support zones. Evening Star rejection formations detected at 1.1680-1.1710 intraday resistance creating short opportunities.
Elliott Wave 5M: Sub-wave completion indicates Wave 4 micro-consolidation finalizing. Wave 5 breakout anticipated above 1.1650-1.1680 with targets 1.1720-1.1780 (measured move).
Bollinger Bands: Upper compression mode—middle band at 1.1630 acts as pivot point. Lower band rejection (1.1550-1.1580) creates scalp-long setups with excellent risk/reward ratios.
RSI (14) Analysis: RSI oscillating 48-62 range—neutral territory with minor divergences forming. Bullish divergence at 1.1550 support signals buyer engagement; caution on 68+ resistance approach.
Micro Support/Resistance: 1.1550 (micro-support) | 1.1600 (POC cluster) | 1.1640 (pivot) | 1.1690 (intraday resistance) | 1.1740 (scalp target)
Volume Signature: Volume concentrated 1.1600-1.1660 zone—institutional marker established. Breakout volume >50% above average required above 1.1690 for sustained move above 1.1750.
VWAP Alignment: Price oscillating around session VWAP at 1.1625—each touch generates scalp opportunity. Upper VWAP band at 1.1710; lower support at 1.1550.
### 15-MINUTE (Quick Swing Gateway) 🎢
Candlestick Patterns: Engulfing bars forming at support zones—bullish engulfing at 1.1570 zone confirms reversal attempts. Three-candle patterns (flag continuation) with 50-80 pips breakout potential.
Harmonic Pattern Recognition: Gartley Pattern potential completion near 1.1560-1.1620 PRZ (Potential Reversal Zone). Exceptional risk-reward at 1:3.5 for harmonic traders. Butterfly variant also forming.
Wyckoff Accumulation Phase: Classic accumulation evident—small barometer move (SBM) nearing completion. Spring test anticipated 1.1480-1.1510 zone; markup phase targets 1.1750-1.1850.
Bollinger Bands (15M): Band squeeze intensifying—historical volatility expansion suggests 70-120 pips moves follow. Upper band resistance at 1.1740; lower band support at 1.1520.
Volume Profile (15M): Point of Control (POC) at 1.1630—prime concentration zone. Volume surge >55% required confirming breakout above 1.1710. Imbalances favor upside significantly.
Ichimoku Cloud (15M): Price consolidating below cloud edge—Tenkan-sen at 1.1700 = resistance pivot. Kijun-sen (1.1660) = critical secondary support. Cloud support 1.1540-1.1610.
EMA Structure: EMA 9 (1.1650) above EMA 21 (1.1610)—bullish alignment confirmed. Price above both = intraday strength maintained.
### 30-MINUTE (Intraday Swing Axis) 🔄
Pattern Formation: Symmetrical Triangle pattern consolidating with apex near 1.1700. Ascending triangle variant shows bullish bias—breakout above 1.1680 targets 1.1780-1.1850 extension.
Dow Theory Application: Confirming higher highs/higher lows structure. Secondary trend bullish; pullbacks to EMA 20 (1.1640) = optimal swing entry zones identified.
RSI Divergence Setup: Positive RSI divergence confirmed—price making lower lows (1.1540) while RSI forms higher lows (42 level). Classic reversal setup targeting 1.1720 minimum.
Exponential Moving Average: EMA 9 (1.1665) = core support pivot. EMA 21 (1.1610) = secondary support. EMA 50 (1.1500) = structural hold level. Bullish ribbon alignment intact.
Support Architecture: 1.1500 (EMA 50/structural) | 1.1560 (demand zone) | 1.1610 (volume cluster) | 1.1650 (EMA 9 dynamic)
Resistance Architecture: 1.1680 (triangle formation) | 1.1750 (measured move target) | 1.1800 (weekly resistance) | 1.1850 (extension)
Volume Analysis (30M): Increasing volume on recent bars—accumulation signature strong. Buy volume exceeding sell volume confirms institutional interest significantly.
### 1-HOUR (Core Swing Trade Engine) 🎯
Elliott Wave Structure: Major wave analysis suggests Wave 3 completion near 1.1750. Current Wave 4 correction targets 1.1650-1.1700 support zone. Wave 5 impulse anticipated—target: 1.1850-1.1950.
Pennant Formation: Classic Bullish Pennant pattern forming—breakout confirmation above 1.1710 validates pattern. Pole height measured move = 1.1850+ realistic target.
Bollinger Bands (1H): Upper band at 1.1800 = squeeze breakout target. Middle band (1.1700) = bullish support zone. Lower band rejection (1.1500) creates swing longs with excellent R/R.
VWAP Daily: EUR/USD trading above daily VWAP at 1.1600—bullish gradient confirmed. Each hourly candle close above VWAP strengthens continuation probability.
Volume Profile Hotspot: Heavily traded at 1.1600-1.1660 (accumulation zone) and 1.1710-1.1780 (resistance cluster). Imbalances above 1.1800 suggest vacuum-fill potential.
Ichimoku Cloud Alignment: Price above Senkou Span A (1.1700) & Span B (1.1660)—cloud thickness indicates strong support. Chikou Span above candles = bullish confirmation. Cloud color: BULLISH GREEN.
Gann Theory Application: 45-degree angle from swing low (1.1450) establishes rally trajectory. Resistance at 38.2% Fibonacci extension (1.1750) precedes aggressive breakout phase.
Support Tiers 1H: 1.1500 (structural hold) | 1.1570 (EMA support) | 1.1620 (Kijun-sen) | 1.1660 (accumulation zone)
Resistance Tiers 1H: 1.1710 (breakout trigger) | 1.1760 (extension) | 1.1800 (major level) | 1.1850 (impulse target)
### 4-HOUR (Swing Trade Thesis Foundation) 💼
Inverse Head & Shoulders Pattern: Potential IH&S formation completing—left shoulder (1.1450), head (1.1400), right shoulder completing (1.1500-1.1560). Neckline breakout at 1.1710 targets 1.1900-1.2000 extension.
Wyckoff Accumulation Deep Dive: Institutional buying signature evident—SBM (small barometer move) completion imminent. Spring test to 1.1480-1.1510 anticipated; subsequent markup phase targets 1.1850-1.2000.
RSI 4H Analysis: RSI at 56-68 range—bullish bias maintained. Room for upside extension without extreme overbought. RSI above 74 targets 1.1900+; below 34 = defensive posture required.
Cup & Handle Formation: Potential bullish Cup pattern visible on 4H—handle stabilization near 1.1650-1.1700. Breakout above handle (1.1760) targets cup depth extension = 1.1850-1.1950.
EMA Ribbon Structure: EMA 8 (1.1680), EMA 13 (1.1660), EMA 21 (1.1610), EMA 50 (1.1500), EMA 200 (1.1350)—BULLISH ALIGNMENT PERFECT. Compression/expansion cycles identify momentum phases.
Support Tiers 4H: 1.1450 (structural support) | 1.1500 (accumulation) | 1.1600 (pivot) | 1.1660 (demand cluster)
Resistance Tiers 4H: 1.1710 (key breakout) | 1.1760 (extension) | 1.1800 (major target) | 1.1900 (weekly projection)
Volume Signature 4H: Accumulation volume bars > distribution bars—bullish bias maintained. Volume nodes clustering at 1.1600-1.1660 indicate strong institutional support zone.
### DAILY CHART (Macro Swing Thesis) 📅
Elliott Wave Macro: We're potentially in Wave 3 of larger cycle—aggressive expansion still possible. Wave structure supports break of 1.1800 targeting 1.1950-1.2100 daily close objectives.
Double Bottom Recognition: Historical Double Bottom pattern near 1.1350-1.1450 support—confirmed breakthrough above 1.1710 neckline triggered. Second target near 1.1900-1.2000.
Bollinger Bands Daily: Upper band at 1.1900 = realistic daily target zone. Mean (1.1750) = healthy pullback support. Band slope indicates volatility expansion—expect 100-200 pips daily ranges.
Volume Profile Daily: Strong buying volume bar at 1.1500-1.1650 zone—institutional accumulation marker established. Selling volume decreasing—demand controls trend absolutely.
Ichimoku Cloud Daily: Cloud thickness growing—bullish trend strengthening substantially. Cloud support around 1.1650-1.1750 zone. Kumo breakout anticipated—targets cloud top at 1.1800-1.1900.
Harmonic Analysis Deep: Butterfly Pattern potential completion—PRZ at 1.1710-1.1780 suggests reversal zone OR breakout confirmation. Confluence amplifies probability of extension.
Gann Angles & Fibonacci: 50% retracement (1.1550) + 61.8% extension (1.1850) = key reversal zones. Gann fan angles suggest 1.1800-1.1900 as structural resistance before continuation.
Key Daily Support: 1.1400 (psychological/structural) | 1.1500 (accumulation zone) | 1.1600 (demand level) | 1.1700 (midpoint)
Key Daily Resistance: 1.1710 (breakout trigger) | 1.1780 (extension) | 1.1850 (measured move) | 1.1950 (weekly target)
Trend Confirmation: Higher highs & higher lows maintained—uptrend intact. Daily close above 1.1800 = strong continuation signal targeting 1.2000+ next level.
## 🎪 TRADING SETUP PLAYBOOK - NOV 10-14
### BULLISH SCENARIO (Probability: 80%) ✅
Trigger: 4H candle close above 1.1760 + volume surge (>50% above average) + RSI above 64
Entry Zone: 1.1700-1.1750 (with breakout confirmation signal)
Target 1: 1.1780 (TP1) | Target 2: 1.1820 (TP2) | Target 3: 1.1900 (TP3) | Target 4: 1.1950 (TP4)
Stop Loss: 1.1620 (below EMA/structural support)
Risk/Reward: 1:3.2 (excellent asymmetric setup)
Trade Duration: 18-72 hours (prime swing window)
### BEARISH SCENARIO (Probability: 20%) ⚠️
Trigger: Daily close below 1.1650 + volume increase + RSI divergence failure
Entry Zone: 1.1760-1.1850 (short setup)
Target 1: 1.1710 (TP1) | Target 2: 1.1650 (TP2) | Target 3: 1.1600 (TP3)
Stop Loss: 1.1900 (above resistance)
Risk/Reward: 1:1.6 (acceptable but lower probability)
Trade Duration: Watch for trend reversal confirmation first
## ⚠️ VOLATILITY & OVERBOUGHT/OVERSOLD CONDITIONS
Current Volatility Status: Moderate compression → Expect significant expansion imminent
5M/15M RSI: 48-62 range (neutral)—room for 25-50 pips movements | Scalp target zones
30M/1H RSI: 52-66 range (bullish bias, optimal zone)—sweet spot for swing entries
4H RSI: 56-70 range—approaching caution zone but room to extend | Safe for core swings
Daily RSI: 60-74 range (approaching extremes)—be defensive if daily RSI>76 | Take profits aggressively
Overbought Recognition Points:
RSI daily >75 combined with upper Bollinger Band rejection = immediate profit-taking
Ichimoku cloud top penetration fails (bearish candle rejection) = trend exhaustion signal
Volume declining on breakout attempt = false breakout warning signal
Harmonic pattern PRZ exact hit without follow-through = reversal likely imminent
Oversold Bounce Setups:
RSI 1H <32 on support touch = high-probability bounce back to 1.1750-1.1800
Price below EMA 50 (1.1500) + RSI <30 = aggressive accumulation zone
Spring test below 1.1490 with volume surge = Wyckoff spring reversal trigger
Harmonic pattern PRZ support bounce = measured move extension targets activated
## 🎯 ENTRY & EXIT OPTIMIZATION STRATEGY
### OPTIMAL ENTRY TIMING
For Scalpers (5M): RSI bounce from 44-50 zone after Band lower touch = 15-25 pips scalp (1-3 min holds)
For Quick Swings (15M-30M): 15M candle close above 1.1690 with 4H alignment = 60-100 pips swing (30 min-2 hour holds)
For Core Swings (1H-4H): 4H pennant breakout above 1.1760 on volume = 150-250+ pips target (hold 12-48 hours)
For Position Swings (Daily): Daily close above 1.1800 = continuation play targeting 1.1950-2.0000 (hold 5-7 days)
Best Entry Windows: Asian session overlap (22:00-8:00 UTC), London open (8:00 UTC), NY close (21:00 UTC)
### EXIT STRATEGIES & PROFIT TAKING
Take Profit Levels: TP1: Fibonacci 38.2% (1.1760) | TP2: Harmonic PRZ (1.1820) | TP3: Daily Band upper (1.1900) | TP4: Weekly target (1.1950)
Stop Loss Placement: Always below most recent swing low + 20 pips (strict risk management priority)
Trailing Stops: Activate at TP2—trail with 30-40 pips buffer for 4H+ trades (lock in profits)
Breakeven Exit: Move stops to entry after 1:1 risk/reward achieved—eliminate emotional trading
Partial Profit Strategy: Close 25% at TP1 | 25% at TP2 | 25% at TP3 | Let 25% run to TP4 (maximize winners)
## 🔔 REVERSAL & BREAKOUT RECOGNITION CHECKLIST
### REVERSAL SIGNALS TO MONITOR:
RSI positive divergence (lower price lows, higher RSI lows) = bullish reversal setup high probability
Candlestick engulfing patterns at support/resistance zones = trend reversal confirmation strong signal
Volume profile breakdowns (declining volume on breakout attempts) = false move warning immediate
Ichimoku Cloud rejection (price fails to penetrate cloud layer) = structural resistance confirmed
Harmonic pattern completion at exact PRZ = reversal zone probability increases significantly
Elliott Wave 5th wave failure (truncation) = impulse completion = reversal imminent trigger
Gann angle break through significant angle = trend line break = reversal trigger activated
### BREAKOUT CONFIRMATION RULES:
Close beyond resistance with >50% volume surge above average = confirmed breakout signal strong
RSI crosses above 60 for bullish breakout, below 45 for bearish breakout confirmation
VWAP alignment with directional move = institutional participation confirmation strong
Bollinger Band breakout with band expansion (squeeze release) = volatility expansion confirmed immediate
Multiple timeframe confluence (5M + 15M + 1H + 4H aligned) = highest probability setup attainable
Ichimoku Cloud break (price clears all clouds with bullish candles) = strong continuation signal
Volume imbalance (ask volume > bid volume) = directional sustain likelihood increases significantly
## 💡 WEEK FORECAST SUMMARY - NOV 10-14
Monday (10th): 🌍 Consolidation continuation near 1.1650-1.1700 zone. Range-bound trading anticipated. Early breakout direction watch crucial. Entry setups favor reversal plays at support zones.
Tuesday-Wednesday (11-12th): 📈 Prime breakout window opens —1.1760 represents key decision point. Expect 100-200 pips daily volatility. Breakout confirmation targets 1.1820-1.1900 extension. This is the optimal swing trade window all week. ECB speakers watch critical.
Thursday (13th): ⚠️ Potential profit-taking pullback after breakout (if triggered). Support retest of 1.1780-1.1720. Buying opportunity if pullback holds above 1.1700.
Friday (14th): 📊 Weekly close pattern formation critical. Extension run anticipated if above 1.1800. If above 1.1850 = week target 1.1950-2.0000 achieved. End-of-week positioning for next week.
## 📍 CRITICAL CONFLUENCE ZONES - KEY TARGETS
1.1450-1.1500: Major support zone (accumulation marker, Wyckoff spring area, structural hold)
1.1550-1.1650: Secondary support (EMA 9, demand cluster, psychological level, volume POC)
1.1680-1.1710: Micro-resistance cluster (consolidation squeeze zone, early breakout resistance)
1.1750-1.1800: KEY BREAKOUT ZONE (triangle apex, harmonic confluence, all timeframe resistance)
1.1800-1.1900: Primary upside target (Elliott Wave 5, daily Band upper, measured move extension)
1.1900-1.1950: Secondary extension target (Gann level, macro resistance, wave projection)
1.1950-2.0000: Weekly/monthly target (if wave 5 impulse extends beyond base projections)
## 🏆 RISK MANAGEMENT RULEBOOK
✅ 1) Position Sizing: Never risk >2% of account equity per single trade
✅ 2) Risk-Reward Ratio: Minimum 1:2.5 R/R on every entry—1:3+ preferred for swing trades
✅ 3) Profit Scaling: Close 25-50% at 1:1 ratio, let remainder run to 1:2+ targets
✅ 4) Stop Loss Discipline: Place stop IMMEDIATELY on entry—no exceptions (20 pips tight)
✅ 5) Breakout Confirmation: Avoid FOMO—wait for candle close confirmation + volume surge always
✅ 6) Daily Support Respect: Psychological holds (round numbers 1.1600 | 1.1800) matter—trade confluence not against
✅ 7) Time Management: Exit losing trades quickly (max 1:0.5 acceptable for educational losses)
✅ 8) Macro Alignment: Always check daily/4H bias before taking 1H or lower trades
## #EURUSD #EUROUSD #FOREXTRADING #EURUSDANALYSIS
#TECHNICALANALYSIS #ELLIOTTWAVE #HARMONICPATTERN #BREAKOUTTRADING
#SWINGTRADER #DAYTRADING #INTRADAY #FOREXANALYSIS #TRADINGVIEW
#BOLLINGER BANDS #RSI #ICHIMOKU #VWAP #TRADINGSTRATEGY
#WYCKOFFMETHOD #GANNTHEORY #DOWTHEORY #TECHNICALS #ANALYSIS
#SUPPORTANDRESISTANCE #VOLUMEANALYSIS #OVERBOUGHT #OVERSOLD #REVERSAL
#FOREXTRADERS #CURRENCYTRADING #BREAKOUTSETUP #TRADERSOFTWITTER
#TECHNICALTRADER #CANDLESTICK #PATTERRECOGNITION #CHARTANALYSIS #DAYTRADER
## 🎁 BONUS: DAILY PRE-MARKET CHECKLIST
Use this every morning before market open:
☑️ Check daily RSI (should be 60-72 for bullish bias continuation)
☑️ Identify support/resistance zones (1.1600 | 1.1700 | 1.1760 | 1.1900)
☑️ Verify 4H chart alignment (pennant/IH&S pattern status update)
☑️ Check Ichimoku cloud position (above/below = trend confirmation signal)
☑️ Review 1H Elliott Wave count (which wave are we trading exactly?)
☑️ Scan volume profile (POC = likely rejection zone area)
☑️ Set entry orders + stop losses BEFORE Asian session closes
☑️ Plan 3 Take Profit levels before entering any position
☑️ Monitor ECB/Fed speakers + economic calendar (interest rate expectations)
## 🌐 FOREX SESSION NOTES
EUR/USD trades 24/5 across all sessions . Highest volatility typically occurs:
Asian Session (22:00-8:00 UTC): Lower volatility—good for breakout setups forming
London Session (8:00-16:30 UTC): Prime trading hours —peak liquidity + volatility combination
NY Session (14:30-21:00 UTC): Secondary volatility surge—often confirms London direction
ECB/Fed Policy Impact: Monitor policy divergence—higher Fed rates support USD weakness = EUR strength
💡 Disclaimer: This technical analysis is educational only. Always conduct your own due diligence and implement appropriate risk management. Past performance does not guarantee future results. Trade responsibly within your risk tolerance. Use stop losses on every position. Not financial advice.
Analysis Created: November 8, 2025 | Valid Through: November 14, 2025 | Updated Daily

Broadridge Financial Breakout from Double Bottom | Target: 239.8🧩 Pattern Overview
Broadridge Financial has given a strong breakout from a Double Bottom pattern , signaling a potential bullish reversal after a prolonged downtrend. This pattern typically represents the end of selling pressure and the beginning of a new upward phase.
💫 RSI Indication
The RSI was in the oversold zone prior to the breakout, suggesting that the stock was undervalued and ripe for a technical rebound. The recovery in RSI now supports the bullish sentiment, indicating improving momentum.
📊 Technical View
Price has closed above the neckline of the double bottom formation.
The structure confirms a shift in sentiment from bearish to bullish.
Momentum indicators are showing early signs of strength and potential continuation.
🎯 Target Projection
Based on the breakout measurement of the double bottom pattern, the upside target is set at 239.8 . Sustained movement above the neckline could drive prices toward this level in the near term.
💡 Trading Insight
Broadridge Financial’s breakout from the double bottom, combined with an oversold RSI recovery, strengthens the bullish outlook. Traders can monitor for follow-through price action as confirmation of trend continuation toward the projected target.

Iron Ore Bears in Control After 200DMA BreakIron ore has fallen through the 200-day moving average, a level consistently tested but rarely crossed, as seen in price action over the past year. If the contract closes below it today, a short setup could be on the cards.
Traders could sell with a stop above the 200DMA to protect against a reversal, targeting ¥747 support. ¥755, the low of October 20, is also on the radar for anyone considering the setup. Should the unwind extend beyond ¥747, ¥735 is the next logical target, coinciding with former resistance that capped the price several times earlier this year.
Oscillators are sending a bearish message. RSI (14) is trending lower beneath 50, while MACD confirmed the signal with a bearish crossover earlier this week. Downside strength is building, favouring short setups.
On the fundamental side, Chinese trade data released today showed a 4.3% drop in iron ore imports in October. That may be contributing to the bearish breakdown, especially with steel exports also falling sharply compared to a month earlier.
Good luck!
DS

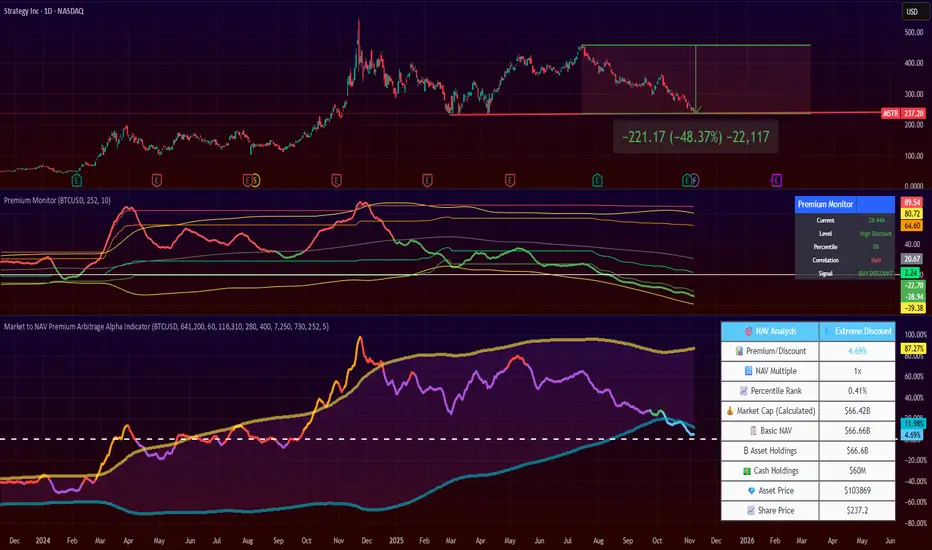
Strategy's Premium is Gone. Time to Load? 4 months ago, I posted that NASDAQ:MSTR premium was unsustainable and the stock price would drop.
Since then, the price dropped by 50%!!
Now, Strategy's is close to zero, and I flip my views on it.
If you like this kind of trade, it might be a good time to start DCA'ing it.
Note that Strategy continues to be a highly volatile stock, more volatile than Bitcoin itself.
Finally, the stock is now at a technical resistance level.
You can keep an eye on the premium/discount of this stock by looking at my 2 indicators:
Market to NAV Premium Arbitrage Alpha Indicator , and
Asset Premium/Discount Monitor
Small Caps Look VulnerableBe it the longest government shutdown in history, the largest increase in October layoffs since 2003, the increasingly unconvincing price action, shifting momentum picture, or the descending triangle it’s coiling in, the purest cyclical play in the U.S. equity index universe—the U.S. small caps 2000 contract—looks vulnerable to downside.
2420 is where bulls and bears are currently slugging it out, marking support that’s held since mid-October. While the price continues to bounce from the level, the moves are becoming increasingly small, hinting that downside may loom.
A break and close beneath 2420 could see shorts established with a stop above to guard against reversal, targeting 2370 support—an area that’s consistently attracted buyers since September.
RSI (14) is trending lower and sits beneath 50, indicating building downside pressure. MACD is entering negative territory after crossing the signal line from above, suggesting directional risks are skewing lower even if the signal remains neutral for now.
Good luck,
DS

PONKEUSDT - A Major Dump Incoming?Yello Paradisers — did you just witness that clean breakdown on PONKEUSDT? If not, this might be your early warning. The structure is starting to unravel, and if you're not prepared, this move could catch you off guard. Let’s walk through what’s happening and how to approach it with precision.
💎PONKEUSDT has broken down from a rising wedge pattern that formed right beneath a significant resistance zone. This breakdown isn’t just technical noise — it’s supported by strong bearish confluence across multiple indicators. We're seeing clear divergence on the MACD histogram, RSI, and Stochastic RSI, all of which point toward weakening bullish momentum and increasing downside probability. When you have structure, resistance, and momentum all aligning like this, it's time to start thinking defense — not offense.
💎If the price retraces back up toward the resistance zone, this could provide a cleaner and higher-probability entry for shorts. Ideally, traders should look for confirmation through candlestick patterns such as a bearish engulfing to validate their setup. A retracement followed by rejection would not only strengthen the bearish case but also significantly improve the risk-to-reward ratio of any new positions.
💎However, it’s crucial to stay objective. If PONKEUSDT pushes back above the resistance zone and closes a candle with conviction, the bearish setup becomes invalid. That would be our signal to step aside and wait for new confirmation before making any moves. Trading based on probabilities means knowing exactly when you're wrong — and having the discipline to act on that.
🎖We are playing it safe right now. If you want to be consistently profitable, you need to be extremely patient and always wait only for the best, highest probability trading opportunities.
MyCryptoParadise
iFeel the success🌴

Hidden Cup & Handle, $DFLI $3+I am publishing a very speculative cup & handle chart analysis idea. I have never seen such a technical analysis for a cup & handle and do not recommend any financial advice due to it. This is an idea alone.
On the 30min timeframe, I have isolated the price pattern between today and October 15 and moved it up to the ending price on October 15 (effectively ignoring the downward gap that occurred after hours that day). The reason why I am ignoring that downward gap and not ignoring the pre-market upward gap before October 15 is explained below.
If you chart the price action this way, a clear and obvious cup and handle chart exists on the half-day chart (195min), which I successfully used in a previous chart analysis idea. I am publishing this idea with the 30min chart to more clearly show the bullish reversal taking place with the indicators and the failing selling pressure.
Chart analysis price target $3+
Chart analysis invalidated below $1-
Background:
NASDAQ:DFLI has experienced very choppy price action due to heightened involvement and excitement with the stock in combination with materially significant company and stock operations (new stock offerings, debt payments, NASDAQ compliance, patent approvals, bullish institutional fundamentals, etc). In particular, on October 15, the day began with news of a new patent approval (that gapped the stock up) and ended the day with news of a new stock offering (that gapped the stock down). After observing what the stock has done since that day, I believe the down gap which occurred after hours October 15 to be an overreaction and the underlying stock transactions since that day to actually be in an upward trend. The reason I believe this is due to the failing selling pressure being applied toward the beginning of each trading session AND due to the clear bullish trend reversal on the 30min MFI, MACD, and BB since the down gap (as shown with the perpendicular line). Data shows that short selling significantly increased over the past month (most likely on Oct 15 and causing the down gap), but given the failure to break the support above $1 - $1.15 and also given the the upward indicators, I expect shorts might cover soon.

Double Bottom on $ROOTNASDAQ:ROOT has retraced to its 100 W moving average and is bouncing off it at the moment. This is occurring within a lower volume lower low within a 24 W bollinger band while (importantly) not touching the lower limit. Many new investors entered last quarter (between orange lines) and if they haven't sold out, could provide the support for a base above current price.

Kraken Robotics (TSX-V: PNG) - Swing TradeSwing Setup
PNG.TO
— Swing Trade Breakdown
Kraken Robotics (TSX-V: PNG) is a Canadian marine technology company developing sonar and underwater robotics systems used in defense and offshore energy. The stock has exploded off its 52-week lows, driven by strong order flow and renewed interest in small-cap defense tech. It’s now showing a clean momentum setup with defined support and resistance levels for swing traders.
📊 Fundamentals
Kraken trades at roughly 92× earnings, far above the small-cap tech average (20–30×), meaning growth expectations are already baked in. The price-to-book is around 14×, showing limited book value support.
On the positive side, ROE sits near 17% with debt-to-equity at only 0.3, so leverage is low. However, free cash flow is still negative (~-13 M CAD) and the company relies on reinvestment for growth. Cash reserves around 33 M CAD provide a liquidity cushion.
Overall, Kraken is a high-growth, high-valuation play — decent profitability but no margin for execution mistakes.
📈 Trends & Catalysts
Revenue has climbed roughly 30% YoY (to about 90 M CAD), while EPS turned modestly positive (~0.06 CAD). That growth has investors rotating into the name, but negative operating cash flow remains a concern.
Recent catalysts include:
• New contracts in sonar and subsea battery systems
• Expanding demand from naval and defense clients
• Broader rotation into small-cap tech and defense innovation plays
Main risks: valuation stretch, execution in complex defense contracts, and persistent negative FCF.
🪙 Industry Context
Marine robotics is a small but rapidly growing niche. Over the past year, PNG has surged more than 200%, massively outperforming the TSX Tech Index. Sentiment has shifted bullish after years of stagnation, and the stock remains a micro-cap momentum magnet — but prone to sharp corrections.
📐 Technical View
PNG is trading near 5.69 CAD, well above its 50-day SMA (~5.00) and 200-day SMA (~3.50) — confirming a strong uptrend.
Momentum cooled after a sharp run, with RSI2 at 1.94, resetting from short-term overbought conditions.
The 5.50–5.60 CAD zone is now acting as support (former breakout base), while 7.40 CAD marks the key resistance at the recent high. Volume spikes during rallies suggest institutional accumulation — but expect volatility.
🎯 Trade Plan
I’m watching for a pullback entry around 5.50–5.70 CAD, which aligns with the 20-day EMA and prior consolidation range.
Stop-loss sits near 5.00 CAD, just below structural support.
Initial target is 7.40 CAD, offering roughly a 1.2:1 R/R, extendable toward 8.00+ CAD if momentum continues.
Alternatively, a breakout above 6.70 CAD on strong volume could trigger a momentum continuation setup for active traders.
🧠 My Take
Kraken is in a confirmed uptrend with strong sector tailwinds and visible contract growth. Valuation is aggressive, but momentum remains intact. This is a high-beta swing trade, not a long-term hold — I’m looking for a disciplined entry near support or a confirmed breakout, keeping risk tight and respecting volatility.
Bias: Bullish above 5.50 CAD, targeting 7.40 CAD+
Invalidation: Close below 5.00 CAD

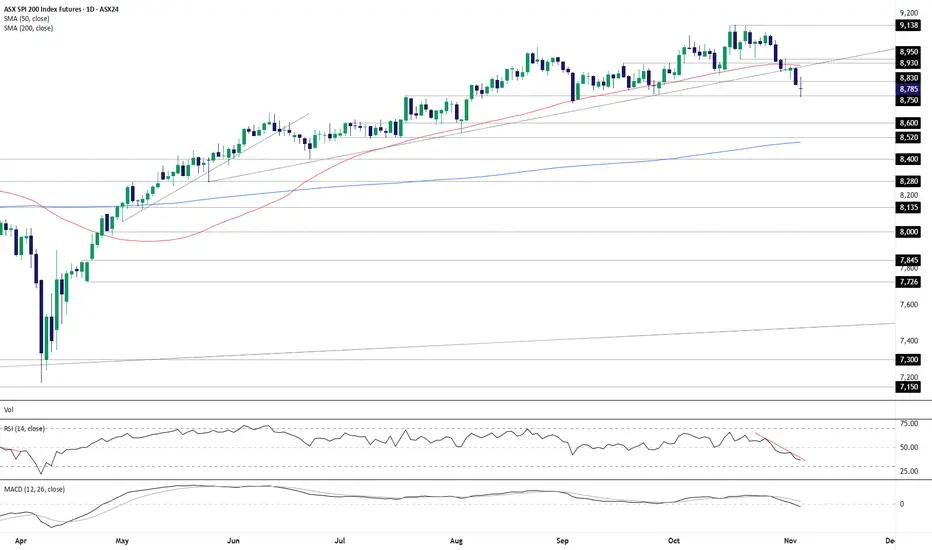
ASX SPI: Bounce Like It’s 2025?The second downside target of the short trade in ASX 200 SPI futures discussed last Friday has now been achieved, prompting a reassessment: hold, add, square, or flip?
The uptrend that had been in place since late May finally gave way after a brief period of indecision. The subsequent bearish move broke minor support at 8830 on Tuesday before stalling at 8750 on Wednesday.
While price action and momentum indicators remain extremely bearish, suggesting the breakdown could evolve into a more pronounced downtrend, it’s impossible to ignore the broader context. This is 2025. Since the Liberation Day lows in April, every bearish episode has been met with aggressive dip-buying. Until proven otherwise, we must remain open to the possibility of history repeating, creating scope for countertrend longs.
If the price fails to close below 8750 today, longs could be considered above the level with a stop below for protection. Preference would be for entry to be closer to 8750 than where the price currently trades. Initial targets would be 8830, followed by the intersection of former uptrend support and the 50-day moving average at 8914.
Conversely, if the price closes below 8750, shorts could be initiated or added beneath the level with a stop above, targeting support at 8600.
To be clear, RSI (14) and MACD are both firmly bearish, consistent with building downside pressure that favours short setups. But that message must be treated with caution given the relentless dip-buying seen in recent months.
Good luck!
DS
Bitcoin shortBtc forming a clear divergence on the weekly rsi.
Ususally indicates a down turn. Closes below the 50 week ma at 102,500 historically confirm beginning if bear

ETHFI – Potential Rebound from Major Support ZoneETHFI is currently testing a critical support zone between $0.60 and $0.80, a level that previously held strong during market corrections. Price structure appears to be respecting this level, and the RSI is nearing oversold territory, hinting at a possible momentum shift. This combination sets the stage for a potential bounce if current conditions hold.
🔹 Trade Idea Setup
📌 Entry Zone: $0.60 – $0.80
🎯 Take Profit Targets:
• TP1: $1.90
• TP2: $2.90
🛑 Stop Loss: $0.18
This setup presents a favorable risk-reward ratio, with entry at support and clearly defined targets. RSI signals are adding confluence, but always watch for volume confirmation and broader market behavior.
