Overbought & OversoldIf you can identify overbought or oversold conditions, as a trader, this can be highly profitable. In particular, these are two definitions that refer to the extreme values of the price in addition to their intrinsic value. So, when these conditions appear, a reversal of the direction of the price is highly expected.
What is Overbought?
When something is ‘overbought’, it means that the price is thriving for a long peri. Because of this, it’s trading at a higher price than it actually should be. In other words, the asset is overly expensive and a sell-off is about to happen.
What is Oversold?
When something is ‘oversold’, it means the price is in a negative momentum for an extended period. Because of this, it’s trading at a lower price than it actually should be. In other words, the asset is overly cheap and an upward rise is about to happen.
Indicators
Moreover, there’re plenty of technical indicators which you could use in technical analysis. To confirm the Overbought and Oversold conditions the three indicators commonly used are:
Bollinger Bands,
Relative Strength Index and
Stochastics
Bollinger Bands
The Bollinger Bands appear as a channel. Specifically, the middle line is often a twenty-period moving average. On the other hand, the upper band is the moving average plus two times its standard deviation. Furthermore, the lower band is the moving average minus two times its standard deviation. As a result, the price seems to fluctuate in this channel and normally doesn’t move out of the bands. However, when the price tends to move out of the upper band the price can be considered as overbought. Likewise, the same thing happens when the price moves out of the lower band, the price can be considered oversold.
Relative Strength Index
The Relative Strength Index is a momentum oscillator where the horizontal axis appears as a function of time and the vertical axis as on a scale of 0 to 100. In addition, the standard amount of periods used for this indicator is 14.
So, the Relative Strength Index measures the magnitude and the speed of recent price action. The indicator compares a security strength on days when prices go up to its strength on days when prices go down. Yet when the Relative Strength Index has a value higher than 70 the price can be considered as overbought. When the opposite happens and the price drops down a value of 30 the price can be considered as oversold.
Stochastics
Stochastics is like the Relative Strength Index, a momentum oscillator where the horizontal axis appears as a function of time and the vertical axis is displayed on a scale of 0 to 100. However, the stochastic oscillator is predicated on the assumption that closing prices should move in the same direction as the current trend.
Meanwhile, the Relative Strength Index is measuring the magnitude and the speed of the current price action. The Stochastic oscillator does calculate this value and expresses this value into a %K.
In addition, the standard amount of periods used for this indicator is 14. When the %K crosses a value of 80 the price can be considered as overbought. When the opposite happens and the price drops down a value of 20 the price can be considered as oversold.
Combined
One indicator that matches the criteria for being ‘overbought’ or ‘oversold’ can suggest a small trend reversal. But once all 3 indicators combined are matching the criteria, the assumption of a trend reversal is very likely to happen. Therefore, for trading in general this can be a profitable and low-risk strategy.
Overbought

Bitcoin Retest Incoming At $17,500.....Nice hourly pump we have today. Looking for Bitcoin to retest the $17,500 levels or come down $200- $300 once the hourly wave looses momentum. We've peaked on all of the major oscillator indicators (RSI, Stochastic RSI, and MACD).
Much peace, love, health, and wealth!

DASHUSD - Descending Broadening Wedge On the Dash chart, a descending broadening wedge has appeared (1h-timeframe).
A descending broadening wedge is a bullish reversal pattern. The trade can be entered once the price breaks out of the pattern to the upside. The target is the height of point B.
At the moment the price is overbought when looking at the RSI. In our opinion, the price is going to drop a little bit. After that, it could be possible that the price is going to break out straight away or it might retest. This is the reason why there're two paths drawn on the chart.
See all further details on the chart.
Goodluck!

DASHUSD - Short - Retrace possibleOn the chart we can see the price is currently overbought. The three indicators are suggesting the price is in overbought condition and is likely to go down.
This is a short-term setup and the profits could be taken at the target. The three indicators used are Bollinger Bands, RSI and Stochastic.
See all further details on the chart.
Goodluck!

BTC Bearish Ascending Broadening wedge on the 15I am tracking this Bearish ascending brooding wedge. Also when we zoom in to the top of the wedge on the 1 hr we can see a bullish inside bar indicating a reversal to the downside Looking for a short back down to the 15,950 range

LTCUSD - Short - Small drop comingOn the chart we can see the price is currently overbought. As we can see all the three indicators are suggesting the overbought condition. So this can be a short-term oppurtunity to get some profit if this plays out.
The indicators used are Bollinger Bands, RSI, Stochastic.
See all the details on the chart.
Goodluck!

EXTREMELY OVERBOUGHT ON LTC !!!!!!! Hello, everybody! If you like the concept, don't forget to like and follow it.
Ltc reached its limit in the ascending channel as it continued to rise.I anticipate a significant asset price decline once the price reaches the channel as the RSI and BB both indicate extremely overbought conditions (1H and 30m TFs).
If you like my ideas, please like them and follow them.
Also, let us know what you think in the comment section.

FOMO Fear of loosing out.Moved my stop loss and you may say I did it too soon however we all know price sometimes is unpredictable.
Instead of bigger profits, I end up with smaller ones. Well, we don't dwell in the past.
Let's move on and think about another profitable setup.

NIFTY50 SMALL CORRECTION AHEAD!!US recession over(analysis in link section).
MANY FII BUYING AND DII SELLING ARE COMING IN THE MARKET!!
In previous days, markets where net rising only, but still we could see a lot of selling, from DII side. many FII are steping in. and due to gap ups, the markets are closing in positives.
we could see the M AND W pattern are completed, anf there could now be a small correction since, RSI indicator is also in overbought zone.
paths are drawn, and then we could again see a rise in markets during end week of this month.
if you want to take some new positions in market, do wait for the market to go a little below, then start entering in the markets.

NZD-CAD Resistance Ahead! Sell!
Hello,Traders!
NZD-CAD has been going up
For a long time now and I think
That the pair is somewhat overbought
So after the retest of the horizontal
Resistance level we are likely to see
A local move down
Sell!
Like, comment and subscribe to boost your trading!
See other ideas below too!

EUR-USD Bearish Correction! Sell!
Hello,Traders!
EUR-USD shot up suddenly
By almost 2.5% which is a massive move
For such a major currency pair
So I think that EUR-USD is currently
Locally overbought and so
A bearish correction from the
Horizontal resistance above
Is quite likely
Sell!
Like, comment and subscribe to boost your trading!
See other ideas below too!

USDJPY - Over-Bought Zone!Hello TradingView Family / Fellow Traders. This is Richard, as known as theSignalyst.
USDJPY is overall bullish from a long-term perspective trading inside the brown channel. However it is approaching the upper brown trendline acting as an over-bought zone.
Moreover, the zone 147 - 150 is a strong supply zone .
So the highlighted purple circle is a strong area to look for sell setups as it is the intersection of the green supply zone and upper brown trendline. (acting as non-horizontal resistance)
As per my trading style:
Since USDJPY is around the purple circle zone, I will be looking for bearish reversal setups (like a double top pattern, trendline break , and so on...)
Always follow your trading plan regarding entry, risk management, and trade management.
Good luck!
All Strategies Are Good; If Managed Properly!
~Rich

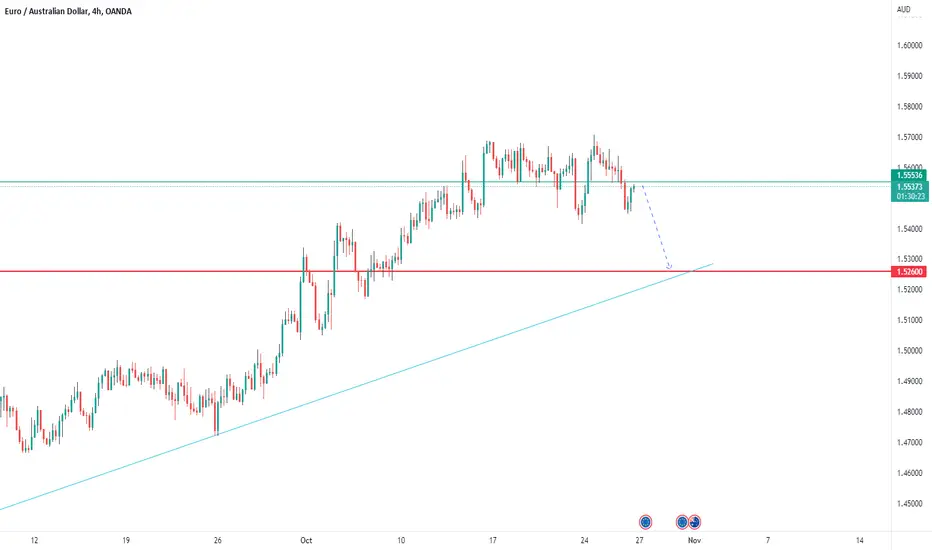
EURAUD Takes A BreatherEurAud has been on a steady bull run and now takes a breather thus experiencing sideways trading.
We can expect a drop towards the trendline .
Risk for Stocks increasing again $VIX $DJI
$VIX in middle of range, normal for now
RSI RARELY oversold
Maybe 1x per year & we're @ lower end
$DJI Comparison to last peak
In overbought territory
"2.5% upside" - ??? downside
Reducing longs
Our LARGEST position $TWTR = cash now
As we go higher raising more cash again

LTCUSDT - Short Position - OverboughtLTCUSDT is currently in an oversold condition. It´s likely for the price to go down.
The bollinger bands, RSI and stochastic they tell us the price will go down soon. The price is approaching a previous resistance. So wait for the price to retest this resistance if it does the resistance line becomes your entry point.
Further details are shown on the chart.
Goodluck!

DXY - Over-Bought Zone! Hello TradingView Family / Fellow Traders. This is Richard, as known as theSignalyst.
DXY has been overall bullish for a while trading inside the brown rising channel . However, it is currently approaching the upper bound / upper brown trendline, which I consider a non-horizontal resistance and over-bought zone.
Moreover, the zone 113 - 114 is a horizontal resistance zone .
So the highlighted purple circle is a strong area to look for sell setups as it is the intersection of the blue resistance zone and upper brown trendline. (acting as non-horizontal resistance)
As per my trading style:
Since DXY is sitting inside the purple zone, I will be looking for bearish reversal setups (like a double top pattern, trendline break , and so on...)
Always follow your trading plan regarding entry, risk management, and trade management.
Good luck!
All Strategies Are Good; If Managed Properly!
~Rich

0.33 / 0.34Bearish divergence on weekly, weekly stochastic rolling over, please zoom out. We will bottom at 0.33,

TWITTER - Short position - Overbought at the resistanceLooking at Twitter the chart shows that it´s overbought and is likely to go down.
Following the Bollinger Bands we see the price has touched and moved out of the upper band. Following the RSI 14 we see that the RSI went above 70. So both indicators are indicating a move to the downside.
According to the earning announcement we expect it will be towards the downside as well.
Targets and further details are shown in the chart.
Good luck!

DXY WAITING FOR DOWNWARD CORRECTIONDxy is currently in a strong uptrend and we will need a valid reason to go short. 111.9284 is a valid level of support which when broken we may see a downward correction till at least point X: 107.9379 which served as a level of support for the most recent rally.

GOLD Bearish Bias! Sell!
Hello,Traders!
GOLD has retested a horizontal
Resistance level and as Gold
Seems to be locally overbought
I think that we might see
A local pullback and a retest
Of the target below
Sell!
Like, comment and subscribe to boost your trading!
See other ideas below too!

Updating this very old US10YThe bond bull is over and the new path to rising rates. It looks like we have reached the resistance of the red box , there is a chance we do an over shoot like we did at the bottom and then reverse to the green box ( which will be adjusted is the if we over shoot). Then we keep rising in a wave like manner.

✅USD_CAD OVERBOUGHT|SHORT🔥
✅USD_CAD will be retesting a resistance level soon
From where I am expecting a bearish reaction
With the price going down but we need
To wait for a reversal pattern to form
Before entering the trade, so that we
Get a higher success probability of the trade
SHORT🔥
✅Like and subscribe to never miss a new idea!✅

USDJPY - Video Top-Down Analysis!Hello TradingView Family / Fellow Traders. This is Richard, as known as theSignalyst.
Here is a detailed update top-down analysis for USDJPY .
Which scenario do you think is more likely to happen? and Why?
Always follow your trading plan regarding entry, risk management, and trade management.
Good Luck!.
All Strategies Are Good; If Managed Properly!
~Rich
