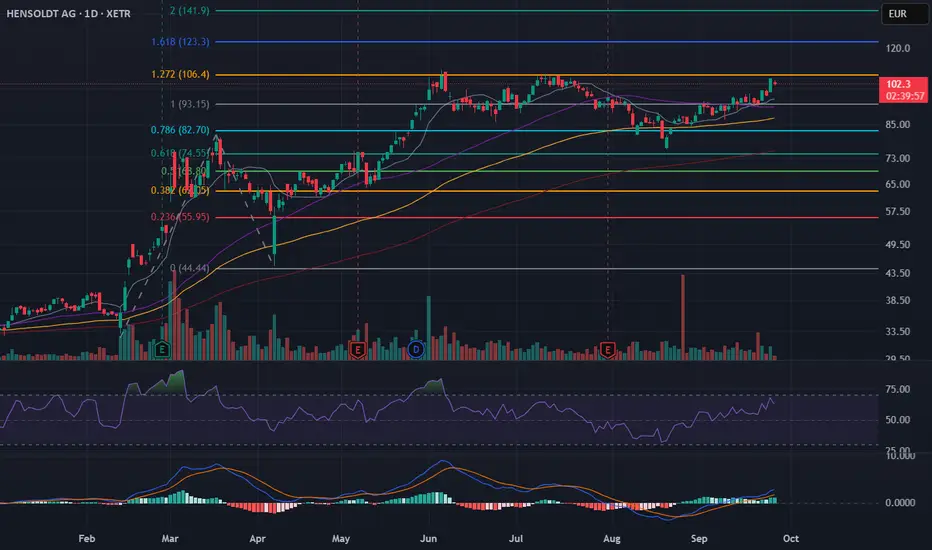
Hensoldt (HAG) - Overly optimistic? [Bear Case]Business model: Hensoldt is a German defence-electronics pure-play: ground/air radars, optronics/periscopes, electronic warfare. Their order book and revenue backlog is benefiting from Europe’s continuing rearmament.
Why pricing looks rich: At ~€100+/share, the market appears to discount flawless conversion of the rearmament wave into sales and cash, sustained high-teens margins, and minimal programme/approval risk well beyond 2030. My GAAP-based DCF (9% discount, –1% terminal) values equity ≈ €20/share (DCF model snapshot), far below the market.
Trading multiples at today’s price (as of Sep ’25):
- EV/Rev: ~5× FY25.
- EV/E (GAAP): ~116× FY25, ~85× FY26, ~72× FY27
- Compared to other defence companies, these current and future multiples are far above the average, requiring much greater growth in income, which seems unlikely.
For today’s price to be ‘fair’, the market is effectively assuming:
- Hensoldt’s 2030 revenue guidance is exceeded and margins significantly improve from current levels.
- Contract wins versus close competitors in various revenue drivers, for example vs. Thales/Saab on large NATO sensor programmes (not just German programs).
Technicals:
The stock is approaching a recent all-time high, also corresponding with a Fib level as resistance, but with fading momentum, future defence spending globally already priced in, entering a short at €104.
P-value
Deere and Company is a stapleIt looks like a good time to buy Deere shares, I have done an evaluation on the perceived intrinsic value of the company. To back up my philosophy about what I think a "good deal" on the shares is, I have included a technical analysis including a trendline being touched for the third time at a measured Fibonacci retracement.
Looking ahead five years, based on the revenues the company is expected to generate according to wall streets current estimates. I have used the discount cash flow model to determine what I believe a suitable margin of safety would be to buy and hold shares of Deere. I am taking into account, the time value of the investment by measuring 5 years ahead, the risk to me at this point is very low. $570 seems to be a fair price taking into account all the fundamentals, I have been holding the stock for some time, but am increasing my exposure to 5% allocation in my portfolio.
Naturally I like the stock because I have worked around these machines a lot in my life. So I have a good understanding of how the company will make money and why the company will make money. The current price of a share is $461, while the intrinsic value according to my model is $570, essentially that means the shares are about %25 undervalued right now. I would personally rate Deere a buy despite the short term headwinds the company faces, we need them.

GBP.USDA very hard hit 2 day rally on the dollar. Lets unpack a few things about the recent data outlook.
Good news across the board - the market that was once "priced-in" isn't anymore after the UKs fiscal stance on the public sectors borrowing making price swing from the latest US rate cuts up until now amounting to around 400 points. Reactive or not ? Have we collectively stopped questioning the feds credibility ? Or are we finding a balance because the UK doesn't look so attractive than 2 weeks ago ?
Recent data points from the UK has lead me to believe that the economy is slowing. The economy slowing around the busiest period of the year ? This stance already makes you question. Although there is a more "natural" stance on the UK in accordance to their preliminary data outputs in relation to GDP, my next question is what happened in Q2 ? Q2s data outputs of GDP from the US was expected to beat its consensus, but we need to drift back into the question of "is this natural?" - the answer is no, the market reacting to a Q2 data input I think is efficiently acceptable but not a justifiable way to take advantage of the same way monetary policy in the UK is hawkish. This is because of the headline risk traders where afraid of - tariffs - the activity in Q2 was huge, thus, inflating the report we have had today.
We've been at this price before but this time its a 1.35 target. The euro is a sound investment against the dollar whilst the pound follows. I am in positions across the board ranging from 1.345 up until now, I am potentially taking advantage of how the market has been very reactionary based off singular data inputs that do not focus on the end of year narrative & the effects from this year. Given the path of rates, we are expected to keep cutting up through next year in the US, inflationary pressures add on which today those "good" data input were heavily emphasized in the price because it is "good". But the school of thought is that a positive or negative reading should not automatically make an input from a perspective of bullish or bearish. There are questions, theories that neglect data outputs. Why do you think there are times news reacts badly to good news which doesn't align with the nominal belief that it is good ?
In a sense we can try and capture all angles, but in this short summary I have captured a few that fuels the belief in a target as such. The markets swing high to now swing low is somewhat exaggerated giving no escape to those who are hedged or locked in. There is a release going to happen and it may be as vicious as the one today but on the upside. Unless there is breaking news the fed will pivot from their projections or if there is some external headline event moving the dollar, what you are witnessing now is a pure TA play powered by aggressive buyers trying to close the gap. While the UK remain neutral on rates, they have also considered shrinking their borrowing, giving a blow onto their QE program which that so called program was reactionary when Powell mentioned it.

TANKTOBER!SPY eyeing a break below 6600—shutdown looms, Powell’s silence speaks volumes. Holding shorts, rolling puts into November 655s if we gap. #SharpShooterStocks #Trading #SPY #Shutdown2025
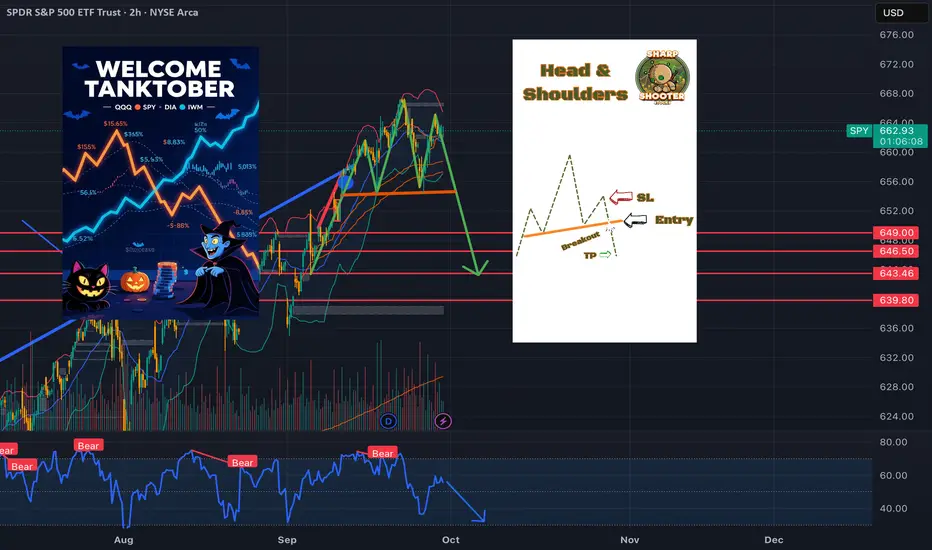
TANKTOBER!SPY eyeing a break below 6600—shutdown looms, Powell’s silence speaks volumes. Holding shorts, rolling puts into November 655s if we gap. #SharpShooterStocks #Trading #SPY #Shutdown2025

Aster vs Hyperliquid – Value BreakdownWas just taking a closer look at GETTEX:HYPE vs $ASTER. Both projects are moving fast, but the fundamentals tell two very different stories.
Hyperliquid ( GETTEX:HYPE ):
Fully Diluted Valuation (FDV): $46.7B
Annualized Fees: $1.1B
30D Perp Volume: $300B
Volume = ~2% of the entire stablecoin market
Valuation multiple: 42.5x fees
Aster ($ASTER):
Fully Diluted Valuation (FDV): $16.5B
Annualized Fees: $110M
30D Perp Volume: $27.7B
Valuation multiple: 150x fees
Takeaway:
While $ASTER has seen explosive early performance, the fee-to-FDV ratio is stretched. Meanwhile, GETTEX:HYPE is already generating serious fee revenue and market share, making it fundamentally a stronger value proposition even at current levels.

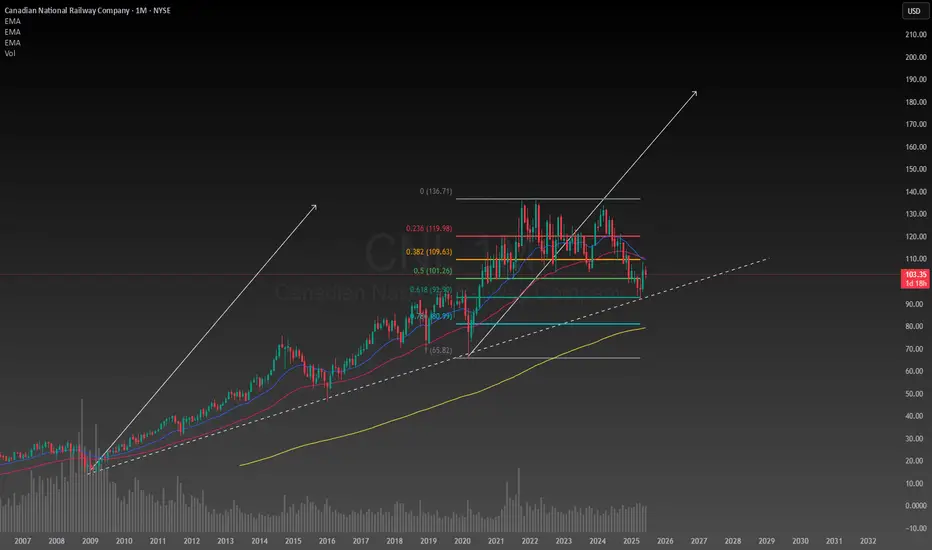
Canadian National Railway has huge upside potentialA decades old trendline still unbroken after months of correction, the Canadian economy seems to be in a great position considering the circumstances. After conducting a simple technical analysis predicting a second leg up the upside potential is enormous if I am right about this. The downside is I am looking at a monthly chart so this will need to be a position trade or long term investment to achieve the desired results. Even if my target is reached I will likely hold onto the stock for years afterwards because the company will continue to make money. The intrinsic value for CNI is between $120 and $225 so it is well below the intrinsic value making any new position on it now at a bargain deal. I will likely be allocating a significant portion of my portfolio to it in the next few days to weeks.
iQIYI: bet on recovery or just another illusion?Fundamentally, iQIYI is often called the “Netflix of China.” In recent years, it has faced heavy pressure from high debt levels, fierce competition from Tencent Video and Bilibili, and slower growth in the Chinese domestic market. However, recent earnings reports show positive shifts: a growing subscriber base, higher ARPU (average revenue per user), and reduced operating losses. With government support for the tech and entertainment sector and signs of consumer recovery, iQIYI has a real chance to strengthen in the mid to long term. If subscriber growth and cost control continue, the company’s market cap could start to recover, making current levels attractive for medium-term investors.
Technically, the stock still trades below the 200 EMA, showing ongoing seller pressure. The key support zone is $2.30–2.40, and holding this area keeps the bullish scenario alive with targets at $3.40 and $5.25. A longer-term recovery could extend toward $10.40, but only if a sustainable uptrend is confirmed. Losing $2.30 would invalidate the bullish case and expose downside toward $1.60–1.80.
This is one of those situations where market expectations diverge from reality. Optimism makes a reversal seem near, but as always, emotions must be put aside — we wait for clear technical signals before entering.

support on the curveBitcoin has potential support on the curve, where the price is currently at 108333.
In my opinion, it will reach at least the
cup and handle target on the weekly chart by the end of the year. I don't expect it to go over 150k this year, and I don't really believe in 140k+ either.
The peak will probably come by mid-October. This doesn't necessarily mean a peak for altcoins, at least not for all of them.
Cryptocurrencies can also fall due to the fall in stocks, which are now very overvalued compared to the real economy, see Buffett indicator.
Now on Thursday and Friday, important economic news will come, so we can expect at least a minor drop.
If the drop does not occur for this reason, it may be due to the US attack on Afghanistan. Be careful.

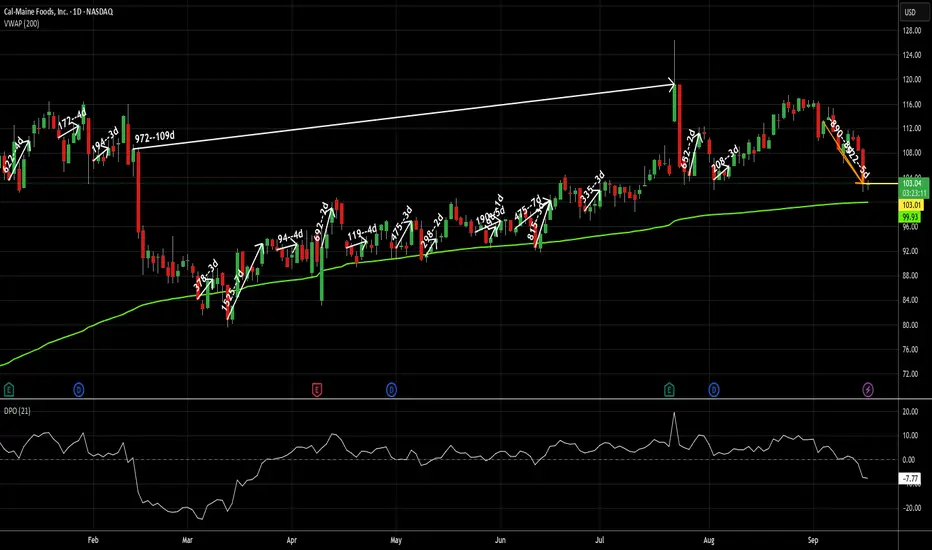
Oxymoronically pounding the table here for CALMThere are a lot of reasons I like the trade I entered into yesterday at the close here. I'll start with some reasons I'd like CALM regardless of my trading style.
I think everyone can agree we are in an overvalued market right now. That inherently creates risk with any stock you buy right now. Not saying we are gonna go down, but the more overvalued the market gets, the greater the risk that creates. CALM has several things going for it in that regard.
1--it has a TTM P/E of 4.12. Not 41.2 - FOUR!!! This is good even for a value stock.
2--their current yield is 8.11%. Give your head a second to wrap itself around that one - this stock has a yield that is twice its P/E. To put that in perspective, NVDA has a P/E of 50. If its yield were 2x its P/E, it would be paying a 100% dividend. This is not really an anomaly, either. It has always been a high dividend stock.
3--in the event inflation picks up again, foods are an area where costs can be passed through to customers better than in other areas. Eggs will still be eaten, even if they cost more. We've already proven that once. People will complain, but they still buy them.
Now for the part that really intrigued me here. 18-2 on trade signals in 2025 with an average gain of 3.5% and an average holding period of 9 days (including that 109 day marathon). That includes the two losing trades recently, and works out to a gain of .39% per day held. Note: trade returns on the chart are basis points (.01% per bp)
Those are beyond tech stock level daily returns on a stock that has been flat overall on the year, that sells something Americans bought 108 BILLION of last year (while griping about prices) that has a low P/E and if the trade goes sideways, pays me 2% a quarter to hold onto. That's .03% per day just to hold it, not including any gain on the trade itself. The average historical daily gain of SPY is around .04%, for comparison.
Why is this stock not being talked about? I don't know and I don't care, but I went long at yesterday's close at 103.01 and it's trading just below that as I put the finishing touches on this post.
As always - this is intended as "edutainment" and my perspective on what I am or would be doing, not a recommendation for you to buy or sell. Act accordingly and invest at your own risk. DYOR and only make investments that make good financial sense for you in your current situation.
Constellation Brands | STZ | Long at $134.50Constellation Brands NYSE:STZ
Technical Analysis:
Currently trading just below my "crash" simple moving average area. This area is often a bottom, even if temporary (sometimes there is a continuous stairstep down, though). There is a high probability the stock could drop down to the "major crash" zone ($120 and below) in the near-term, but all price gaps on the daily chart since 2020 that were open below the current price are now closed (bullish).
Earnings and Revenue Growth
Projected earnings increase from 2025 ($11.6 billion) to 2028 ($15.4 billion): +38.2%
Projected revenue increased from 2025 ($9.1 billion) to 2028 ($9.8 billion): +8.3%
www.tradingview.com
Health
Debt-to-Equity: 1.6x (high)
Altman's Z-Score/Bankruptcy Risk: 3.1 (excellent/very low risk)
Insiders
Warning: Selling outweighs buying.
openinsider.com
Action
Constellation Brands hold a number of major names in the alcohol industry. While sales have slumped and revenue growth is weak, it's a solid company paying a +3% dividend. I do not expect this to skyrocket any time soon, so those into overnight returns may want to pass. The decision to enter is primarily based on technical analysis and name-brand recognition. I am also going to keep my target low for a swing trade due to the unknown economic times ahead.
Targets in 2028
$158.00 (+17.5%)
$178.00 (+32.3%)

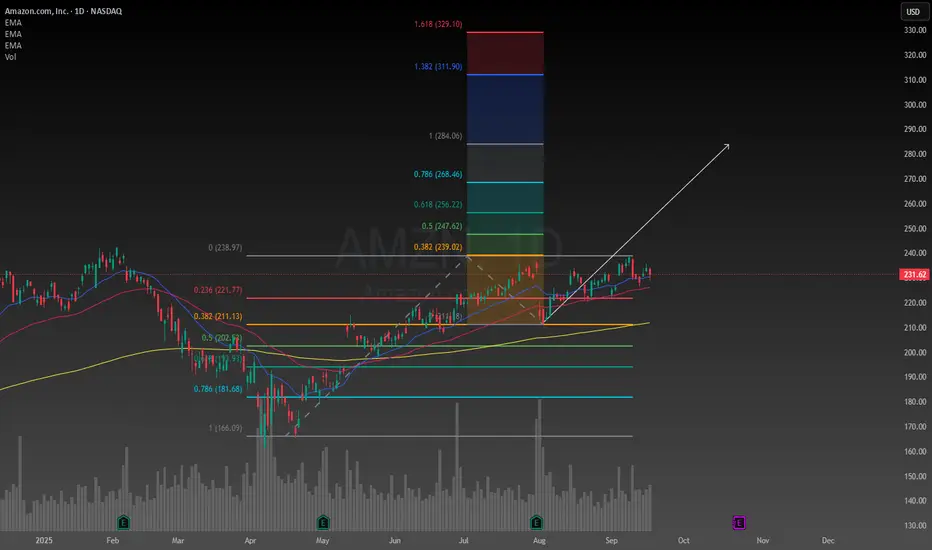
Using Amazon as an example to write about intrinsic valueThe beautiful thing about equities, is that we can determine what the stock should be worth based on the future cash flows the company generates. It is called intrinsic value and professional investors often use this calculation to help them make higher quality decisions. The primary method of calculation is called discount cash flow. When building a DCF model is is recommended to use Wall Streets estimates to keep an unbiased opinion.
Understanding the concept of discount cash flow, is like understanding the calculations behind any technical indicator, the thing about intrinsic value is that it is a fundamental indication not just technical. Equities go up, because companies are generating cash flows. Unlike commodities, which are only valued based on the general consensus of voters.
It was Benjamin Graham the father of value investing who said, in the short term the market is a voting machine, but in the long term the market is a weighing machine. There is a fantastic book I read called The Intelligent Investor written by Benjamin Graham I highly recommend giving it a read if your serious about making money in the market over the long term.
Intrinsic value is the fundamental, true worth of an asset or business, as determined by an objective analysis of its financial performance and future cash flow potential. It is a crucial concept for investors, especially value investors, who use it to identify assets that are undervalued or overvalued by the market.
Focusing on fundamentals helps investors avoid overpaying for assets and reduces the risk of permanent capital loss. If a stock's market price is significantly lower than its calculated intrinsic value, it may be undervalued and a good buying opportunity. The difference is often called a "margin of safety". Intrinsic value is based on an asset's long-term potential, encouraging a focus on sustainable growth and stability rather than short-term market noise.
Now onto Amazon stock, according to my model the intrinsic value of Amazon is as of this writing $260 meaning that fundamentally it is still undervalued. Take this with a grain of salt because if you create a model using the discount cash flows of the company over the next 5 or 10 years you might get wildly different results. This is why it is essential to understand the calculation for yourself instead of just taking my word for it. This is a highly speculative calculation, it can also become relatively complicated.
Lets compare two individuals performance over the course of their career, I would like to write about Dr. Al Brooks, often referred to as the king of price action by CME group, and Warren Buffett, one of the most successful investors and richest men in the world. Al Brooks, the day traders net worth is about $750 million dollars over the course of his career in the market. Warren Buffett has a net worth of about $150 billion dollars. One is a trader, the other an investor. So where am I going with this?
Everyone wants to get rich quick, everyone starts thinking they will be a trader. 90% of traders permanently lose their capital never to make it back and often times quitting participating in the market. The 10% of traders who are actually profitable, aren't making as much money as you would think, as per the comparison above. The average investor over the course of their lifetime will make 150x more money than the best traders. For me, I fell into the 90% category, trading didn't work for me, after reading The Intelligent Investor, the money starting coming into my account almost effortlessly.
Dear reader, this article was written by me for my own entertainment. Please do not take anything I have written too literally, always do what works best for you and always remember, whatever your doing, you should be having fun. Cheers
FOMC has cleared liquidity levels around this technical rangeNews Drivers do not overpower technicals, the fundamentally driven movements are just banging around into huge money pending orders. No way around these mechanics.
That what we saw today, and what will continue to happen forever and ever 💎 Not saying it will always be a ricochet like today, but the orders are always there.

Valuating Coinbase based on the intrinsic valueAfter revising my discount cash flow model for Coinbase I have concluded the intrinsic value for the stock approximately $310 based on my model. I am a few days late with my analysis but it seems like the market has also come up with a similar number based on the technical analysis of the daily chart. I have began accumulating the stock once again. With a target of $575.

PTON Squeeze 2.0?Its Christmas Eve today, and Santa Powell is likely voting today to lower rates. By how much? Depends on the proportion of slurs / message in your favorite discord serve, but I'm leaning towards the standardized view of 0.25. If we get anything above, or below for that matter, expect to have your hair blown back.
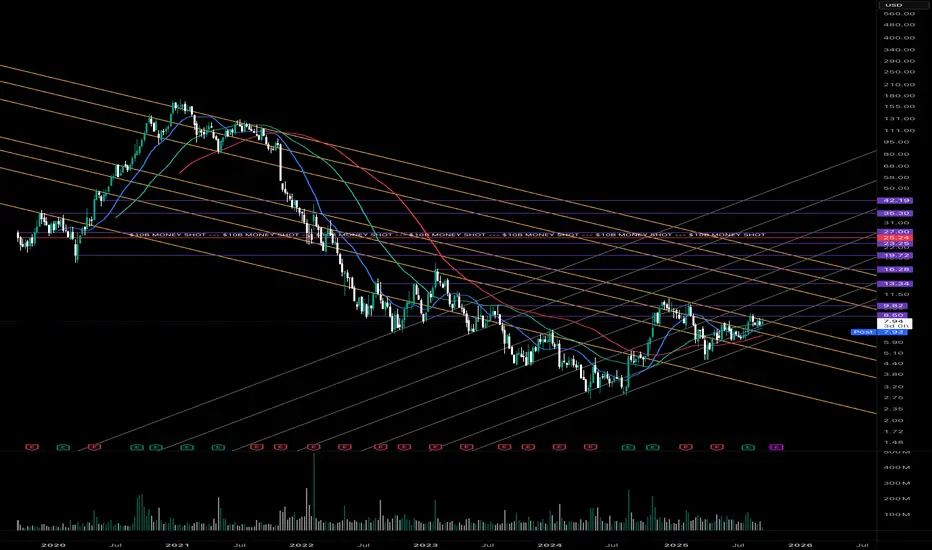
That being said, PTON was an overpriced COVID darling running off of hot air fueled by everyone pretending an exercise bike with an iPad screen wasn't going to become a clothing rack. As of today, it has a short interest of 18%, price to sales of around 1, and a demolished market cap relative to 2020/2021.
I see PTON pushing out of this gutter and back to a $10B valuation with haste. They're working on profitability and the metrics i've mentioned look solid.
Listen, If i know anything right now its that we're about to see the most intense two quarters in recent memory. I do wish you well in this phase because it may very well be the end of the road for this bubble. But what do I know.
ETF VAL30IETF LongBreaking the resistance level, Expect a short term long position based on RSI levels going strong on daily and weekly time frame. Also trading above 200 moving average.
🟢 Long

Flowers Food | FLO | Long at $13.51Flowers Food NYSE:FLO . Maker of Nature’s Own (the top-selling bread brand in the US), Wonder Bread, Tastykake, and many others, has entered my "crash" simple moving average zone. While the fall has been steep since 2022, the company is trading at a price-to-earnings of 13x (typical food industry is around 20x) and offers and 7%+ dividend. It's not a play for future growth, however, which is expected to be mild to stagnant ( based on forward annual earnings and revenue . This position is a value / dividend play given the high likelihood of lower interest rates and a certain group of investors moving out of banks and into dividend / income stocks.
So, while I wouldn't be shocked if NYSE:FLO dips into the $12 rage in the near-term, I have created a starter position in the company at $13.51. My targets are modest, although there is a blaring gap in the $27-$28 range that will likely be filled... some time.
Targets into 2028:
$14.75 (+9.2%)
$16.25 (+20.3%)

Starconics: Top 11 Crypto Presales for Trading in September 2025In the fast-evolving crypto landscape of September 2025, presales offer early entry points for savvy traders seeking high-reward opportunities. With the market consolidating after a summer surge—Bitcoin holding steady above $115K and altcoins rotating—new projects blending meme culture, DeFi utility, and innovative tokenomics are drawing sharp interest. From Starconics Investment Group, a premier analytics firm specializing in on-chain metrics and AI-driven signals, we dissect 11 standout presales. Our analysis focuses on tokenomics for sustainability, RSI for momentum, and on-chain signals for whale activity and holder growth. Selected based on funding traction, community buzz, and roadmap viability, these include MoonBull, Bonk-inspired variants, Gigachad, and emerging gems like Bitcoin Hyper and BullZilla. Data as of September 16, 2025—ideal for early positioning before Q4 rallies.
Starconics equips traders with real-time dashboards for on-chain tracking; sign up for our demo to spot these edges first.
1. MoonBull ($MOBU) — Ethereum Meme Powerhouse
MoonBull's presale emphasizes deflationary mechanics and whitelist exclusivity, raising over $370K in Stage 1. Tokenomics: Total supply capped at 1B tokens; 30% presale allocation with 10% weekly burns post-launch, 20% staking rewards (66–80% APY), 15% liquidity lock. RSI at 52 signals neutral momentum post-dip, avoiding oversold territory. On-chain: 50K+ whitelist apps in 24 hours, whale accumulation up 15%; Ethereum integration boosts DeFi TVL potential to $10M early.
2. Bonk ( SEED_DONKEYDAN_MARKET_CAP:BONK ) — Solana Meme Revival
Bonk's ongoing "presale-like" airdrop extensions fuel community burns, with $1.86B market cap but fresh utility pushes. Tokenomics: 81T supply, 50% community airdrops, 1T burn milestone for holders nearing 1M; 20% DeFi incentives. RSI at 55 (rising from 40) indicates bullish recovery. On-chain: Holder count +5% weekly, Solana TPS spikes 20% on BONK trades; $5M inflows signal meme resurgence.
3. Gigachad ( BME:GIGA ) — Solana Fitness Meme
Gigachad's CTO revival post-2024 positions it for 2025 listings, with FDV at BTC 1,013. Tokenomics: 10B max supply, 40% presale/community, 25% NFT staking (gamified rewards), 10% burns on milestones. RSI at 39 flags oversold bounce potential. On-chain: 81% "GIGA meter" filled for launchpad integration; whale buys +10%, volume up 3.57% amid fitness NFT hype.
4. Bitcoin Hyper ($HYPER) — BTC L2 Pioneer
Bitcoin Hyper leads L2 presales, raising $15.26M for scalable BTC apps. Tokenomics: 1B supply, 50% presale, 20% ecosystem (cross-chain bridges), deflationary burns on transactions. RSI neutral at 50, MACD bullish crossover. On-chain: 1,300+ holders, $14.6M inflows; Bitcoin settlement layer shows 70% holder retention.
5. BullZilla ($BZIL) — Meme with Burns
BullZilla's Stage 2D presale hit $370K, blending narrative with Roar Burn tech. Tokenomics: Dynamic pricing (+10% Sundays), 50% presale, 30% burns on milestones, 20% staking. RSI at 55, neutral-bullish. On-chain: 1,300 holders, netflows -70% but scarcity drives +20% whale interest.
6. Maxi Doge ( NASDAQ:MAXI ) — Doge Evolution
Maxi Doge leverages DOGE appeal with tech upgrades, presale at $0.00001. Tokenomics: 100B supply, 40% presale, 25% liquidity, meme-tech hybrid rewards. RSI 52, balanced post-dip. On-chain: Community growth 15%, Solana integrations boost TPS signals.
7. PEPENODE ($PEPENODE) — Mine-to-Earn Meme
PEPENOD's gamified mining presale offers 4,000% APY staking. Tokenomics: Deflationary (70% burn on upgrades), 30% presale, referral 2%. RSI rising to 55. On-chain: Node sales +20%, leaderboard activity spikes holder engagement.
8. Wall Street Pepe ($WEPE) — Multi-Chain Meme
WEPE's $73M presale ends with Solana burn mechanics. Tokenomics: 200B cap, burns on migrations, 30% staking. RSI 50, neutral. On-chain: Dual-chain TVL $15M, 659M tokens sold.
9. Tapzi ($TAPZI) — Skill-to-Earn Gaming
Tapzi's BNB presale focuses on PvP rewards, raising $1M+. Tokenomics: 20% presale (3-month vesting), 70% burns on upgrades. RSI 52. On-chain: 10K+ users, cross-chain volume +25%.
10. Remittix ( NYSE:RTX ) — PayFi Utility
Remittix's $25.3M presale targets remittances. Tokenomics: 659M sold at $0.108, daily USDT rewards, Visa integration. RSI neutral 50. On-chain: Beta wallet launch drives 10K daily users.
11. Best Wallet ( BMFBOVESPA:BEST ) — Web3 Super App
Best Wallet's presale integrates DEX and debit cards. Tokenomics: No private sale, 50% community, multi-chain support. RSI 55, bullish divergence. On-chain: 500K+ users, presale portal activity +30%.
Conclusion: Early Entry with Starconics
September 2025's presales like MoonBull and Bitcoin Hyper shine with robust tokenomics and on-chain momentum, poised for 10x–100x gains amid BTC stability. Starconics' AI spots RSI bounces and whale signals—71% bullish sentiment overall. Diversify early, but DYOR on audits.
Ready for alpha? Join Starconics Investment Group for on-chain alerts. Which presale excites you? Comment below!
#CryptoPresales #NewTokens #Tokenomics #Starconics #September2025
NEW ATHCleaning solution company gone treasury. 29% revenue YOY for 2M nothing crazy 50M marketcap. Now they are holding/buying $150M of $DOGE. Zone is bouncing off its golden zone while DUS:DOGE is getting a +3% move headed back to the .30 area. Doge ETF launch tm I've seen CRYPTOCAP:BTC and CRYPTOCAP:ETH drop after ETF launches so not fully confident that doge will rise. Also have CPI data tm at 8:30 AM so if markets like it zone could get a big move. Either way pretty risky if it loses $3.50 its headed to $2.

Grab - Inverse H&S + Weekly LevelsUnusually high volume on this name lately.
I've been watching this name since it was in the $4-5 range and believe it will be a $10 stock in the near future.
The wider market may be just beginning to notice the opportunity here.
Personally, I've been in $5 2027 leaps and will be seeing where the stock takes me.
For now, my immediate target is $7(see inverse head and shoulders).
Additionally, with the heightened options volume, this could become a great name to trade intraday.

Yes the chicken man - PPC Short?PPC is at the bottom of a monthly box and at VAL of the daily and weekly anchored volume profile. It could catch a bid here and retest $45.60s(VPOC).
If the retest ends in a rejection of that area, and a daily close below the previous low around $41.95 then I expect short continuation and validation of the H&S.
I would especially like this trade after a retest and rejection of box bottom around $43.41 - $43.30.
My targets would be 40.11, 38.98, 37.27,35.96 then 33.72.

Long Coffee📌 Coffee Futures: Seasonality, Market Drivers & Trading Insights
Coffee is one of the most important soft commodities in the world, consumed daily by billions of people. Traded for centuries, coffee originated in Ethiopia before spreading through Arabia and later into Europe, becoming a global staple.
Today, two main bean varieties dominate the market:
Arabica (≈70% of global supply): Higher quality, smoother flavor, and the most actively traded on futures exchanges.
Robusta (≈30% of supply): Stronger flavor, more caffeine, used in instant coffee and blends.
Coffee futures (KC contracts, traded on ICE) allow producers, roasters, exporters, and investors to hedge against price volatility or speculate on global demand and supply swings. These futures are physically settled, but most speculative traders roll or close positions before delivery.
🔹 1. Global Coffee Supply Concentration
Nearly 74% of the world’s coffee beans come from just five countries:
🇧🇷 Brazil → Largest producer, dominates Arabica and Robusta exports.
🇻🇳 Vietnam → Largest Robusta producer, key competitor to Brazil.
🇨🇴 Colombia → High-quality Arabica supplier.
🇮🇩 Indonesia → Mix of Arabica & Robusta, weather-sensitive.
🇪🇹 Ethiopia → Birthplace of coffee, major Arabica exporter.
Because of this concentration, traders monitor weather, politics, and economics in these countries closely. A frost in Brazil or political unrest in Vietnam can shake the entire global market.
🔹 2. What Moves Coffee Prices the Most?
Coffee is one of the most weather-sensitive and geopolitically exposed commodities.
1️⃣ Weather in Producing Countries
Frosts and droughts in Brazil (especially during flowering season) can cut supply drastically.
El Niño / La Niña events disrupt rainfall patterns across South America and Asia.
📌 Example: July 2021 frost in Brazil devastated crops → Coffee futures surged over 60% within months.
2️⃣ Political Instability
Strikes, protests, or export restrictions in Brazil, Vietnam, or Colombia can delay shipments.
Political risks in Latin America historically coincide with coffee supply disruptions.
3️⃣ Global Economic Growth
Rising incomes in Asia, Africa, and Latin America increase coffee consumption.
Coffee shifts from a luxury to a daily staple, driving long-term demand growth.
4️⃣ Health Reports & Consumer Trends
Positive studies about coffee’s health benefits (antioxidants, longevity, heart health) boost consumption.
Rising demand for premium Arabica beans (specialty coffee, single-origin) drives price premiums.
🔹 3. Seasonality of Coffee Futures
Like other soft commodities, coffee follows seasonal cycles tied to harvest and demand.
📈 Best Periods: Late winter to early summer (Feb–Jul). Traders often buy into supply fears before Brazil’s winter season (risk of frost).
📉 Weaker Periods: Harvest season in major producing regions (Sep–Oct) when fresh supply pressures prices.
📌 Example: Coffee futures tend to rally into June/July when frost concerns in Brazil peak, then weaken post-harvest in the fall.
🔹 4. How to Trade Coffee
Futures & ETFs
Coffee Futures (KC) → Traded on ICE, standard contract for institutional & speculative traders.
JO ETF (iPath Coffee ETN) → Retail-friendly option for coffee exposure.
Stocks with Coffee Exposure
Starbucks (SBUX): Global leader in coffee retail.
Nestlé (NESN.SW): Owns Nescafé & Nespresso, one of the largest global coffee buyers.
JM Smucker (SJM): Owns Folgers & Dunkin’ brands.
Luckin Coffee (LKNCY): Fast-growing Chinese coffee chain (emerging markets play).
📌 When coffee prices rise → Retailers like Starbucks may face margin compression unless they pass costs to consumers.
📌 When coffee prices fall → Profit margins improve for coffee sellers & roasters.
🔹 5. Coffee Trading Strategies
📈 Strategy #1: Buy and Hold
Buy and hold when the close price today is greater than the 200 Simple Moving Average, and the 14-14 ADX is lower than 50; and
Sell when neither of the above conditions are met.
Additional Notes:
In the 4-HR, a 200 SMA and 30 ADX Threshold can work.
Rallies typically last 120~180 days after the signal is generated.
Stop loss is either the 21 SMA, or the 2.5x Daily ATR.
📈 Strategy #2: Seasonal Long (Feb–Jul)
Go long coffee futures or JO ETF in late winter.
Exit before fall harvest (Sep–Oct).
📈 Strategy #3: Weather Hedge
Track Brazil’s weather models (frost, drought risk).
Enter futures or ETFs ahead of known risk windows.
📈 Strategy #4: Macro Demand Growth
Long-term investors may pair coffee exposure with emerging-market consumer stocks (Nestlé, Starbucks, Luckin Coffee).
📌 Conclusion: Coffee as a Soft Commodity Trade
Coffee is one of the most volatile and globally impactful soft commodities. With supply concentrated in a handful of nations and consumption spread worldwide, it offers both seasonal trading opportunities and long-term growth exposure.
✅ Seasonality Edge: Strongest in Feb–Jul, weakest in harvest season.
✅ Macro Edge: Track Brazil, Vietnam, Colombia → weather & politics drive 70%+ of supply.
✅ Consumer Edge: Health trends + premium coffee demand = long-term bullish.
✅ Diversification Edge: Coffee moves independently from equities & metals, making it an attractive portfolio diversifier.
Traders who align seasonality, weather, and demand cycles can use coffee futures or ETFs to capture repeatable opportunities in this globally essential commodity.

Short Sugar📌 When is Sugar in High Demand & How Does It Cycle?
Sugar, extracted from sugarcane and sugar beet, is one of the world’s oldest and most consumed commodities. Beyond sweetening food and beverages, sugar has also become a critical biofuel input through ethanol production, especially in Brazil. Because of its dual role in food and energy markets, sugar futures are actively traded on global exchanges like ICE, CME, and NYMEX, offering traders volatility and diversification.
Historically, sugar has been a boom-and-bust market, with periods of oversupply followed by sharp deficits. These cycles are amplified by government subsidies, tariffs, ethanol mandates, and weather shocks. For hedgers, sugar futures provide protection against price fluctuations, while for speculators, they offer seasonal and trend-based trading opportunities.
🔹 1. Core Sugar Futures Trading Strategies
📈 Strategy #1: Seasonal Hedge Play
The best period to hold long positions in sugar is from late May through late January.
This window aligns with harvest cycles in Brazil and India, along with ethanol blending seasons and holiday consumption peaks.
📌 Historical Note: Data shows sugar has outperformed significantly in these months, making it one of the more reliable soft commodity seasonal plays.
📈 Strategy #2: Keltner Channel Breakout Model
Buy Signal: When price closes above the 350-day moving average + 7-day ATR.
Sell Signal: When price closes below the 350-day moving average – 7-day ATR.
📌 Alternate setting: 111-day length has also proven effective. I prefer Heikin Ashi.
Why it works:
The 350-day average reflects the long-term trend, filtering out noise.
The ATR buffer prevents false breakouts, only triggering when volatility confirms the move.
Sugar tends to trend strongly during supply shocks, making breakout systems powerful.
🔹 2. Seasonality of Sugar Futures
Like most agricultural commodities, sugar exhibits clear seasonal tendencies tied to planting, harvest, and consumption cycles.
📈 Best Performing Months: February, June, July, November, December.
📉 Weaker Months: March–April (post-harvest supply pressure), late summer (demand softens).
📌 Example:
In Nov–Dec 2020, sugar futures rallied over 15% as Brazilian mills shifted more cane production toward ethanol due to higher oil prices, tightening global sugar supply.
🔹 3. What Moves the Sugar Market the Most?
Sugar is uniquely influenced by both food and energy markets:
1️⃣ Government Subsidies & Tariffs
India, Thailand, and the EU heavily subsidize sugar production.
Policy shifts on export quotas or subsidies can swing prices sharply.
2️⃣ Ethanol Demand & Oil Prices
Brazil diverts sugarcane to either sugar or ethanol depending on profitability.
📌 High oil prices → more ethanol demand → less sugar supply → sugar prices rise.
📌 Low oil prices → weaker ethanol demand → excess sugar supply → sugar prices fall.
3️⃣ Brazil’s Currency (Brazilian Real, BRL)
Brazil is the largest global producer/exporter of sugar.
A weaker BRL encourages exports, often putting downward pressure on prices.
4️⃣ Weather Conditions
Sugarcane requires consistent tropical rainfall.
Droughts in Brazil or monsoon failures in India can severely restrict global supply.
5️⃣ Global Consumption Trends
Rising sugar demand in emerging markets, coupled with global population growth, supports long-term demand.
However, health-driven sugar reduction campaigns in developed countries can act as a drag on demand.
🔹 4. Seasonal Sugar Trading Calendar
Month Seasonal Driver Typical Price Behavior Trading Implication
Jan–Feb Ethanol blending + holiday demand Bullish Strong long entries
Mar–Apr Post-harvest supply pressures Weak Potential short trades
May–Jun Brazil harvest + global demand pickup Bullish Begin seasonal longs
Jul–Aug Northern Hemisphere demand steady Bullish Hold longs
Sep–Oct Supply stabilization Neutral/volatile Range trading
Nov–Dec Holiday & ethanol demand Strong bullish Aggressive long entries
📌 Seasonal Summary: Best window to be long is May–January, weakest window is March–April.
🔹 5. Vehicles for Trading Sugar
Sugar Futures (ICE: SB): The most direct exposure, widely used by hedgers and speculators.
ETNs/ETFs:
CANE (Teucrium Sugar Fund) → tracks sugar futures.
SGG (iPath Bloomberg Sugar Subindex ETN).
Sugar Producers & Food Companies:
Cosan (CZZ) → Brazilian sugar & ethanol giant.
Archer Daniels Midland (ADM) → diversified commodity trader.
Nestlé, Coca-Cola, PepsiCo, Cheesecake → indirect sugar demand exposure.
📌 Conclusion: Best Sugar Trading Strategy
Sugar may seem like a simple sweetener, but as a traded commodity it is anything but simple. It sits at the intersection of agriculture and energy, making it one of the most interesting plays in the softs market.
✅ Seasonality Edge: Be long sugar from May–January; strongest months are Feb, Jun, Jul, Nov, Dec.
✅ Trend Edge: Use the 350-day MA + ATR breakout model to catch large moves.
✅ Macro Edge: Watch oil prices and Brazilian real (BRL) → they directly affect supply.
✅ Hedging Edge: Sugar futures are excellent for both producers and consumers to hedge against unpredictable price swings.
In short, sugar provides unique opportunities for traders who combine seasonality, macro awareness, and breakout systems. While volatile, its cyclical tendencies make it a commodity that rewards disciplined strategies.
