DOGE entry zone & price action: Deep altcoins market analysisJoin me in this analysis as we look at Dogecoin on the weekly timeframe, let's go deep into this chart and also the altcoins market.
There is something about counting the weeks. It is a strange phenomena but it works as a guide.
Not many projects close more than four consecutive weeks red. In this chart DOGEUSDT closed more than four weeks red only once, and this chart has more than two years worth of data.
The only time DOGE closed five weeks red there was a strong reversal on the sixth.
Within a down move, there can be additional bearish action after four weeks close red but it is always very close to the reversal point. After the sustained bearish action becomes actualize, the market turns.
This is the situation we are in now. Four weeks already closed red and everything is very similar to August 2024.
DOGEUSDT started to decline March 2024. Reaching the end of this decline, first a little bit of bullish action, which is equivalent to the green week we see here late-December/early January. Then the consecutive red weeks and the reversal starts to form.
Caution around these levels because there is always some sort of shakeout, liquidity hunt or flush.
Dogecoin is now trading within a good "entry zone." Bottom prices with support shown as a rising trendline and also the October 2025 flush low.
Two things to consider: This chart shows a reversal can happen within 2 weeks counting this week. So the current active candle and then the next candle. This is based on past action and the size and duration of the bearish wave. So we are very close to a reversal but here anything can happen.
A spot trader, investor, can buy as much as he/she wants without a care in the world. You can't go wrong when prices are this low. Even if the market were to move lower, it would only be a momentary drop.
Second, the next move is not expected to last a long time. While we expect bullish action, the fact that Bitcoin will turn extremely bearish later on, the most bearish since 2022, calls for caution. After this bearish period though we can go all-in with full force.
This is to say that it would be wise to prepare and plan for selling at the appearance of the next bullish wave. As soon as prices are high, excitement is present across the market, there is lots of hype and the sentiment turns from fear to greed, that's the moment to take profits. We will then have several months to enter again when prices are low.
Any type of bullish action will be short-lived, lasting 1-2 months at most. Then we get the bearish climax, months of bearish action, Bitcoin's bottom, consolidation at bottom prices followed by a recovery.
If Bitcoin were to move now suddenly below $70,000 and wick at $60,000 then things can change. A bullish period can last not only 1-2 months, but 2-4 months; we adapt to market conditions depending on what is happening today.
We use the past as a guide but the action is never truly the same. It is similar, but as the market grows, the patterns continue to change.
When the futures trading got started this changed the whole dynamic the market used to go through, all the patterns were distorted. Then we saw the ETFs and again, huge change. Now we have the options trading and this also is making hard to predict exact dates. With each new addition, we have to adapt to new possibilities and we are open to everything.
Let's say 1-2 weeks at most, can be more but this is my prediction right now. We go bullish and this bullish wave can be mild or strong, never small because of the size, strength and duration of the bearish cycle.
Then this bullish move being strong also will support the major crash that follows. Those projects/pairs that are set to remain within higher lows will grow really high. Those pairs that are set to crash bad will perform poorly. There will be countless of choices, it will be mixed. Choose wisely.
Namaste.
Community ideas

Gold update, daily TF —Bearish confirmation —XAU vs CryptoI looked at Gold yesterday for you based on the weekly timeframe. The chart called for a lower high and bearish continuation. Lower prices likely resulting in a full blown correction or bear-market. Confirmation comes in today.
XAUUSD just turned red on the daily timeframe with a full candle. This move points to a lower high. This lower high can signal the start of a move toward $4,079 (~$4,100).
Yesterday I also mentioned that the all-time high was not to be challenged because it was just too far away, way too far. It seems we are getting an early confirmation of this statement.
›› Is there any relation between Gold and the Cryptocurrency market right now?
The fact that Gold was undergoing a massive bull market while the Cryptocurrency market was undergoing a massive crash, gives us a negative correlation between the two.
For example: As Crypto was going through a massive flush-reset in October 2025, Gold was producing a major peak and new all-time high.
As Gold now peaks and starts to reverse, this can indicate that Cryptocurrency is set to embark on a massive bullish phase. That is, if the negative correlation is sustained.
›› How long can a Gold bear market last?
Can be very hard to say. A full correction can unravel in 3-6 months time just as it can last years.
The fact that Gold went through a phase of parabolic growth gives us a minimum of three months of bearish action if things turn out really good. So 3-6 months sounds reasonable.
On the other hand, with global finance and geopolitics being a mess, this supports a short bearish cycle on Gold.
I don't have enough experience to make additional comments at this point.
Thank you for reading.
Namaste.

ABBV Will Fly Once This HappensABBV Will Fly Once This Happens
NYSE:ABBV is one of those incredible companies, not just because of what they do, but how they do it. They have consistently ranked among the best for employee well-being while successfully bringing to market some of the most patent-protected biotech drugs, such as Humira . Furthermore, they continue to develop even more advanced treatments that are expected to surpass previous sales records.
Since 2013, the company has seen steady growth , and there are no signs of that slowing down. While these types of stocks are fantastic, they rarely offer clear entry points that allow you to avoid significant drawdowns.
Today, we have an opportunity to enter at the breakout of a bull flag (or channel). This is a clear bullish continuation pattern that aligns perfectly with analyst price targets and the positive progress of their current research and drug pipeline.
Breaking above the channel, specifically the $235 mark, would be a strong signal to enter. Given the expected upward momentum, we could use a very tight Stop Loss (SL).
I have marked the Fibonacci levels, but this is the kind of stock you could simply hold in a portfolio long-term after a perfect entry. That said, my philosophy is to capture the profit during the rally and then move on to the next opportunity, so I will be focusing on those Fibonacci levels for my exit.
On the downside, I would be concerned if we lost $210 , as that could lead us straight to $190 . At that level, I expect to see plenty of buyers, making it an excellent entry point. If that level fails to hold, the bullish trend would likely be over, and it would be best to stay out.
Currently, however, it looks like the price is preparing for an imminent upward move.
How far ABBV can go?
Short-to-Medium Term : If the $235 breakout holds, the immediate Fibonacci extensions often point toward the $255 - $265 range.
Long-Term : As long as their new immunology assets (like Skyrizi and Rinvoq) continue to fill the Humira gap, ABBV is positioned as a powerhouse. In a sustained bullish market, seeing it test the $280 - $300 psychological levels over the next 18–24 months is well within the realm of analyst projections.
What would be your exit strategy if the price breaks the bull flag? Do you consider a long term hold here? Or a fast profit?
👇 WANT MORE?
🚀 Hit the rocket, read my profile and follow so we can find each other again.

Tesla: Corrective Dip Before The Next Bullish Leg?Tesla staged an impressive recovery from its April 2025 lows, extending the rally to fresh highs near the 500 level. However, the beginning of 2026 has introduced a notable retracement, raising questions about whether this marks a larger reversal or simply a pause within a broader uptrend.
From an Elliott Wave perspective, the current decline appears to be part of a corrective wave four. The pullback has unfolded in three visible subwaves so far, suggesting that the correction may be approaching completion. While the retracement has been deeper than initially expected, it still fits within the structure of a healthy consolidation phase following a strong impulsive advance.
A key technical area to monitor lies between 400 and 370. This zone is particularly significant as it aligns with the previous fourth wave of lesser degree and the former swing high from May 2025—both common areas for corrective pullbacks to find support. Such confluence strengthens the probability of a bullish reaction if price stabilizes within this range.
Momentum indicators further support this view. The Elliott Wave Oscillator has declined to levels comparable to those seen during the July and November 2025 consolidations, both of which preceded renewed upside momentum. This similarity suggests that bearish pressure may be fading and that buyers could soon attempt another push higher.
As long as Tesla remains above the 275–277 invalidation zone, the broader bullish structure remains intact. A sustained hold above key support could pave the way for the next impulsive move to new highs.
Highlights
Key support zone: 400–370
Current pullback: Likely part of wave four, potentially nearing completion
Momentum signal: Elliott Wave Oscillator approaching historical support levels
Bullish structure valid above: 275–277 invalidation zone

EURUSD SHORT VIEWS!!The yen was set for its best week in almost 15 months on Friday, having climbed steadily after Japanese Prime Minister Sanae Takaichi's historic election win allayed some investor worries about the nation's fiscal health.

XAGUSD - Bullish TrendTechnicals:
Bullish RSI Divergence is indicating a upside breakout for Silver, is it start of a Bullish Rally for Silver?
Fundamental:
• The COT report shows speculators are net long, confirming bullish sentiment.
• Physical demand (solar, EVs, electronics) is structurally outpacing mine supply, creating multi‑year deficits.
• ETF flows remain positive, with holdings rising even during price volatility, a sign of institutional conviction.
• Macro backdrop: Inflation uncertainty and gold‑to‑silver ratio compression are reinforcing silver’s relative strength.

USDT Dominance – 2H Chart Analysis. USDT Dominance – 2H Chart Analysis
USDT.D is trading inside a tightening triangle structure between rising support and descending resistance, currently around 8.02%. This is a key compression zone — breakout here will likely drive the next major move in the crypto market.
Support: 7.96% – 7.70%
Resistance: 8.20%
Major Resistance: 8.64%
→ Liquidity moving into stablecoins
→ Likely pressure on BTC & Altcoins
→ Potential market pullback
→ Capital flowing back into crypto
→ Bullish momentum for BTC & Alts
→ Possible relief rally across the market
⚠️ Watch dominance closely — it often moves before price reacts.

BTC: another Drop??????Hi everyone!
After a strong rally, BTC formed a rising wedge pattern and has now broken to the downside. Price is currently sitting at a very important support zone, which could be difficult to break.
🔴For now, it’s better to stay patient and wait for a clear breakdown below the $74,400 support level, or a breakdown followed by a retest/retracement, before considering any short positions.
🎯If this support fails, the potential downside target would be around $63,500.

Bullish bounce for the Swissie?The price has bounced off the support level, which is a pullback support, and could rise from this level to our take profit.
Entry: 0.7680
Why we like it:
There is a pullback support level.
Stop loss: 0.7599
Why we like it:
There is a swing low support level.
Take profit: 0.7795
Why we like it:
There is a pullback resistance level.
Enjoying your TradingView experience? Review us!
Please be advised that the information presented on TradingView is provided to Vantage (‘Vantage Global Limited’, ‘we’) by a third-party provider (‘Everest Fortune Group’). Please be reminded that you are solely responsible for the trading decisions on your account. There is a very high degree of risk involved in trading. Any information and/or content is intended entirely for research, educational and informational purposes only and does not constitute investment or consultation advice or investment strategy. The information is not tailored to the investment needs of any specific person and therefore does not involve a consideration of any of the investment objectives, financial situation or needs of any viewer that may receive it. Kindly also note that past performance is not a reliable indicator of future results. Actual results may differ materially from those anticipated in forward-looking or past performance statements. We assume no liability as to the accuracy or completeness of any of the information and/or content provided herein and the Company cannot be held responsible for any omission, mistake nor for any loss or damage including without limitation to any loss of profit which may arise from reliance on any information supplied by Everest Fortune Group.

Using Smaller Contracts to Trade Silver After the Flush Silver rarely tends to trend in a straight line, often abruptly repricing in phases, particularly when positioning becomes crowded or leverage builds into the move.
The latest decline appears to be less a reassessment of long-term fundamentals and more a function of market mechanics. The appointment of a new Fed Chair has introduced a regime shift in volatility. As margin requirements adjusted to this new landscape, leveraged participants faced a significant squeeze.
Evidently, many positions were trimmed not on Silver’s thesis, but because the cost of maintaining them increased.
With price action driven by deleveraging rather than deterioration in demand or supply, such moves tend to overshoot. Once forced reductions run their course, price behaviour often becomes more orderly than headlines (and fundamentals) would imply.
Against that backdrop, CME’s new 100-ounce Silver futures contract is arriving at a practical moment. In an environment where margin sensitivity has become a dominant variable, contract size is all the more consequential, directly affecting how precisely exposure can be adjusted during periods of stress.
THE POST-CRASH SETUP
The recent rally and slide in silver coincided with a visible rise and retreat in implied volatility.
As volatility increases, margin requirements rise, and leveraged participants are forced to reduce their exposure, also amplifying the initial price move. The recent compression in CVOL to pre-rally levels indicates a transition toward stabilisation rather than further accelerating stress.
Source: CME CVOL
On the fundamental side, the medium-term backdrop for Silver has not deteriorated. Industrial demand tied to solar installations, grid expansion and broader electrification trends remains intact. These are not short-cycle impulses but multi-year demand channels that do not reprice week to week.
Source: CME QuikStrike
Recent changes in Open Interest for Silver Futures also suggest that the post-crash landscape has renewed interest in downside protection for the near-term weekly contracts and the March contract (SOJ6), while for the front-month (SOH6) contract, the leaning is overwhelmingly bullish.
The Gold-Silver Ratio (GSR) provides additional perspective. The ratio went below its mean of 67 in mid-December, hit its recent low around 43, but now remains close to the average value at 65. With volatility much lower than before and a stabilisation in the GSR, directional moves in silver are not unlikely, especially with upcoming events (or lack thereof) in the pipeline.
CHINA, LIQUIDITY WINDOWS, AND CNY SEASONALITY
When the Shanghai Futures Exchange (SHFE) pauses trading for the holiday while COMEX remains open, liquidity becomes uneven. With one of the largest physical-demand centres temporarily offline, price discovery shifts disproportionately to Western markets.
The window between the SHFE close and its reopening can coincide with outsized moves in silver futures, particularly when positioning or inventories were already stretched going into the break. Without the balancing flow from Shanghai, intraday moves can extend further than they otherwise might.
Source: Ceicdata
Tracking changes in inventory levels can also reveal whether price swings are rooted in physical tightness, speculative adjustment, or cross-market arbitrage pressures.
SHFE last reported about 350 Ton, which is a 75% decline year-on-year.
Near-term domestic tightness on the SHFE has been a topic of discussion for months now. Even COMEX inventories have been drained recently, as the narrative becomes more about the physical metal.
Source: TrendForce
Global demand signals from the East remain a primary driver of the inventory drain.
When Shanghai closes for the Chinese New Year, and COMEX continues trading, global prices would continue to move on macro flows in the absence of Chinese participation, only to re-adjust once SHFE reopens and domestic (supply-based) positioning re-enters the market.
In addition, starting 01/Mar, the SHFE would begin enforcing stricter hedging quotas and require participants to prove physical business ties for their silver positions.
MARKET STRUCTURE INDICATORS
Positioning data reinforces the idea that this was a stress event rather than a collapse, and investors have started positioning accordingly.
Source: CME QuikStrike
For the front-month contract expiring on 24/Feb, over 260 calls were added for the $85 strike, while almost 200 ITM puts were removed at the $81 strike. Some near-the-money puts were added as protection, but ITM puts being closed and far OTM calls being added signals a bullish outlook for the next 10 days.
A similar dynamic was observed during the February–April 2021 silver correction, when prices retraced sharply following the initial rally and margin increases. After the liquidation phase subsided, silver stabilised near pre-rally levels before resuming its upward trajectory.
Over the subsequent 48-day period, COMEX Silver futures rose approximately 19%, moving from USD 24.05 per ounce to USD 28.63 per ounce.
For CME Silver futures, each standard COMEX contract represents 5,000 troy ounces of silver. This implies that every USD 1.00 move in the silver price corresponds to USD 5,000 per contract.
Illustrative P&L calculation:
Entry level : USD 24.05 per ounce
Exit level : USD 28.63 per ounce
Net price move : USD 4.58 per ounce
Profit per contract:
USD 4.58 × 5,000 ounces = USD 22,900 per contract.
WHY THE 100-OUNCE CONTRACT IS TIMELY
CME’s move towards a percentage-based margin has increased the capital sensitivity of silver exposure. In high-volatility environments, effective margin requirements can spike significantly, often requiring traders to hold upward of 50–60% of notional value to weather intraday swings.
For a standard 5,000-ounce silver contract, this becomes capital-intensive quickly. A trader forced to reduce exposure due to margin pressure often has little room to scale gradually.
The 100-ounce contract changes that dynamic.
At one-fiftieth the size of the standard contract, it allows:
Gradual position building after volatility resets,
Cleaner partial hedging of physical or ETF exposure,
More precise risk calibration during macro event windows.
In volatile commodities, flexibility is often more valuable than leverage. The smaller contract makes that flexibility accessible to investors.
This content is sponsored.
MARKET DATA
CME Real-time Market Data helps identify trading setups and more effectively express market views. If you have futures in your trading portfolio, you can check out on CME Group data plans available that suit your trading needs at tradingview.com/cme .
DISCLAIMER
This case study is for educational purposes only and does not constitute investment recommendations or advice. Nor are they used to promote any specific products, or services.
Trading or investment ideas cited here are for illustration only, as an integral part of a case study to demonstrate the fundamental concepts in risk management or trading under the market scenarios being discussed. Please read the FULL DISCLAIMER, the link to which is provided in our profile description.

BTC/USDT – 2H Chart Update. BTC/USDT – 2H Chart Update
BTC is compressing between a descending resistance trendline and rising short-term support, forming a tightening wedge structure around 67K.
Price holding above 66K local support
Descending trendline near 68.5K–69K acting as a pressure zone
Ichimoku cloud thinning → momentum slowdown, breakout setup forming.
Support: 66,000–65,500
Major Macro Support: 60,000–58,500
Resistance: 69,000
Breakout Confirmation: 70,000+
If BTC breaks above 69–70K with strength, upside momentum can extend toward 73K–75K liquidity zone.
Failure to hold 66K may trigger another sweep toward 64K before any recovery.
⚠️ Wait for breakout confirmation

SPX is at structural support Tomorrow is CPI so best to wait and react to what the market does. I go through some possibilities for trading tomorrow.

GBPUSD: Pullback From Support 🇬🇧🇺🇸
GBPUSD will likely pullback from the underlying intraday support.
Goal - 1.3669
❤️Please, support my work with like, thank you!❤️
I am part of Trade Nation's Influencer program and receive a monthly fee for using their TradingView charts in my analysis.

Amgen May Have Broken OutAmgen spent a quarter consolidating near record highs, and now it may have broken out.
The first pattern on today’s chart is the surge on February 4 after earnings beat estimates. The pharmaceutical giant pulled back to hold a 50 percent retracement of the move, potentially confirming its upward trajectory.
Second, the 50-day simple moving average (SMA) crossed above the 100-day SMA in November and has expanded since, which may confirm its long-term direction has grown more bullish.
Third, the 8-day exponential moving average (EMA) is above the 21-day EMA. MACD is also rising. Those signals could reflect short-term bullishness.
TradeStation has, for decades, advanced the trading industry, providing access to stocks, options and futures. If you're born to trade, we could be for you. Learn more here about TradingView’s Broker of the Year!
Past performance, whether actual or indicated by historical tests of strategies, is no guarantee of future performance or success. There is a possibility that you may sustain a loss equal to or greater than your entire investment regardless of which asset class you trade (equities, options or futures); therefore, you should not invest or risk money that you cannot afford to lose. Online trading is not suitable for all investors. View the document titled Characteristics and Risks of Standardized Options at www.TradeStation.com . Before trading any asset class, customers must read the relevant risk disclosure statements on www.TradeStation.com . System access and trade placement and execution may be delayed or fail due to market volatility and volume, quote delays, system and software errors, Internet traffic, outages and other factors.
Securities and futures trading is offered to self-directed customers by TradeStation Securities, Inc., a broker-dealer registered with the Securities and Exchange Commission and a futures commission merchant licensed with the Commodity Futures Trading Commission). TradeStation Securities is a member of the Financial Industry Regulatory Authority, the National Futures Association, and a number of exchanges.
TradeStation Securities, Inc. and TradeStation Technologies, Inc. are each wholly owned subsidiaries of TradeStation Group, Inc., both operating, and providing products and services, under the TradeStation brand and trademark. When applying for, or purchasing, accounts, subscriptions, products and services, it is important that you know which company you will be dealing with. Visit www.TradeStation.com for further important information explaining what this means.

XAUUSD on implusive drop OANDA:XAUUSD
Currently I'm holding my sell trades as I mentioned
Market should remains below the trendline stay on selling side
Target : 4750
⚠️ keep in mind if H1-H4 Candle (Body) closes above above trendline & our setup will invalid

Silver: Outperformance Cycle vs. Gold Has EndedThe price of silver, aligned with gold’s underlying bullish trend in financial markets and also supported by its own fundamentals, rose vertically to $121 at the end of January before undergoing a sharp 47% correction within just a few days. Can we assert that the annual high in silver has been set at $121? Furthermore, has the catch-up phase of silver relative to gold come to an end?
At current prices, gold has a market capitalization of 35 trillion US dollars (35T$), while silver stands at around 4.5T$. By comparison, US GDP is 29T$ and global money supply (global M2) is 110T$.
Silver does not have the same status as gold and will NEVER match gold’s market capitalization. However, cycles of outperformance and underperformance exist between gold and silver, and it is this cycle that interests me today.
The chart below shows daily Japanese candlesticks for silver (XAG/USD):
Here are the dominant technical factors currently affecting silver (XAG/USD) in the precious metals segment of the commodities market:
• By reaching $121, XAG/USD achieved major technical targets and reached a very high level of technical overbought conditions
• Silver fell by 47% within just a few sessions at the beginning of February; the linear upward phase in place since last summer is over
• The technical regime is therefore no longer one of vertical ascent; however, the primary trend remains bullish as long as the major support at $48/50 is preserved
• The outperformance sequence of XAG/USD versus XAU/USD (the price of gold) is over according to technical analysis applied to the SILVER/GOLD ratio
On the monthly logarithmic chart, the move toward $121 corresponds to a technical extension consistent with the historical amplitude of previous bull cycles. The monthly RSI reached an extreme zone, close to the peaks observed at the major tops of 1980 and 2011. This type of configuration generally reflects a short-term terminal phase of exuberance, even when the structural trend remains upward.
The chart below shows monthly Japanese candlesticks for silver (XAG/USD):
The 47% correction should therefore not be interpreted merely as a market accident, but as a regime change. The market is shifting from an impulsive dynamic to a digestion phase. Excesses have been purged, the most aggressive speculative positions have been cleared, and price is returning to test key technical areas.
The $48/50 level now constitutes the strategic pivot. It corresponds to a former major polarity zone and to historical resistance turned support. As long as this zone holds on a monthly closing basis, the scenario of a major long-term bull cycle remains intact. However, a decisive break would open the way to a deeper correction toward intermediate retracements.
Regarding the SILVER/GOLD ratio:
The breakout from the descending compression pattern followed by an RSI spike near 90 typically marks the end of an outperformance sequence. Historically, when the ratio reaches such excess levels, a rotation phase in favor of gold begins. This does not necessarily mean an absolute decline in silver, but rather weaker relative performance compared to the yellow metal.
In conclusion, the peak at $121 could represent a major intermediate top within the current cycle. Silver’s primary trend remains bullish above $48/50, but the outperformance phase relative to gold appears, at this stage, to be over.
DISCLAIMER:
This content is intended for individuals who are familiar with financial markets and instruments and is for information purposes only. The presented idea (including market commentary, market data and observations) is not a work product of any research department of Swissquote or its affiliates. This material is intended to highlight market action and does not constitute investment, legal or tax advice. If you are a retail investor or lack experience in trading complex financial products, it is advisable to seek professional advice from licensed advisor before making any financial decisions.
This content is not intended to manipulate the market or encourage any specific financial behavior.
Swissquote makes no representation or warranty as to the quality, completeness, accuracy, comprehensiveness or non-infringement of such content. The views expressed are those of the consultant and are provided for educational purposes only. Any information provided relating to a product or market should not be construed as recommending an investment strategy or transaction. Past performance is not a guarantee of future results.
Swissquote and its employees and representatives shall in no event be held liable for any damages or losses arising directly or indirectly from decisions made on the basis of this content.
The use of any third-party brands or trademarks is for information only and does not imply endorsement by Swissquote, or that the trademark owner has authorised Swissquote to promote its products or services.
Swissquote is the marketing brand for the activities of Swissquote Bank Ltd (Switzerland) regulated by FINMA, Swissquote Capital Markets Limited regulated by CySEC (Cyprus), Swissquote Bank Europe SA (Luxembourg) regulated by the CSSF, Swissquote Ltd (UK) regulated by the FCA, Swissquote Financial Services (Malta) Ltd regulated by the Malta Financial Services Authority, Swissquote MEA Ltd. (UAE) regulated by the Dubai Financial Services Authority, Swissquote Pte Ltd (Singapore) regulated by the Monetary Authority of Singapore, Swissquote Asia Limited (Hong Kong) licensed by the Hong Kong Securities and Futures Commission (SFC) and Swissquote South Africa (Pty) Ltd supervised by the FSCA.
Products and services of Swissquote are only intended for those permitted to receive them under local law.
All investments carry a degree of risk. The risk of loss in trading or holding financial instruments can be substantial. The value of financial instruments, including but not limited to stocks, bonds, cryptocurrencies, and other assets, can fluctuate both upwards and downwards. There is a significant risk of financial loss when buying, selling, holding, staking, or investing in these instruments. SQBE makes no recommendations regarding any specific investment, transaction, or the use of any particular investment strategy.
CFDs are complex instruments and come with a high risk of losing money rapidly due to leverage. The vast majority of retail client accounts suffer capital losses when trading in CFDs. You should consider whether you understand how CFDs work and whether you can afford to take the high risk of losing your money.
Digital Assets are unregulated in most countries and consumer protection rules may not apply. As highly volatile speculative investments, Digital Assets are not suitable for investors without a high-risk tolerance. Make sure you understand each Digital Asset before you trade.
Cryptocurrencies are not considered legal tender in some jurisdictions and are subject to regulatory uncertainties.
The use of Internet-based systems can involve high risks, including, but not limited to, fraud, cyber-attacks, network and communication failures, as well as identity theft and phishing attacks related to crypto-assets.

GBPUSD Losing Momentum Under Supply Rally Looks Tired as Dollar GBPUSD, Price pushed hard earlier, but the structure on this 4H chart now looks more like distribution than continuation. We’ve got repeated rejection near the upper resistance band, a series of lower highs forming, and a wedge-style breakdown attempt underway. From a macro angle, the pound is no longer getting clean support from rate expectations, while the dollar is still backed by relatively firmer US data and sticky inflation signals. That combination makes rallies vulnerable unless the next data wave clearly weakens the USD.
Current Bias
Short-term bearish to neutral-bearish.
Structure shows fading bullish momentum and a shift toward lower highs after rejection from the 1.3730–1.3870 supply zone.
Key Fundamental Drivers
US data mix still favors the dollar relative to peers, especially in services and inflation components.
Fed rate-cut expectations are being trimmed back to a slower path rather than aggressive easing.
UK growth remains soft, and while inflation has cooled from peaks, it is not translating into strong GBP demand.
BoE tone is cautious, with markets leaning toward eventual easing rather than further tightening.
Net effect: yield spread and growth stability still tilt mildly toward USD over GBP.
Macro Context
Interest Rates: Fed is in a cautious hold-to-slow-cut stance based on recent macro signals. BoE is also cautious but with weaker growth backing sterling.
Growth Trends: US growth indicators are holding up better than UK and euro area equivalents. UK activity data remains uneven.
Inflation: US inflation remains sticky enough to delay fast easing. UK inflation is lower than peak but not a strong GBP catalyst.
Risk Sentiment: Broad risk tone is mixed, not strongly supportive for high-beta FX.
Geopolitics: Ongoing geopolitical tensions keep a mild safe-haven bid under USD during stress windows.
Primary Risk to the Trend
A sharp downside surprise in US inflation or labor data that forces markets to rapidly price earlier Fed cuts. That would weaken the dollar broadly and invalidate the bearish GBPUSD bias.
Most Critical Upcoming News/Event
Next US CPI / core inflation release and nearby Fed speaker guidance.
On the UK side, CPI and wage data are key for shifting BoE expectations.
Leader/Lagger Dynamics
GBPUSD is typically a lagger to EURUSD and US yield moves rather than a primary leader.
It often follows:
EURUSD direction for broad USD flow
US 2Y–10Y yield moves
DXY trend shifts
If EURUSD rolls over, GBPUSD usually extends lower with higher beta.
Key Levels
Support Levels:
1.3510
1.3400
1.3340 zone (deeper structural support)
Resistance Levels:
1.3730–1.3750
1.3870 major supply high
Stop Loss (SL):
Above 1.3750 for bearish continuation structure
Take Profit (TP):
1.3510 first objective
1.3400 secondary objective
Summary: Bias and Watchpoints
The bias on GBPUSD is tilted bearish in the short term after repeated rejection from the upper resistance band and a shift into lower-high structure. Fundamentals lean slightly toward the dollar, supported by relatively stronger US activity and a slower Fed easing path compared with the BoE outlook. The main threat to this view is a soft US inflation shock that reprices rate cuts faster and weakens USD across the board. The most important catalysts ahead are US CPI and Fed communication, followed by UK inflation and wage data. GBPUSD usually follows broader USD and EURUSD direction rather than leading it, so keep one eye on those drivers while trading the levels around 1.3730 resistance and 1.3510 to 1.3400 support.

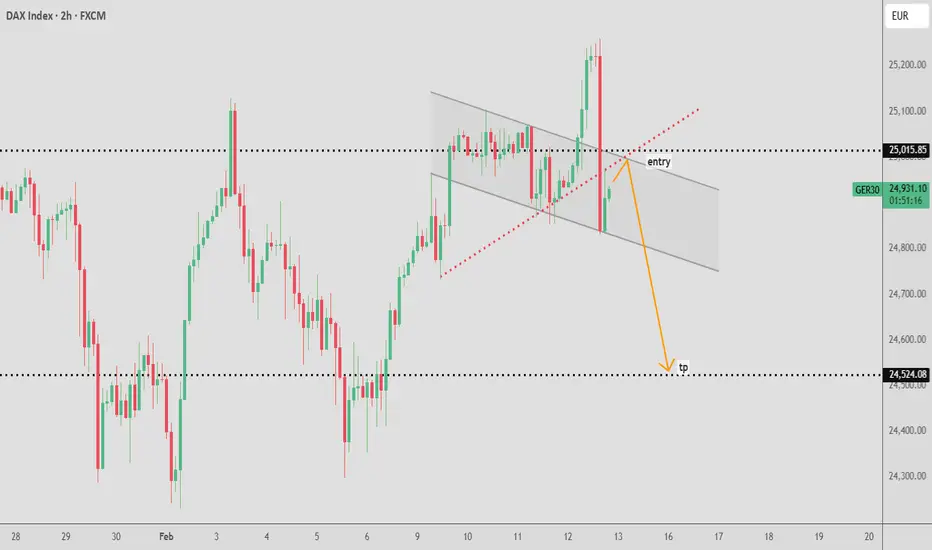
Bearish Breakout Below Range, Pullback Into Resistance
Current Structure:
Price was ranging under a clear resistance zone (≈ 4,992 – 5,018) before printing a strong bearish impulse candle that decisively broke structure to the downside. This move invalidated short-term bullish momentum and shifted bias intraday to bearish.
🔎 Key Observations
1. Market Structure Shift
The large bearish candle confirms a break of minor support and signals momentum expansion.
This looks like a liquidity sweep + displacement move, often followed by a corrective pullback.
2. Entry Zone (Demand) – 4,909 – 4,937
Price tapped into a marked demand/support area.
Reaction here suggests potential for a short-term retracement rather than immediate continuation.
This zone is likely where buyers attempt a bounce.
3. Resistance / Target Zone – 4,992 – 5,018
Previous consolidation + supply area.
If price retraces, this zone becomes:
A sell-on-rally area
A potential lower high formation zone
📈 Probable Scenario (Based on Structure)
Most likely flow:
Short-term bounce from demand
Retracement toward ~4,975–5,000
Rejection at resistance
Continuation lower if bearish structure holds
This would form a lower high, confirming bearish continuation.
⚠️ Alternative Scenario
If price:
Reclaims and closes strongly above 5,018
Holds above resistance
Then the bearish impulse becomes a fake breakdown and buyers regain control.
📊 Bias Summary
Intraday Bias: Bearish
Short-term Expectation: Pullback → rejection → continuation lower
Invalidation: Sustained move above resistance zone

Silver (XAGUSD) — D1 Potential Wave 3 Formation + Trendline BreaSilver (XAGUSD) — D1 Potential Wave 3 Formation + Trendline Break (Bullish Continuation)
🔎 Market Structure (D1)
On the Daily timeframe, Silver is forming the technical prerequisites for a potential Wave 3 to the upside, confirmed by:
• a breakout of the corrective trendline (shift out of the correction)
• completion of the retracement phase (Wave 2) after the first impulsive leg
• support holding above the recent swing base (buyers defending the structure)
• early impulse behavior after the breakout (signs of acceleration potential)
The current price action fits a classic Elliott Wave impulse model, where Wave 3 begins once Wave 2 completes and price exits the corrective structure.
📐 Elliott Wave Context
• Wave 1: first impulsive move up (trend initiation)
• Wave 2: corrective pullback into structure
• Wave 3: potential impulsive expansion upward (current scenario)
📌 Key principle:
The bullish scenario remains valid as long as price holds above the low of Wave 2.
📍 Entry
Entry: 77.99778
The entry is positioned:
• near the post-breakout area
• inside the impulse activation zone
• where Wave 3 often starts expanding after confirmation
🎯 Target Levels (Wave 3 Projections)
Targets are derived from projected impulse expansion zones and key reaction levels:
TP1: 90.74343
TP2: 100.16412
TP3: 108.64274
TP4: 122.36796
Each target represents a potential reaction area and a logical level for partial profit-taking as Wave 3 develops.
🛑 Invalidation / Stop Loss
Stop Loss: 73.84160
📍 The stop is placed below the low of Wave 2, which:
• invalidates the Wave 3 bullish scenario if broken
• protects against continuation of the corrective/bearish structure
• follows Elliott Wave invalidation logic (Wave 2 low must hold for Wave 3)
🧠 Risk & Trade Management
Trend-following setup
Wave 3 can be the strongest phase, but volatility is common.
Recommended approach:
• partial profits at TP1 / TP2
• move stop to breakeven after strong continuation confirmation
• avoid adding risk before clear daily impulse expansion
• scale in only on pullbacks with confirmed support reaction
📌 Summary
XAGUSD on D1 shows a corrective trendline breakout and structural conditions for a potential Wave 3 to the upside.
The bullish scenario remains valid above 73.84160, with upside targets aligned to projected impulse expansion levels.

GOLD: Market Analysis and Strategy for February 13thThe fundamental factors affecting gold prices have eased, and gold is currently caught in a fierce battle between technical selling pressure and medium- to long-term upward expectations. Attention should be paid to the CPI data released during the New York session and the significant risks posed by Friday's time window.
Although the previous trading day ended with a sharp decline, the price remains above the support line of the daily upward trend. The Bollinger Bands are narrowing upwards, indicating that the current price expectation is still upward. The price is fluctuating around the middle Bollinger Band. During the Asian session, we can first observe the rebound in gold prices. If the 5000 level is recovered in the short term, the upward movement will accelerate. If it fails to recover, it will continue to test the previous support levels around 4800 or even 4780.
The 1-hour chart often shows a significant rebound after a sharp drop, but the overall structure is weak. Pay attention to the resistance levels at the 10-day and 20-day moving averages. Expect a rebound during the Asian session.
Gold Trading Strategy:
Potential Buying Range: 4900~4880
Potential Selling Range: 4996~5010
Short-term trading, quick in and out, reduce trade size!

EUR/JPY Gave Fake Breakout , Long Setup Valid To Get 200 Pips !Here is my 4H Chart on EUR/JPY , We Have A Fake Breakout Below 182.000 and then the price Back above my old support and we have a very good bullish Price Action on 2 And 4 Hours T.F after this massive movement to downside , Also the price playing very good around my support 182.000 , So i see it`s a good chance to buy this pair Now and targeting 100 to 150 pips . and if we have a daily closure again below my old support then this idea will not be valid anymore .
Reasons To Enter :
1- Perfect Breakout .
2- Clear bullish Price Action .
3- Bigger T.F Giving Good bullish P.A .
4 - Perfect 15 Mins Closure .
5- The Price Respect The support Again .

GOLD DAILY CHART ROUTE MAPHey Everyone,
Please see our Daily chart idea, which had a strong candle body close above the 5030 axis level on Monday opening the long-range upside target at 5198.
On Tuesday, we saw a small corrective move back to test the EMA5, which acted as dynamic support. The bounce from EMA5 aligned perfectly with our plan to buy the dips, supporting continuation of the upward push.
Following Monday’s confirmation close, price delivered a move of over 500+ pips, reinforcing the bullish structure. A daily EMA5 lock above 5030 would further strengthen the bullish gap above and increase the probability of filling it.
We will continue to update as the chart structure unfolds.
Mr Gold
