TradeCityPro | Bitcoin Daily Analysis #100👋 Welcome to the 100th Bitcoin Analysis!
I'm really happy we've shared this 100-day journey together, and I hope you've been able to benefit from these analyses along the way.
💥 Every single analysis I've posted so far has been the basis for real trades that I've taken myself. I'm glad to say the overall result of those trades has been profitable, and I hope your results have been positive too.
⚡️ Today, I want to do a full multi-timeframe breakdown of Bitcoin and other major crypto indices. Let’s dive in and see where the market stands.
💰 Bitcoin Analysis
📅 Weekly Timeframe
As you can see, in the weekly chart, Bitcoin reacted to an ascending curved trendline during its recent correction phase and retraced up to around 72,147.
💫 On the RSI, we also have a key support level at 44.75, which has held again. The combination of this support with the curved trendline has created a potential PRZ (Potential Reversal Zone), and price has since resumed its upward move.
✔️ Last week’s candle managed to close above the resistance at 104,919 for the first time ever. Many in the market expected that a weekly close above this level would trigger a sharp rally toward 130,000 or even 160,000.
📊 However, that hasn’t happened—this week’s candle is still small and lacks strong bullish momentum.
✨ We can now view the range between 104,919 and 108,454 as a resistance zone. Although the price has entered this zone, we haven’t yet confirmed a breakout. That confirmation would come with a weekly close above 108,454.
📈 Despite the strong momentum before breaking ATH, price seems to be losing steam now. That’s not necessarily bad—it’s actually expected, since this area is one of the most important supply zones for Bitcoin and won’t break easily.
🔽 If price gets rejected and this move turns out to be a fakeout, there’s a real possibility of a trend reversal. We’ve got a potential double top forming, which is usually the first signal of a reversal. If price then breaks the 72,147 support, it would confirm the end of the current uptrend. A lower high and lower low afterward would confirm a new downtrend.
⭐ At this point, I can’t give you a new spot-buy trigger in this timeframe. The trigger was around the curved trendline. Since price has moved away, we need to wait for a new setup to form.
Let’s check lower timeframes for more detailed price action.
📅 Daily Timeframe
In the daily chart, after getting support at 76,087, price started moving up and with the breakouts of 87,700 and 91,953, the bullish phase began.
🔍 Currently, price is holding above 106,250 with increasing volume since the 91,953 breakout. Everything looks ready for Bitcoin to begin its main move and enter an extension leg up.
🚀 If this happens, price could target 129,000 and even 150,000. RSI will be key for confirmation—if it re-enters Overbought territory and holds above 77.81, higher targets become more likely.
🛒 The previous spot-buy triggers I gave were at 87,700 and 91,900. If you entered with those, I recommend holding for now and waiting for signs of a trend change before taking profits.
🔔 If you didn’t buy earlier, I can’t provide a new entry just yet—we need to wait for a new structure and trigger to form.
🔽 For now, I still see the trend as bullish. A bearish scenario would require a fakeout below 106,250—if price drops and forms a lower high and lower low, the uptrend would be over and a downtrend would begin.
⏳ 4-Hour Timeframe
After breaking 106,250, price rallied to 111,826 and is now pulling back to 106,250.
✔️ RSI is holding above its local support at 44.48, and as long as it stays above that level, market momentum remains bullish.
📈 You can consider entering a long on a pullback to 106,250. A breakout above 111,826 would be the main trigger for a new long.
🔑 Right now, there’s no valid reason to short, so it’s best to wait for a clear bearish structure before considering that.
👑 Bitcoin Dominance (BTC.D)
📅 Weekly Timeframe
After several green weekly candles, BTC.D printed a large red candle, pulling back toward the midline of its ascending channel and rejecting from 64.77. However, it’s now moving back up again.
💥 With this strong momentum, there’s a good chance BTC.D could break out of the channel. If 64.77 breaks, we could see a push toward 71.04.
⚡️ To confirm a bearish reversal in BTC.D, we’d need to see a breakdown below the lower trendline of the channel. That would likely signal the start of an altseason.
📅 Daily Timeframe
BTC.D has been in an uptrend and even broke above its channel briefly. But after hitting 65.31, it started a correction and dropped to the midline at 62.22.
🎲 It quickly bounced from 62.22 and is now moving upward again. Given the bullish structure, it could retest the 65.31 high.
📈 If it forms a lower high and breaks below 62.22, that would confirm a trend reversal. A breakout above 65.31 would confirm continuation of the uptrend.
⏳ 4-Hour Timeframe
BTC.D rallied to 64.31 and is now trying to retest that level. If it breaks above 64.31, the next target is 65.41.
🧲 If it forms a lower high and breaks 63.51, we’d get a confirmation that the bullish leg has ended, increasing the chances of a move to 62.17.
✔️ Total2 (Altcoin Market Cap Excluding BTC)
📅 Weekly Timeframe
After breaking the curved trendline, Total2 fell to around 816B before bouncing alongside Bitcoin.
⚡️ Currently, it’s ranging between 1.15T and 1.26T for the past three weeks.
🧩 If price breaks this range, it could rally toward 1.61T, which is the most important supply zone for Total2. A breakout here would likely trigger a strong altcoin rally.
🛒 If that breakout coincides with a drop in BTC.D, it would be an excellent spot-buy opportunity for altcoins.
📊 If the current rally fails to reach 1.61T and forms a lower high, another drop toward 816B is likely. This time, the chance of breaking that support would be high—confirming a trend reversal.
📅 Daily Timeframe
Price is stuck in a range between 1.15T and 1.26T.
🔼 A breakout from either side would likely lead to a strong move. A break below 1.15T could extend the decline toward 861B, while a break above 1.26T would target 1.62T.
⏳ 4-Hour Timeframe
Same structure as the daily chart. Long trigger = 1.26T breakout. Short trigger = 1.15T breakdown.
🔑 If price forms a higher low and starts moving back up, the likelihood of breaking 1.26T increases. The next target would be 1.33T.
✔️ USDT Dominance (USDT.D)
📅 Weekly Timeframe
USDT.D is ranging between 3.78 and 6.22.
📉 It recently formed a lower high below 6.22 and broke below 5.06, now heading toward 3.78.
🤔 If USDT.D drops to 3.78, we could see a major market rally—Bitcoin might move toward 130,000 or 160,000.
🚀 If 3.78 breaks, the next support is at 2.53, which would mark the start of a major bull run.
📅 Daily Timeframe
USDT.D has hit support at 4.40 and is now approaching a descending trendline that’s been holding since the 6.22 top.
📈 If that trendline breaks, the trigger is at 4.70. A breakout here could lead to a move to 5.02.
🔽 If price gets rejected again, the short trigger is at 4.40, and the next support is at 3.81.
⏳ 4-Hour Timeframe
Support at 4.38 has held, and price is now above 4.50 and approaching the trendline.
🎲 If 4.50 fails and price drops to 4.40, a break below 4.40 confirms a bearish continuation.
📊 If the trendline breaks, use 4.74 as your confirmation trigger.
❌ Disclaimer ❌
Trading futures is highly risky and dangerous. If you're not an expert, these triggers may not be suitable for you. You should first learn risk and capital management. You can also use the educational content from this channel.
Finally, these triggers reflect my personal opinions on price action, and the market may move completely against this analysis. So, do your own research before opening any position.
Community ideas

WC: 33.03 Target: 1800-2400 MOASS: 47k-100K: TICK TOCKIt would be easy to be really hyperbolic with my tone and words right based on the latest price action...but I'm NOT going to be
I am a TRADER and in order to extract profit consistently over time its important to manage the PSYCHOLOGICAL aspect of trading well i.e. your emotions
That's why I going to focus on only the TECHNICALS because THAT, for me, is what's going to ensure that I see as much PROFIT as possible from this trade:

Top 10 Altcoins Yet To Move, Strong Growth Potential —CommentI am making a list of TOP 10 Altcoins that are yet to move. These are not the ones with the highest growth potential nor anything like it but a selection of pairs that are yet to move strongly thus low risk vs a high potential for reward.
Let me give you some examples and then I will share the instructions below.
» PEPEUSDT grew some 200% already. This is awesome but it wouldn't be in the TOP 10 yet to move because it already grew strongly. It has plenty of room left available for additional growth but the higher it trades, the higher the risk.
» ETCUSDT grew less than 70%. This one is still trading low so it has huge potential for growth, it can be part of the TOP 10 Altcoins yet to move.
Let me give you another example:
» DOGSUSDT grew 150% already. It is currently trading below the last high of course but this one wouldn't make it in the list. We already jumped in early so we look for other pairs.
» AVAXUSDT grew a maximum of ~80% and is now trading only 55% higher compared to its 7-April low. This can be in the set of the TOP 10 Altcoins yet to move. Makes sense?
Like this, I will make a list.
If you are interested, leave a comment with "Share the TOP 10 Altcoins Yet Move" and if there is enough interactions I will do this post for you.
I can take a while because I will go through hundreds of pairs. Depending on how much interest there is, I can do another TOP10 and another TOP10, 3 sessions total, because there just too many Altcoins that are looking great and yet to move.
Sounds good?
Leave your comment below and let me know.
Namaste.

Bitcoin - Bulls vs Bears: $106k or New ATH?Bitcoin saw a sharp and aggressive drop following Donald Trump’s surprise announcement of a 50% tariff on EU imports. The sudden macro shock triggered broad risk-off flows, with BTC quickly selling off from local highs near 111.3K and tapping into a key fair value gap around 107.5K. Although we’ve seen a short-term bounce since that low, it’s not a convincing bullish reversal. Momentum remains fragile, and the overall structure still favors caution as we trade within a compression zone formed post-drop.
Key Technical Zones
We’re currently trapped between two major 1H fair value gaps that serve as clear boundaries for market direction. The lower zone around 107.5K has provided temporary support, acting as a reaction point after the dump. This FVG was left behind during the early-May rally and is now being tested for the first time. On the flip side, price was rejected earlier today from the upper 1H FVG at 109.8K to 110.7K, which previously served as the base of the last breakdown candle. That rejection confirms sellers are active at that level, and it’s now acting as resistance.
We’re essentially in a deadlock between demand and supply, and the next break will determine directional bias for the next major leg.
Bullish Scenario
If bulls can reclaim the 109.8K–110.7K area with strength and close above it convincingly, that would indicate demand has absorbed the supply in that zone. Ideally, we’d want to see a clear bullish displacement to confirm strength, not just a weak grind. In that scenario, BTC could make its way back toward the previous highs and retest the higher resistance zone around 112K. This level lines up with a larger supply zone and could become a key magnet if the market shifts risk-on again or if shorts begin to unwind.
Bearish Scenario
On the flip side, if BTC fails to hold the lower FVG and breaks below 109K with a strong bearish candle or wick rejection from the upper range, it opens the door for further downside. The next target would be the clean liquidity pool near 106K, which is supported by a price inefficiency and unmitigated demand just below. This level also aligns with prior consolidation structure and would be a logical place for a deeper retracement following the news-driven shakeout.
Market Context and Decision Point
This is a compression structure formed after a high-volatility event, so it’s important not to get trapped in the middle of the range. Price is coiling between two well-defined FVGs, and whichever one gives way will likely trigger the next expansion move. Look for signs of displacement impulsive candles, clean breaks, and follow-through, to validate which side is in control. Until then, patience is key. Let price choose the path and then follow the momentum.
Price Target and Expectations
✅ Break and hold above resistance FVG → target 112K
🚩 Break and lose the support FVG → target 106K
Conclusion
Bitcoin is stuck in a tight battle between bulls and bears following a heavy news-driven drop. The current 1H FVG range offers a textbook breakout setup, with both sides clearly defined. This is not the time to force trades inside the chop. Wait for a clean break, then position for the follow-through. The resolution of this range will likely dictate direction soon, especially as the market continues to digest the macro developments.
___________________________________
Thanks for your support!
If you found this idea helpful or learned something new, drop a like 👍 and leave a comment, I’d love to hear your thoughts! 🚀

ETH Continues Bullish Momentum Above Broken TrendlineHello guys!
Ethereum has shown a strong bullish rally, breaking through a long-standing descending trendline with significant momentum. Currently, price action is consolidating above the broken trendline, which may now act as a support zone.
🔹 Scenario 1 (Bullish Continuation): If ETH holds above the current range and confirms the broken trendline as support, we could see a continuation toward higher resistance levels around $3,500 and beyond.
🔹 Scenario 2 (Deeper Retest): Alternatively, a pullback toward the $2,200–$2,300 area (highlighted zone) could offer a better accumulation point before the next bullish leg resumes.
This setup suggests that as long as ETH remains above the key support levels, the bullish structure remains intact.

Bitcoin - Confirmed Breakout#BTC/USDT #Analysis
Description
---------------------------------------------------------------
+ Bitcoin has successfully broken out from the resistance, this is the third time bitcoin has broken out from the resistance line, in the previous two breakouts bitcoin had significant growth and we can expect similar growth this time.
+ the next target for bitcoin is around 150k and this is an easy target for bitcoin.
+ Bitcoin can see some consolidation around previous resistance (around 109k) but this can be broken easily.
+ Lets see how this plays out.
---------------------------------------------------------------
Enhance, Trade, Grow
---------------------------------------------------------------
Feel free to share your thoughts and insights. Don't forget to like and follow us for more trading ideas and discussions.
Best Regards,
VectorAlgo

GOLD increased in the short term: Break down expectedThe Gold market has been very strong for some time, but I don’t think this will continue to be the case going forward. As we’ve seen, the price has rallied a bit on Friday with Trump’s EU tariff threats.
Market structure starts to hint exhaustion, as such overbought conditions often lead to generous pullbacks, supporting needed corrections.
That being said I do think that on Monday we might see a short term pullback.
We can see that gold is currently being rejected just above the higher zone of the 4h ascending channel. The zone aligns with a low-volume node as well. Therefore, at this zone around the 3,350, I wouldn't recommend to chase high. Before this zone is clearly broken considering long entries here would be buying blindly.
Right now I think you have to look at this as a market that may just simply be a buy on the dip and hold till we get to the $3,500 level again type of situation.
The other scenario is that the market will consolidate for a while.
If we were to break down below the $3,290 level, then $3,200 is next support.
In the long run though the bias remains bullish with potential to challenge the 3,435 and as well as 3,500 in the big picture.
But if you're watching for buys:
wait to see how price behaves on Monday
watch for sustained bullish structure before getting involved
don’t chase, wait for a clean break + candle confirmation pattern
For sells:
Watch for bearish rejection in the next couple of candles (4H or Daily)
Don’t enter unless it’s confirmed!

Gold: Bullish Flag Formation Suggests Further Upside Potential Hello guys, let's dive into Gold analysis!
Gold is currently forming a bullish flag pattern, a continuation formation that typically follows a strong upward impulse (flagpole). After a sharp rally, the price consolidated within a downward channel, creating the classic flag structure.
🔍 Technical Breakdown:
Flagpole: The strong bullish rally in early April marks the beginning of the uptrend.
Flag (Channel): Price has corrected in a downward-sloping channel, respecting both upper and lower bounds, creating a textbook flag pattern.
Breakout Zone: Price is now testing the upper boundary of the flag. A confirmed breakout above this resistance would signal a continuation of the prior uptrend.
🎯 Price Targets:
First Target: Around $3,445, which aligns with the measured move from the breakout point.
Second Target: Around $3,725, representing full flagpole projection from the breakout zone.
📌 Key Levels to Watch:
Breakout Confirmation: A strong 4H close above the flag’s upper boundary (~$3,260) with volume confirmation would validate the pattern.
_____________________________________
Invalidation: A rejection from the resistance and a fall below the channel may delay the bullish scenario, potentially retesting lower support around $3,090.
📊 Conclusion:
This setup favors bulls, but patience is key. Traders may consider waiting for a clear breakout and retest for safer long entries, aiming for the outlined targets.

BITCOIN → False breakout of 110K. Negative background???BINANCE:BTCUSDT.P hit a new all-time high of almost 112K on the back of improved economic and fundamental data, but the party didn't last long before Trump's next speech...
Yesterday, Trump spoke and announced new tariffs on the EU. The markets reacted quite aggressively to this news. Despite the fact that the market has practically bought back all the losses, the question itself remains open. The introduction of 50% tariffs on Europe will increase the risk background, which could trigger a fall in both the stock market and cryptocurrencies. In this case, money will flow into gold (a safe asset)...
Technically, Bitcoin is forming a false breakout of the global resistance level of 110K (previous ATH). The price is reacting and forming a bearish momentum (coinciding with the change in the fundamental background).
The area between 109.8 and 110.3 is a resistance and liquidity zone relative to the previous ATH. If the bears hold the resistance, Bitcoin may get stuck inside the 110K - 106.8K (105K) range.
Resistance levels: 109.8K, 110.3K, 112K
Support levels: 106.8K, 105K
Accordingly, if the 110K resistance holds amid the correction, consolidation below the resistance will confirm the formation of a false breakout, and in this case, Bitcoin may move to the 110K (112K) - 105K (102K) range. However, situations change daily, and if Bitcoin does break through 110K and manages to consolidate above its previous ATH, this will be a signal for growth...
Best regards, R. Linda!

BITCOIN - Price will continue to grow inside rising channelHi guys, this is my overview for BTCUSDT, feel free to check it and write your feedback in comments👊
Price started to grow inside rising channel, where it declined to support line and then bounced up to $93100 level.
BTC broke this level at once and then some time traded near, after which bounced and continued to grow.
Soon BTC made a correction, but quickly turned around and later rose to $104900 level, after which started to decline.
After price fell a little, it made an upward impulse to resistance line of channel, breaking $104900 level.
But not long time ago, BTC bounced from this line and started to decline, so I think that price can continue to fall.
Also, I expect that price will fall to support area and then turn around and continue to grow in channel to $113700
If this post is useful to you, you can support me with like/boost and advice in comments❤️

Gold may break resistance level and then continue to growHello traders, I want share with you my opinion about Gold. In this chart, price previously formed a clear triangle pattern, where price was squeezed between two converging trend lines. After a period of consolidation, the market broke above this formation, reaching the resistance zone near 3365, but then started to retrace. Following that breakout, a new structure emerged, an upward wedge. The asset has been moving within this narrowing channel, forming higher lows and approaching the upper boundary with weakening momentum. This type of pattern often signals an upcoming strong move once the price breaks out from either side. Currently, Gold is trading near the resistance line of the wedge and just beneath the seller zone. I expect that the price may fall back to the support line of the wedge around the 3205 - 3185 area. After that, a bounce from this zone could trigger a bullish breakout from the wedge. That’s why I set my TP 1 at the 3420 level, this target aligns with a full wedge breakout and continuation of the upward movement through the resistance level and beyond the seller zone. Please share this idea with your friends and click Boost 🚀
Disclaimer: As part of ThinkMarkets’ Influencer Program, I am sponsored to share and publish their charts in my analysis.

Lingrid | SHIBUSDT Potential Rally to Key Resistance ZoneBINANCE:SHIBUSDT is consolidating above the key support at 0.00001373, sitting right at the intersection of the upward trendline and a major structure retest. A wedge pattern suggests cooling pressure, with the setup favoring a bullish breakout if buyers step in near this confluence. The key target lies in the 0.00001727 zone, aligning with prior highs inside the resistance channel. A breakdown below trendline support would invalidate this bullish outlook.
📈 Key Levels
Buy zone: 0.00001350 – 0.00001373
Buy trigger: breakout above wedge and upward trendline defense
Target: 0.00001727
Sell trigger: close below 0.00001350
💡 Risks
Weak volume on breakout may signal a fake move.
Sudden volatility from BTC could derail recovery.
Failure to hold the trendline flips structure bearish.
Traders, if you liked this idea or if you have your own opinion about it, write in the comments. I will be glad 👩💻

Will Trump's Tariffs Propel Gold Past 3,500 ? Again ? On May 23rd's U.S. trading session, Trump's tariff announcements on the EU and Apple roiled markets like a tempest 🌪️. He proposed a staggering 50% tariff on EU products starting from June 1st, citing unfair trade practices. Meanwhile, he threatened Apple with a 25% tariff if iPhones sold in the U.S. weren't manufactured domestically.
This sent gold prices soaring sky - high 🚀. As a reliable safe - haven, gold spiked as investors, deeply worried about the potential global economic impacts, rushed to safeguard their wealth. The 3280 support level for gold, which had been holding firm in the preceding days, became even more crucial as the upward momentum strengthened, like a sturdy anchor in stormy waters ⚓.
If the tariff issue remains unresolved and tensions continue to simmer between the U.S., the EU, and major corporations like Apple, the upward trajectory of gold prices is likely to persist. Analysts predict a good chance it could break the 3,500 mark, as if a new peak is waiting to be conquered 🏔️. Tariffs disrupt global supply chains and raise U.S. inflation fears, driving investors to gold for protection against economic and currency risks, much like sailors seeking a safe port in a typhoon 🌊.
⚡️⚡️⚡️ XAUUSD ⚡️⚡️⚡️
🚀 Buy@ 3340 - 3360
🚀 TP 3400 - 3450
Accurate signals are updated every day 📈 If you encounter any problems during trading, these signals can serve as your reliable guide 🧭 Feel free to refer to them! I sincerely hope they'll be of great help to you 🌟 👇

BTC - Another Potential Bearish PatternHere I present my second alternative for a Bearish case for Bitcoin.
Per my previous posts I explain in detail the interest in recollecting liquidity in these lower zones. Previously I presented pathways to the uber lows at 7,000-10,000 - however this is another possible case.
I believe Bitcoin can see a drop from 109,200 straight down to 19,000-20,000
Why?
1. Major Volume support at this level
2. Major liquidity pools in confluence with this level
3. Price would form a W bottom with a higher low - which aligns with DXY breaking down on the monthly time frame. We can use DXY to project a bull market spanning 2-5 years (weakening dollar = more interest in deflationary assets such as Bitcoin)
4. Per the note above, it’s unlikely that BTC continues straight up without a sharp drop. The way this market works is to a large degree with leverage trading. The market and exchanges desperately want to shake out these longs, especially if we consider a 2-5 year bullish forecast through a macro view.
5. Confluence with this diagonal trendline which shows a clear support / resistance structure (note the Bitcoin chart is formed via diagonal ascending support and resistance lines - we can demonstrate this clearly and repeatable by duplicating the correct trendline and seeing how it forms the chart at any location)
Personally, I am shorting Bitcoin from 109,000 - and am expecting to see a fast drop through the rest of the weekend.
I will watch what the price does, where it reacts and interacts, and attempt to get a head start on understanding the true bottom before this “true” bull cycle begins.
Happy trading

USD/JPY - H1 - Channel Breakout (17.05.2025) The Pair on the H1 timeframe presents a Potential Selling Opportunity due to a recent Formation of a Channel Breakout Pattern. This suggests a shift in momentum towards the downside in the coming hours.
Possible Short Trade:
Entry: Consider Entering A Short Position around Trendline Of The Pattern.
Target Levels:
1st Support – 142.40
2nd Support – 140.17
🎁 Please hit the like button and
🎁 Leave a comment to support for My Post !
Your likes and comments are incredibly motivating and will encourage me to share more analysis with you.
Best Regards, KABHI_TA_TRADING
Thank you.
Disclosure: I am part of Trade Nation's Influencer program and receive a monthly fee for using their TradingView charts in my analysis.

USDJPY COT and Liquidity AnalysisHey what up traders welcome to the COT data and Liquidity report. It's always good to go with those who move the market here is what I see in their cards. I share my COT - order flow views every weekend.
🎯 Non Commercials added 6K longs nad just 300 shorts, I still see a price coming higher but, first liquidity is lower so it makes more sense to close shorts on lower prices and overall still the exposure seems more bearish.
📍Please be aware that institutions report data to the SEC on Tuesdays and data are reported on Fridays - so again we as retail traders have disadvantage, but there is possibility to read between the lines. Remember in the report is what they want you to see, that's why mostly price reverse on Wednesday after the report so their cards are hidden as long as possible. However if the trend is running you can read it and use for your advantage.
💊 Tip
if the level has confluence with the high volume on COT it can be strong support / Resistance.
👍 Hit like if you find this analysis helpful, and don't hesitate to comment with your opinions, charts or any questions.
Analysis done on the Tradenation Charts
Disclosure: I am part of Trade Nation's Influencer program and receive a monthly fee for using their TradingView charts in my analysis.
"Adapt what is useful, reject what is useless, and add what is specifically your own."
— David Perk aka Dave FX Hunter ⚔️

USDCAD: Price Approaching Buying Zone, Will DXY Bounce Back? The USDCAD pair has dropped significantly in recent times, particularly as the DXY index has plummeted. The extremely bearish nature of the DXY suggests that the price of USDCAD is melting. Both fundamental and technical indicators indicate a potential bullish price reversal for this pair, which could potentially hit our first take-profit area. This is a swing analysis, so please give time for the trade to get activated and for it to work out in our favour.
Please note that this analysis does not guarantee that the price will move as suggested. Before trading, it’s essential to conduct your own research.
If you’d like to assist us, we encourage you to consider the following actions:
- Like our ideas
- Provide comments on our ideas
- Share our ideas
Kind regards,
Team Setupsfx_
Much love ❤️🚀

Bitcoin (BTC/USD) 1H Chart Analysis – Double Top Signals BearishPattern Formed: DOUBLE TOP
⚠️ Bearish Reversal Pattern Spotted!
📍 Formed near 111,794.8
⬆️ Price tested the top twice and failed – strong resistance confirmed!
Key Zones:
🔶 SUPPLY ZONE (Resistance):
🟧 111,794.8 - 111,829.8
🔼 Expect selling pressure here!
🔷 SUPPORT Zone (Broken!):
🔻 Price fell below this level, confirming a bearish breakout
🟩 TARGET ZONE:
🎯 102,500.0
✅ This is the likely drop target based on the pattern
🧊 Other minor supports:
* 102,820.6
* 102,750.8
* 102,227.0.
Indicators:
📈 Trend Line
* Supported the price during the uptrend
* ❌ Now broken — indicates momentum shift
📉 EMA 70 (Red Line)
* Current Price (108,238.6) is below EMA 70 = 109,245.0
* Indicates bearish pressure.
Trade Setup:
🔽 Short Entry Idea: After support break
🛑 Stop Loss: 111,829.8
🎯 Take Profit: 102,500.0
⚖️ Risk-Reward looks attractive!
Summary:
📉 Bearish bias confirmed by:
* Double Top pattern
* Supply zone rejection
* Support break
* EMA crossover
🚨 Traders Watch Out: Bears are in control — next major stop likely at 102,500.0!

GOLD 1. Middle East Tensions: Israel-Iran Conflict
Multiple credible reports indicate that Israel is preparing to strike Iranian nuclear facilities. This has sharply increased market anxiety about a potential escalation in the Middle East, which could provoke retaliation from Iran and destabilize the region.
Such developments are classic drivers of safe-haven demand, pushing investors toward gold as a protective asset.
2. US Political and Fiscal Uncertainty
President Trump’s major fiscal bill is facing strong opposition in Congress, creating uncertainty about US economic policy and fiscal stability.
Moody’s recent downgrade of US government debt due to rising debt levels has further shaken investor confidence in the US dollar and US assets, adding to gold’s appeal as a store of value.
3. Ongoing Russia-Ukraine War
While there are reports of possible ceasefire talks between Russia and Ukraine, the situation remains unresolved and unpredictable, keeping geopolitical risk elevated.
4. Other Global Flashpoints
China’s military drills near Taiwan and ongoing tensions between China and the US (including trade and technology restrictions) continue to add to the global risk environment.
The conflict between Palestine and Israel and instability in Syria also contribute to the overall geopolitical risk premium priced into gold.
Market Impact and Outlook
Gold is currently trading above $3,350/oz, with strong technical momentum and safe-haven inflows. With the current middle east tension escalation we could easily breakout from the descending trendline to touch 3440 zone and approach 3500$ or more
Even if there is no immediate escalation, the combination of persistent geopolitical risks, US fiscal uncertainty, and a weaker US dollar is likely to keep gold prices well-supported in the short term.
Correlation Between DXY, Bond Yields, Bond Prices, and Gold Prices
1. DXY (US Dollar Index) and Gold Price: Inverse Correlation
Gold and the US dollar historically move in opposite directions. When the DXY strengthens, gold typically weakens, and when the dollar weakens, gold prices rise.
This is because gold is priced in USD globally, so a stronger dollar makes gold more expensive for holders of other currencies, reducing demand.
However, in 2023–2024, an unusual phenomenon occurred where both gold and the dollar rose simultaneously due to geopolitical tensions and central bank gold buying by countries like China and Russia, which supported gold despite a strong dollar.
2. Bond Yields and Gold Price: Generally Negative Correlation, but Context-Dependent
Rising nominal government bond yields (e.g., US 10-year Treasury yields) usually put downward pressure on gold because higher yields increase the opportunity cost of holding non-yielding gold.
However, during periods of inflation concerns, geopolitical risk, or fiscal uncertainty, gold can rise alongside rising yields as investors seek inflation hedges and safe havens.
Real interest rates (nominal yields minus inflation) are particularly important; when real rates are low or negative, gold’s appeal increases.
3. Bond Prices and Gold Price: Positive Correlation
Bond prices move inversely to yields. When bond prices fall (yields rise), gold often faces downward pressure due to higher opportunity costs. Conversely, when bond prices rise (yields fall), gold tends to benefit.
However, instability and volatility in bond markets can increase gold’s safe-haven demand, supporting prices despite yield moves.
Summary Table
Asset Pair Typical Correlation with Gold Explanation
Gold vs. DXY Negative Strong USD makes gold more expensive globally
Gold vs. Bond Yields Negative (usually) Higher yields raise opportunity cost of gold
Gold vs. Bond Prices Positive Rising bond prices (falling yields) support gold
Additional Influences on Gold Prices in 2025
Geopolitical tensions (Russia-Ukraine, Middle East) and safe-haven demand have supported gold even when the dollar was strong.
Central bank gold purchases by China, Russia, and emerging markets have provided structural support.
Fiscal concerns in the US, including rising debt and recent tax legislation, have increased inflation hedging demand for gold.
Volatility in bond markets and real interest rates remaining low or negative have further boosted gold’s appeal.
Conclusion
Gold prices are influenced by a complex interplay between the US dollar, bond yields, and bond prices:
A stronger dollar typically pressures gold lower, but geopolitical risks and central bank buying can override this.
Rising bond yields usually weigh on gold, but inflation fears and fiscal uncertainty can cause gold to rise alongside yields.
Bond price volatility and low real rates support gold as a safe haven and inflation hedge.
This nuanced relationship explains why gold in 2025 has shown resilience and even strength amid dollar fluctuations and bond market volatility.

Automate Gold Trading with Machine Learning and LLMS: FULL Guide🚀 Harnessing Machine Learning and Large Language Models (LLMs) to Automate Gold Trading: A Practical Guide
Gold 🥇 has long been considered a safe-haven asset and a cornerstone of investment portfolios worldwide. The advent of advanced technologies like machine learning (ML) 🤖 and large language models (LLMs) 🧠 has opened new avenues for automating gold trading, enhancing accuracy, and improving profitability.
🌟 Why Automate Gold Trading with ML and LLMs?
Machine learning algorithms excel at detecting complex patterns, analyzing vast amounts of market data swiftly, and predicting price movements more reliably than traditional methods. LLMs, such as GPT-4, further augment trading strategies by interpreting news sentiment, macroeconomic data, and global geopolitical events in real-time, offering nuanced insights into gold market movements.
🛠️ Step-by-Step Practical Implementation
1. 📊 Data Acquisition and Preparation:
Historical gold price data (open, close, high, low).
Economic indicators: inflation rates 📈, currency valuations (USD strength 💵), and interest rates 📉.
News sentiment analysis 📰 derived from financial headlines using GPT-4.
Example Application:
Use APIs like Alpha Vantage or Yahoo Finance to pull historical gold prices.
Integrate financial news from Bloomberg or Reuters and summarize sentiments using GPT-4 API.
2. 🎯 Choosing the Right ML Model:
Time Series Forecasting Models: LSTM ⏳ (Long Short-Term Memory), GRU 🔄 (Gated Recurrent Units).
Classification Models: Random Forest 🌳, Gradient Boosting Machines (GBM), and XGBoost 🚀 for predicting upward/downward price movements.
Example Application:
Use Python libraries such as TensorFlow, Keras, and XGBoost to build and train these models.
Predict price changes for the next trading session to make informed entry and exit decisions.
3. 🤖 Integrating Large Language Models (LLMs):
Employ GPT-4 or similar LLMs to perform real-time sentiment analysis on financial news.
Translate sentiment results into numerical signals (e.g., +1 positive, 0 neutral, -1 negative).
Example Application:
Daily analyze major news headlines related to gold using GPT-4 to capture market sentiment.
Incorporate these signals into your ML model to refine price movement predictions.
4. 📈 Training and Validation:
Train models on historical datasets using cross-validation to prevent overfitting.
Optimize parameters using genetic algorithms 🧬 or grid search techniques.
Example Application:
Use scikit-learn’s GridSearchCV or genetic algorithms in libraries like DEAP for parameter tuning.
5. ⚙️ Automating Trades with Expert Advisors (EA) on MetaTrader 5:
Integrate ML and LLM-derived signals into MetaTrader 5 Expert Advisors.
Implement position-sizing logic, risk management, and automatic lot scaling.
Example Application:
Write custom MQL5 scripts that execute trades based on ML model predictions and sentiment analysis outputs.
Dynamically adjust position size based on account equity and market volatility.
🛡️ Practical Considerations for Robustness
Risk Management: Always integrate dynamic stop-losses 🛑, trailing stops, and overall account-level risk management.
Flat Market Detection: Employ advanced techniques like Hurst Exponent, ADX/DMI compression, or Bollinger Band squeezes 🔍.
Continuous Optimization: Regularly retrain models and update sentiment analysis parameters.
🌐 Benefits of Combining ML and LLMs
Enhanced predictive accuracy 📈 through combined numerical and textual data analysis.
Improved adaptability 🔄 in dynamic market conditions.
Reduced emotional bias 😌 and human errors in trading.
⚠️ Challenges and Solutions
Data Quality and Overfitting: Rigorous preprocessing and cross-validation.
Market Regime Shifts: Continuous monitoring and periodic recalibration of models.
📌 Real-World Application Examples
Example 1:
Combine sentiment analysis with price data to predict significant market movements around economic announcements (e.g., Fed rate decisions).
Example 2:
Deploy an ML-driven EA on MetaTrader 5, adjusting positions based on both predictive analytics and real-time news sentiment shifts, significantly improving trade timing and results.
Example 3:
Use an adaptive ML model that retrains weekly with the latest market data, ensuring the trading algorithm remains relevant to current market conditions.
🎉 Conclusion
Automating gold trading using machine learning and LLMs presents an exciting frontier for traders. By leveraging these technologies, traders can significantly enhance decision-making, effectively manage risk, and achieve consistent profitability. The future of gold trading automation lies in blending cutting-edge algorithms with insightful real-time analysis, making now the perfect time to integrate ML and LLMs into your trading toolkit. 🥇🤖💹

Critical Resistance Ahead–Will Gold Confirm the Bullish Reversal🔶 What happened last week on Gold (XAUUSD)?
Last week was an excellent one for Gold bulls – the price surged by nearly 1500 pips, fully recovering the drop from the 12–16 May week.
Looking at the chart, the decline from the last ATH at 3500 appears clearly corrective, forming a classic ABC 3-wave pattern which now seems complete.
Gold is currently testing a major confluence resistance zone, aligned with:
• The 17 April ATH
• The end-of-April resistance
• And the early May support
Also worth noting: this week’s breakout above resistance followed the formation of an ascending triangle, which is typically bullish.
________________________________________
❓ Key question – Will the bullish move continue, or will price reject from here?
________________________________________
🔍 Why a bullish continuation is probable:
1. The ABC corrective structure seems to have ended.
2. Price broke out after an ascending triangle – a bullish signal.
3. The broader structure still leans bullish after the ATH at 3500.
________________________________________
⚠️ But this resistance zone is critical:
• Without a clear breakout above 3360 zone, bulls don’t have full control.
• A drop below 3300 would shift momentum back to the bears, with 3360 becoming a potential lower high.
________________________________________
🧭 My Trading Plan:
✅ I favor a bullish scenario, aiming for:
• 3430
• 3500 (ATH retest)
❌ This outlook gets invalidated if price falls below 3300 – in that case, I’ll reassess for more downside.
________________________________________
🚀 The market must confirm the direction. We’re just here to read the map.
Disclosure: I am part of Trade Nation's Influencer program and receive a monthly fee for using their TradingView charts in my analyses and educational articles.

XMRUSDT broke resistance, waiting for consolidation XMRUSDT is consolidating against the background of an upward (bullish) trend. The coin reacted weakly to yesterday's bitcoin pullback and is testing consolidation resistance with the aim of continuing growth
Scenario: at the moment the price makes a breakout of 401.65. Consolidation of the price above the level will confirm the intentions of buyers to go to the intermediate target of 440.0. Price consolidation above the consolidation will strengthen buying, which may trigger growth

HelenP. I Euro will drop from resistance zone to $1.1260 pointsHi folks today I'm prepared for you Euro analytics. After an extended period of consolidation, the price remained trapped inside a narrow range, testing both the upper and lower boundaries multiple times without any decisive breakout. This indecision created a strong horizontal resistance around the 1.1355 - 1.1370 zone, which continues to act as a key obstacle for bulls. Eventually, the price declined sharply and found temporary support along the upward trend line. This area had already proven its significance through multiple touches and rebounds, serving as a strong dynamic support. After touching the trend line once again, buyers stepped in, leading to a moderate recovery in price action. Currently, EURUSD is pushing back toward the resistance zone. However, I don’t see this upward momentum sustaining for long. The previous failures at this level and the weak follow-through from bulls suggest exhaustion. I believe that once price enters the resistance zone, it will face renewed selling pressure. My expectation is a rejection from this area and a move lower, potentially breaking below the previous local lows. That’s why I set my goal at 1.1260 points, a logical target based on the previous swing support and current bearish setup forming just under a key resistance level. If you like my analytics you may support me with your like/comment ❤️
Disclaimer: As part of ThinkMarkets’ Influencer Program, I am sponsored to share and publish their charts in my analysis.

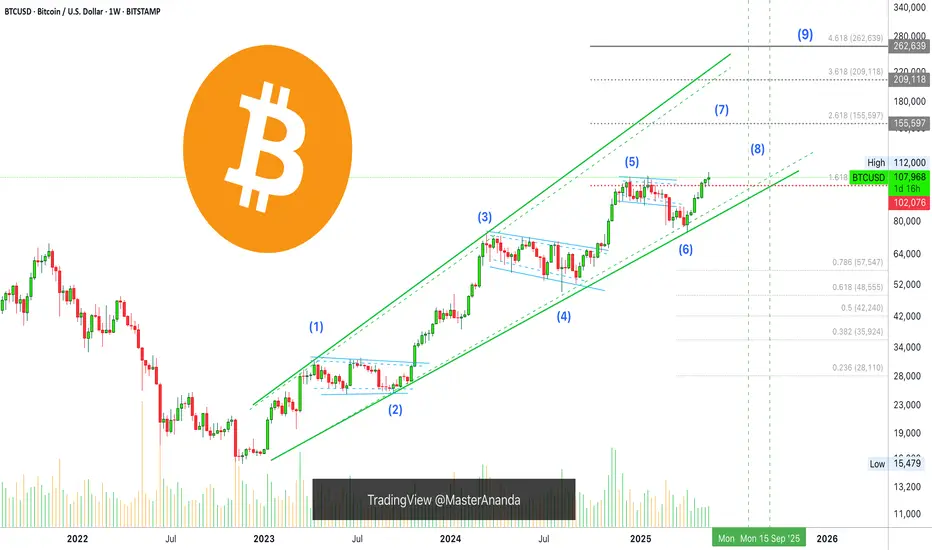
9-Up Waves—Extended Bullish Impulse—Bitcoin's 2025 Bull MarketIn Elliot Wave Theory, a bullish impulse has a total count of 5 waves but this isn't all. There is something called an "extension." Extensions can lead not only to 9 total waves but even 13 waves.
We can easily see this happen if we consider Bitcoin's bull market based on the long-term chart structure, starting in November 2022, see the chart above.
A bull market is defined as a sequence of higher highs and higher lows. This is perfectly visible on this chart. Contrary to many Altcoins, Bitcoin is in a long-term bull market.
If we consider even some of the big Altcoins projects, we can see that no long-term bull market is present, many are producing lower lows, but at the same time, others are producing long-term uptrends like Tron. So there are variations.
Seeing a perfect long-term 5 waves pattern completed when Bitcoin hit $110,000 in January 2025, seeing a strong higher low and the continuation of this trend, we can easily conclude that an extension is taking place.
Will this extension end at 9 waves or 13 waves?
Bitcoin is going up. It is already happening. There will be more.
Thank you for reading.
Namaste.