The Language of Price | Lesson 1 – Candlestick TheoryLesson Focus: Candlestick Types (Theory)
This post introduces the basic concept of candlesticks and how price behavior is visually represented on a chart.
Candlesticks are one of the most fundamental tools in market structure analysis, as they reflect price movement, momentum, and market participation over time.
📘 WHAT IS A CANDLESTICK?
A candlestick represents price activity during a specific time period and shows:
• opening price
• closing price
• highest price
• lowest price
Candlesticks do not predict the future.
They simply describe what has already happened in the market .
Their meaning becomes clearer only when viewed within broader market context.
🧠 CANDLESTICK TYPES SHOWN IN THIS EDUCATION
1️⃣ Shrinking Candles (Uptrend & Downtrend)
Shrinking candle bodies indicate loss of momentum .
Price may continue in the same direction, but with reduced strength and participation.
2️⃣ Change Color Candle (Uptrend & Downtrend)
A color change against the prevailing trend may indicate weakening momentum or a temporary pause .
This reflects hesitation, not a confirmed reversal.
3️⃣ Long Wick Candle (Uptrend & Downtrend)
Long wicks show price rejection .
The market attempted to move further but was pushed back, revealing opposing pressure.
4️⃣ Inverse Long Wick Candle (Uptrend & Downtrend)
Inverse long wicks suggest acceptance in one direction and rejection in the other , often near key levels or during transitions.
5️⃣ Inside Candle (Uptrend & Downtrend)
An inside candle forms within the range of the previous candle .
This represents consolidation, indecision, and temporary balance.
6️⃣ Momentum Candle
• In an uptrend : a strong bearish momentum candle may indicate sellers stepping in
• In a downtrend : a strong bullish momentum candle may indicate buyers stepping in
Momentum candles reflect sudden imbalance , not guaranteed continuation.
📌 EDUCATIONAL PURPOSE
These candlestick examples are theoretical illustrations designed to improve understanding of price behavior and market structure.
This lesson focuses on recognition and understanding, not decision-making.
If you find this educational series useful and would like to continue learning about market structure and price behavior , you may follow to stay updated with future lessons.
ETHICAL & EDUCATIONAL NOTICE
This content is presented solely for educational and analytical purposes , based on historical price data.
It does not promote or encourage any specific trading method, financial instrument, gambling, leverage, margin usage, short selling, or interest-based activity .
Readers are encouraged to align any financial activity with their own ethical, legal, and religious principles .
⚠️ DISCLAIMER
This material is strictly educational and informational .
It does not constitute financial advice, investment recommendations, or trading instructions.
The author does not provide personalized guidance.
Any decisions made based on this content are the sole responsibility of the individual.
Community ideas

Why Holding Bitcoin Beats Trading It for Most PeopleI don’t want to be offensive, but I can speak from experience.
Most people would make more money simply by holding Bitcoin than by trying to leverage trade it.
The data is clear. More than 95% of people lose money in crypto, mainly because of leverage and greed. I do trade Bitcoin as well, with a portion of my capital, and I’m doing fine. In 2025, I had 20 Bitcoin trades with a quite good win ratio:
Trading can work, but only for a small minority, and usually after years of experience.
🧪 Let’s compare it with my HODL portfolio (the bigger part).
I bought Bitcoin back in 2018. Here: The price today is more than 30× above my initial entry. That alone has produced far more gains than active trading over the same period.
🧪 Let’s put this into perspective.
To achieve a 30× return through trading over six years, you would need to generate more than 76% per year, every year. In simple terms, that means turning $10,000 into $300,000 purely through trading. That level of performance would require exceptional skill, discipline, and time, while increasing position size after every trade to compound and avoiding major mistakes.
🧪 And here is the problem — avoiding major mistakes.
Everyone makes mistakes in trading or in predicting the price. I was wrong with my target for this cycle: and I was not alone. In this post from Excavo, we can see how big players and institutions were wrong as well and completely missed the predictions No one can predict the market with 100% accuracy.
⁉️ So why people think they can outsmart the market on lower timeframes?
Because they chase quick gains in altcoins or believe they can make money in the market with leverage. Most can’t. Most lose.
📌 Let’s compare it:
1️⃣ Being wrong as a trader — stress, time wasted on screens, and you are losing money.
2️⃣ Being wrong as a long-term holder — no stress, you have more time to accumulate more BTC into your cold wallet and do almost nothing.
Don’t get me wrong, being a hodler is also not easy. I faced a drop from 69K to 15K. If you don’t understand Bitcoin and don’t have conviction, the FUD news, which often appears near the lows, can destroy you and force you to sell.
If you don’t know much about BTC, I suggest you study it. I’ll give you just three points here, but there is much more.
✅Central banks will not stop printing money; your purchasing power will continuously go down.
✅Bitcoin has a fixed supply of 21 million coins.
Not approximately. Not subject to change. Exactly 21 million.
✅By 2030, 99% of all Bitcoins will be mined. The rest will be mined over the next 100 years.
So what to do?
Of course, we are traders — we are going to trade. But I suggest you separate capital for trading and trade only with that. Never trade your long-term investment.
If you don’t have any physical BTC in your cold wallet, your ultimate goal should be to get to 1 Bitcoin and hold it long term, untouched.
🛡️ Here is how to behave.
On the chart below, I have spotted that BTC is flipping bearish and we could potentially go to 70K, and if a strong bear market hits, I believe it could dip below 50K:
1️⃣ As a trader - I flipped my bias to the bearish side and took a few shorts recently on a crypto exchange.
2️⃣ As an investor - I do nothing. I will be DCAing and building my long-term position. Remember, by 2030, 99% of BTC will be mined. M2 money supply will expand. Block rewards will be halved. The price will most likely be much higher.
I promised myself I’d become the person I once needed the most as a beginner. Below are links to a powerful lessons I shared on Tradingview. Hope it can help you avoid years of trial and error I went thru.
📊 Sharpen your trading Strategy
⚙️ 100% Mechanical System - Complete Strategy
🔁 Daily Bias – Continuation
🔄 Daily Bias – Reversal
🧱 Key Level – Order Block
📉 How to Buy Lows and Sell Highs
🎯 Dealing Range – Enter on pullbacks
💧 Liquidity – Basics to understand
🕒 Timeframe Alignments
🚫 Market Narratives – Avoid traps
🐢 Turtle Soup Master – High reward method
🧘 How to stop overcomplicating trading
🕰️ Day Trading Cheat Code – Sessions
🇬🇧 London Session Trading
🔍 SMT Divergence – Secret Smart Money signal
📐 Standard Deviations – Predict future targets
🎣 Stop Hunt Trading
💧 Liquidity Sweep Mastery
🔪 Asia Session Setups
🧠 Level Up your Mindset
🛕 Monk Mode – Transition from 9–5 to full-time trading
⚠️ Trading Enemies – Habits that destroy success
🔄 Trader’s Routine – Build discipline daily
💪 Get Funded - $20 000 Monthly Plan
🧪 Winning Trading Plan
🛡️ Risk Management
🏦 Risk Management for Prop Trading
📏 Risk in % or Fixed Position Size
🔐 Risk Per Trade – Keep consistency
Adapt useful, Reject useless and add what is specifically yours.
David Perk

Stop Getting Trapped: How Smart Money Manipulates the MarketWhat's up traders! 👋
Tired of always playing catch-up? The real action is with smart money—the pros who move the market. Learn how to spot their moves, track liquidity, and catch the big waves before they crash. Ready to trade like a pro? Let's dive in.
What is Smart Money?
Smart money refers to the capital controlled by financial institutions, hedge funds, and professional investors who have more information, capital, and resources than individual retail traders. These players drive the market with calculated, informed decisions, creating price movements that less experienced traders often follow without understanding the full context.
Key Components of Smart Money Concept
The Smart Money Concept is not a single indicator or formula. Instead, it’s a framework that helps traders decode the market’s true intention. Here are the key principles that define SMC trading:
Market Structure
By analyzing patterns such as higher highs and higher lows in uptrends, or lower highs and lower lows in downtrends, traders identify trend direction. A critical concept here is the Break of Structure (BOS), where price breaks through established patterns, indicating a potential trend reversal or continuation.
Liquidity Pools and Stop Hunts
Smart money players often seek liquidity pools, typically formed by retail traders' stop-loss orders. These areas are targeted to ensure large transactions can be completed with minimal slippage. Retail traders are often caught off guard when their stop-losses are triggered, allowing institutions to capitalize on this liquidity sweep.
Order Blocks
Order blocks are zones where large institutions have previously placed significant buy or sell orders. These areas often act as support or resistance levels in the future. Recognizing these zones gives traders an edge in predicting where price may react and reverse.
Fair Value Gaps
Fair Value Gaps (FVGs) occur when there is an imbalance between aggressive institutional orders and slower retail participation. These gaps often indicate that price will revisit these areas to fill the void left by unexecuted trades. Smart money traders use these imbalances to plan entries and exits.
How to Trade Smart Money?
The key to trading using the Smart Money Concept lies in understanding where institutional traders are likely to be active and when their movements will influence the broader market. Here’s how to apply SMC principles in practice:
Identify Market Structure: Look for clear trend direction and structural shifts, such as Breaks of Structure (BOS) or Changes of Character (ChoCH).
Spot Liquidity Pools: Identify where retail traders place stop-losses and anticipate institutional activity around these zones.
Look for Order Blocks: Analyze historical price action to locate institutional entry zones.
Monitor Fair Value Gaps: Track price imbalances caused by institutional activity and anticipate price revisits.
While retail traders react to price movement using lagging indicators, smart money traders lead the market. They exploit retail behavior, push price toward liquidity zones, and reverse direction once sufficient liquidity has been collected. This interaction between retail and institutional participants is the core of the Smart Money Concept.
By reading market structure, liquidity zones, and institutional behavior, traders can make more informed decisions and improve their edge. However, always remember — no strategy is foolproof. Apply your own analysis, manage risk carefully, and stay adaptable. The market rewards those who think ahead.

Understanding the Metals Market1. Types of Metals
The metals market is broadly categorized into two segments: precious metals and industrial metals.
Precious Metals: These include gold, silver, platinum, and palladium. They are considered valuable due to their rarity and historical use as a store of wealth. Precious metals are often used in jewelry, electronics, and as financial hedges against inflation and currency risks.
Industrial Metals: These include copper, aluminum, zinc, nickel, and lead. They are widely used in construction, automotive, and manufacturing sectors. Their prices are influenced by global economic activity and industrial demand.
2. Market Participants
The metals market is complex and involves multiple participants, each with different objectives:
Producers: Mining companies extract metals from the earth and sell them to refiners or directly to industrial users. Examples include BHP, Rio Tinto, and Vale.
Consumers: Industrial users, such as construction firms, electronics manufacturers, and automotive companies, purchase metals for production.
Investors: Individuals and institutions invest in metals to diversify their portfolios, hedge risks, or speculate on price movements. Investment channels include physical metals, futures contracts, ETFs, and mutual funds.
Speculators and Traders: Traders in commodities exchanges and over-the-counter (OTC) markets buy and sell metals to profit from price fluctuations. They provide liquidity to the market.
Governments and Central Banks: Central banks often hold gold reserves, which can influence global prices, while governments regulate mining and trade policies.
3. How Metals Are Traded
Metals can be traded in physical or financial markets:
a. Physical Market
In the physical market, metals are bought and sold in their actual form, such as bars, coins, or sheets. This market is essential for industrial use and jewelry manufacturing. Prices in the physical market are influenced by immediate supply and demand, logistics, and quality specifications.
b. Futures Market
Futures contracts are standardized agreements to buy or sell a metal at a predetermined price on a future date. Futures are traded on commodities exchanges such as the London Metal Exchange (LME) or COMEX in New York. They allow producers and consumers to hedge against price volatility, while traders can speculate on price movements.
c. Spot Market
The spot market involves the immediate buying and selling of metals for delivery “on the spot,” usually within two business days. Spot prices reflect real-time supply and demand conditions.
d. Exchange-Traded Funds (ETFs) and Derivatives
Investors can gain exposure to metals without physically owning them. ETFs track the price of metals, while options and swaps allow for complex financial strategies. These instruments increase liquidity and provide more ways to hedge or speculate.
4. Factors Influencing Metals Prices
The prices of metals are influenced by a combination of fundamental, economic, and geopolitical factors.
a. Supply Factors
Mining Output: Production levels from major mining countries directly impact supply. Strikes, natural disasters, or political instability can reduce output.
Inventory Levels: Stockpiles in warehouses and exchanges can buffer supply disruptions, affecting market prices.
b. Demand Factors
Industrial Demand: Construction, automotive, electronics, and renewable energy projects drive demand for industrial metals.
Investment Demand: Economic uncertainty and inflation often push investors toward precious metals as a safe haven.
Technological Trends: Advancements in technology, such as electric vehicles, increase demand for certain metals like lithium and nickel.
c. Economic and Financial Factors
Interest Rates: Higher interest rates tend to reduce investment demand for non-yielding assets like gold.
Currency Movements: Metals are usually priced in U.S. dollars. A stronger dollar makes metals more expensive for other currencies, reducing demand.
Global Growth: Economic expansion increases demand for industrial metals, while recessions reduce it.
d. Geopolitical and Environmental Factors
Trade Policies: Tariffs and export restrictions can limit supply or increase costs.
Environmental Regulations: Mining regulations and sustainability concerns can affect production.
Global Conflicts: Wars or sanctions in metal-producing regions can create supply shocks.
5. Key Metal Markets and Exchanges
Several global exchanges facilitate metal trading:
London Metal Exchange (LME): The world’s largest market for industrial metals, including copper, aluminum, and zinc.
COMEX (New York): Focused mainly on precious metals like gold and silver.
Shanghai Futures Exchange (SHFE): Important for the Chinese market, trading metals like copper, aluminum, and steel.
Multi Commodity Exchange (MCX) in India: Trades metals such as gold, silver, copper, and aluminum for the Indian market.
These exchanges provide standardized contracts, clearing mechanisms, and transparent pricing, which help stabilize the market.
6. Role of Speculation and Hedging
Speculation and hedging are two primary motivations in metals trading:
Hedging: Producers and consumers use futures and options to lock in prices and reduce exposure to market volatility. For example, a copper producer may sell futures contracts to secure a future price, protecting against a potential price drop.
Speculation: Traders aim to profit from price fluctuations. Speculators provide liquidity and can sometimes amplify price movements, creating volatility in short-term markets.
7. Metals as an Investment
Metals, especially precious metals, are considered safe-haven assets. They protect against currency depreciation, inflation, and market instability. Investors can choose to:
Buy Physical Metals: Gold coins, silver bars, or bullion.
Invest in ETFs: Track metal prices without owning physical metal.
Trade Futures and Options: For more advanced strategies and leverage.
Invest in Mining Stocks: Gain exposure to metal production and potential profits from rising prices.
Diversifying into metals can help balance a portfolio and reduce risk, particularly during economic uncertainty.
8. Challenges in the Metals Market
Despite its importance, the metals market faces challenges:
Price Volatility: Metal prices can be highly volatile due to supply shocks, economic changes, or speculative trading.
Environmental Concerns: Mining operations often face strict environmental regulations and societal pressure.
Geopolitical Risks: Metals sourced from politically unstable regions can face supply disruptions.
Technological Shifts: The rise of alternative materials can reduce demand for certain metals.
9. Future Trends in the Metals Market
The metals market is evolving with global trends:
Green Energy Transition: Increased demand for metals like lithium, cobalt, and nickel for batteries and renewable energy technologies.
Digitalization: Improved trading platforms and real-time analytics are transforming metal trading.
Sustainability: Responsible mining practices and recycling of metals are becoming crucial.
Global Supply Chain Shifts: New mining projects in Africa, South America, and Asia are changing the global supply dynamics.
Conclusion
The metals market is a complex and dynamic system that reflects global economic trends, industrial demand, and investor sentiment. Understanding the types of metals, key market participants, trading mechanisms, and influencing factors is essential for anyone involved in investing, industry, or policy. While opportunities in this market are abundant, they come with risks, requiring careful analysis, monitoring of global trends, and strategic decision-making. As the world transitions toward sustainable energy and technology-driven growth, the metals market will continue to play a pivotal role in shaping the global economy.

Selection and Focus
Hello, traders.
By "Following," you'll always receive the latest information quickly.
Have a great day.
-------------------------------------
We are always at a crossroads.
We choose which instruments and coins (tokens) to trade and take responsibility for that choice.
You can see in the chart above that the price has fallen back to near the HA-Low indicator on the 1W chart.
And, the 1D chart shows a stepwise downward trend.
In other words, the price fell below the HA-High indicator, exhibiting a normal decline, and then encountered the HA-Low indicator, forming a stepwise downtrend.
A normal downtrend is formed from a high and then declines, while a stepwise downtrend is formed from a low and then renewed.
While both types of downtrends ultimately represent the same decline, the difference is that in a stepwise downtrend, you can choose the criteria for entering a trade.
Therefore, we can look for charts where a stepwise downtrend transitions to an uptrend and trade based on whether support and resistance are present.
Looking at this example chart, the price fell below the HA-High indicator on August 14th and then exhibited a normal downtrend.
Then, on October 10th, it fell below the HA-Low indicator, forming a stepwise downtrend.
Looking at the larger 1W chart, we can see that the price has been in a normal downtrend since February 3rd, falling below the HA-High indicator.
Then, after October 6th, it touched the HA-Low indicator, indicating that it had reached a low.
It appears to be currently testing support near the HA-Low indicator level of 0.00544.
Therefore, whether support is found near the HA-Low indicator level of 0.00544-0.00611 on the 1W and 1D charts indicates a different meaning from the stepwise decline seen so far.
However, the point at which the downtrend turns into an uptrend and the uptrend is likely to begin is when the price rises above 0.01090 and holds, giving us time to decide on a trade.
Therefore, we can buy when the price rises after finding support in the 0.00544-0.01090 range.
The buy zone, or support zone, is too wide, making it difficult to trade.
In this case, we buy when the price rises after finding support in the key zone, such as the 0.00544-0.00611 range or near 0.01090.
Most traders are afraid to buy at the lowest price, so they will buy when the price rises to around 0.01090.
This phenomenon is called a breakout trade.
In other words, the psychological pressure to buy arises when the price breaks above 0.01090.
Therefore, you should buy when the price rises after finding support in the DOM(-60) ~ HA-Low range, and sell some of the gains, gradually buying during a stepwise downtrend.
By leaving behind coins (tokens) that represent profits, you can reduce the burden of buying at the bottom.
However, if you're not familiar with day trading, you may continue to use your investment funds to buy.
However, don't be afraid of this.
This is because the start of a stepwise downtrend means that the likelihood of a bullish turn has increased.
What you should be afraid of is the HA-High ~ DOM(60) range, i.e., when you buy during the high and then the downtrend begins.
This is because you don't know how far the decline will go.
Only when you encounter the DOM(-60) or HA-Low indicators will you know the end of the decline is near.
Therefore, you need to understand the current position of your chosen asset or coin (token) and consider how to set your trading timing and how to proceed with the trade.
------------------------------------------------------------------
From this perspective, looking at the BTC chart reveals the significance of its current position.
In other words, if the price declines from the current position, it marks the beginning of a stepwise downtrend. If it rises, it indicates the possibility of an upward trend until it encounters the HA-High or DOM(60) indicator.
The M-Signal indicator on the 1M chart passes through this crucial crossroads, making it even more crucial.
The same holds true for the ETH chart.
Therefore, rather than focusing on whether the price will rise or fall, you should check for support near the established low point, i.e., the DOM(-60) to HA-Low range, and respond accordingly by making split purchases.
In other words, trading that leaves behind the coins (tokens) that represent profits from day trading is a useful strategy.
If you're not familiar with day trading, you should purchase at the lowest possible price between DOM(-60) and HA-Low.
Since these purchases should be made every time a cascading downtrend occurs, it's best to purchase in small amounts.
If you find a profitable purchase price within the DOM(-60) to HA-Low range on a certain day, you can sell the amount of each purchase price, leaving the coins (tokens) that represent profits.
It sounds simple, but actually executing a trade is not easy.
Therefore, this trading method (leaving coins corresponding to profits) should be practiced during a cascading downtrend to become familiar with it.
Therefore, until you become accustomed to it, trade with small amounts of capital.
-
Thank you for reading to the end.
I wish you successful trading.
--------------------------------------------------

Kevin Warsh vs. Kevin Hassett: Who Is More Dovish?As the Federal Reserve has lowered the federal funds rate to 3.75% and initiated a technical QE after ending its QT program, January 2026 will be directly influenced by Donald Trump’s monetary choice regarding Jerome Powell’s successor, who will take office in May 2026.
The U.S. President is expected to announce his decision at the beginning of next year, and according to the latest available consensus data, the choice should be between Kevin Hassett and Kevin Warsh. The Fed has adopted a more accommodative trajectory by modestly re-expanding its balance sheet (through short-term bond purchases to ensure the smooth functioning of the money market and interbank market), but the upcoming cycle for the federal funds rate remains uncertain and will depend on U.S. employment data (NFP reports) and inflation data (PCE & CPI) published in January and February.
However, it is essential to keep in mind that markets will also be heavily influenced by the “Shadow Fed Chair” appointed in January, who will officially take office in the spring.
Which of Kevin Hassett or Kevin Warsh can be considered the more accommodative in terms of future monetary policy?
Kevin Hassett currently appears as the most clearly “dovish” candidate from a market perspective. His profile is that of a growth-oriented economist, highly sensitive to the effects of financial conditions on investment, the labor market, and asset valuations. Historically, Hassett has consistently argued that monetary policy should remain flexible and pragmatic, even if that means tolerating periods of inflation slightly above target in order to avoid an excessive tightening of financial conditions. In the current environment, marked by high public debt and increased market dependence on global liquidity, his approach is perceived as supportive of a continued accommodative bias, or at least a very gradual normalization of real interest rates.
Kevin Warsh represents a far more orthodox and disciplined monetary stance. A former Fed governor, he has often expressed reservations about prolonged unconventional policies, arguing that massive QE contributed to significant distortions in financial markets and poor capital allocation. While he remains aware of current systemic constraints, Warsh would be more inclined to limit the expansion of the Fed’s balance sheet and prioritize anti-inflation credibility, even at the cost of increased volatility in equity markets.
The contrast between these two profiles is therefore central to the future trajectory of risk assets. A choice in favor of Kevin Hassett would reinforce the scenario of a “market-friendly” Fed, maintaining favorable liquidity conditions and implicitly supporting valuation multiples, particularly on the S&P 500. Conversely, the appointment of Kevin Warsh would introduce a more restrictive medium-term bias, with a risk of reassessing rate expectations and capping the upward momentum of equity markets.
DISCLAIMER:
This content is intended for individuals who are familiar with financial markets and instruments and is for information purposes only. The presented idea (including market commentary, market data and observations) is not a work product of any research department of Swissquote or its affiliates. This material is intended to highlight market action and does not constitute investment, legal or tax advice. If you are a retail investor or lack experience in trading complex financial products, it is advisable to seek professional advice from licensed advisor before making any financial decisions.
This content is not intended to manipulate the market or encourage any specific financial behavior.
Swissquote makes no representation or warranty as to the quality, completeness, accuracy, comprehensiveness or non-infringement of such content. The views expressed are those of the consultant and are provided for educational purposes only. Any information provided relating to a product or market should not be construed as recommending an investment strategy or transaction. Past performance is not a guarantee of future results.
Swissquote and its employees and representatives shall in no event be held liable for any damages or losses arising directly or indirectly from decisions made on the basis of this content.
The use of any third-party brands or trademarks is for information only and does not imply endorsement by Swissquote, or that the trademark owner has authorised Swissquote to promote its products or services.
Swissquote is the marketing brand for the activities of Swissquote Bank Ltd (Switzerland) regulated by FINMA, Swissquote Capital Markets Limited regulated by CySEC (Cyprus), Swissquote Bank Europe SA (Luxembourg) regulated by the CSSF, Swissquote Ltd (UK) regulated by the FCA, Swissquote Financial Services (Malta) Ltd regulated by the Malta Financial Services Authority, Swissquote MEA Ltd. (UAE) regulated by the Dubai Financial Services Authority, Swissquote Pte Ltd (Singapore) regulated by the Monetary Authority of Singapore, Swissquote Asia Limited (Hong Kong) licensed by the Hong Kong Securities and Futures Commission (SFC) and Swissquote South Africa (Pty) Ltd supervised by the FSCA.
Products and services of Swissquote are only intended for those permitted to receive them under local law.
All investments carry a degree of risk. The risk of loss in trading or holding financial instruments can be substantial. The value of financial instruments, including but not limited to stocks, bonds, cryptocurrencies, and other assets, can fluctuate both upwards and downwards. There is a significant risk of financial loss when buying, selling, holding, staking, or investing in these instruments. SQBE makes no recommendations regarding any specific investment, transaction, or the use of any particular investment strategy.
CFDs are complex instruments and come with a high risk of losing money rapidly due to leverage. The vast majority of retail client accounts suffer capital losses when trading in CFDs. You should consider whether you understand how CFDs work and whether you can afford to take the high risk of losing your money.
Digital Assets are unregulated in most countries and consumer protection rules may not apply. As highly volatile speculative investments, Digital Assets are not suitable for investors without a high-risk tolerance. Make sure you understand each Digital Asset before you trade.
Cryptocurrencies are not considered legal tender in some jurisdictions and are subject to regulatory uncertainties.
The use of Internet-based systems can involve high risks, including, but not limited to, fraud, cyber-attacks, network and communication failures, as well as identity theft and phishing attacks related to crypto-assets.

CRUDE OIL: No-Bias Trading Oil option traders are bracing for increased volatility by buying synthetic Straddles: Long OTM Call + Short Future.
Being market-neutral, it’s a pure volatility play: it earns on price action in either direction. Once it hits the profit target, owner can close it or manage
This isn't a unique story. Such portfolios frequently appear in the market when favorable situations arise, including those that are 'graphically convenient' (look closely at the chart and answer the question: will the price linger at this level for long? Probably not, it'll move somewhere). Options allow you to profit from these chart setups without worrying about the direction of the price move. Cool, right?
Bottom line:
this post is primarily educational, rather than sentiment-revealing. However, we also shouldn't ignore such 'market-neutral portfolios' in our analysis.▶️ If the professional players aren't sure where the market is headed next, maybe we shouldn't overstate our own humble abilities either.

'Two Charts, Same Pattern, Totally Different Market - Here's Why🔥 THE DEEPEST TRUTH MOST TRADERS NEVER LEARN: CONTEXT IS THE MARKET’S REAL LANGUAGE
If you stare at enough charts, you’ll start to see a pattern problem — and it’s destroying traders every single day. Everyone wants to react to what price looks like, instead of learning how price behaves.
Two charts can look exactly the same — same pattern, same shape, same pullback, same consolidation, same breakout — and still produce completely opposite outcomes.
Why?
Because context isn’t visual.
Context is structural.
Context is narrative.
Context is market psychology expressed through order flow.
A lot of traders are studying candles… but the candles aren’t the truth.
The phase is the truth.
The position inside the leg is the truth.
The liquidity story is the truth.
And if you don’t know the truth, the market punishes you.
⸻
🔥 THE DIFFERENCE BETWEEN WINNING AND LOSING IS NOT THE PATTERN — IT’S THE ENVIRONMENT
Let’s break it down clean:
A pullback inside a strengthened, impulsive uptrend is opportunity.
Smart money is reloading.
Volume supports the continuation.
Liquidity is building below swing lows.
The correction is healthy — supported by momentum, structure, and expansion.
But here’s the flip:
A pullback inside a weakened, distributive market is a death trap.
The leg is tired.
Momentum is fading.
Liquidity is drying out.
Smart money is offloading inventory — not accumulating.
To the naked eye, both pullbacks look the same.
To the trained eye, they couldn’t be more different.
This is why top-down analysis matters.
⸻
🔥 BREAKOUTS PROVE IT EVEN CLEARER
A breakout during a momentum phase is fuel.
It tells you price is expanding with force, not faking direction.
But a breakout inside distribution?
That’s manipulation.
That’s inducement.
That’s the market selling strength to buyers who don’t understand phase transitions.
From the outside, both breakouts look clean.
Both breakouts feel bullish.
Both breakouts trigger emotion.
But one breakout is confirming continuation —
The other breakout is preparing reversal.
And traders who don’t understand context end up buying the exact candle professional money is using to exit.
⸻
🔥 THIS IS WHY MOST TRADERS LOSE: THEY TRADE SHAPES, NOT STORIES
Most people can read candles.
Very few can read intention.
Most people see structure.
Very few understand order flow.
Most people memorize patterns.
Very few study phases, accumulation, distribution, inducements, and macro positioning.
And when you’re blind to context, price movement starts looking random — not because it is random, but because your process is incomplete.
⸻
🔥 TOP-DOWN ANALYSIS IS THE ANTIDOTE
When you move from 4H → 30M → 5M, the entire game changes.
You start seeing:
• What leg price is responding to
• Whether the move is correction or expansion
• Whether the premium/discount environment supports continuation or reversal
• Whether volume aligns with market direction
• Whether structural shifts have real intention
• Whether the pullback is healthy or distributive
• Whether you’re trading strength or exhaustion
This is not about finding entries.
This is about understanding story.
And when you understand the story, the market stops attacking you — it starts communicating with you.
That’s why I always say:
📌 Structure without context is noise.
📌 Patterns without narrative are traps.
📌 Entries without phase analysis are gambling.
⸻
🔥 SMART MONEY DOESN’T TRADE CANDLES — IT TRADES PHASES
Accumulation → Manipulation → Expansion → Distribution.
That cycle has existed forever — way before candlesticks, way before indicators, way before retail charts.
Jesse Livermore was teaching it 100 years ago without even using modern language:
Price doesn’t move because of patterns — price moves because of positioning.
And that’s the same message today, just spoken through volume, OBs, HTF narrative, inducements, liquidity sweeps, and structural transitions.
Context IS Smart Money Concepts.
Context IS the real edge.
Context IS the only reason price behaves the way it does.
⸻
🔥 FINAL MESSAGE FOR TRADERS: IF YOU CAN’T SEE CONTEXT, YOU’RE NOT SEEING THE MARKET
If trading feels confusing, unpredictable, inconsistent, emotional — it’s not because you’re bad at trading.
It’s because you’re trading charts instead of trading environments.
Two charts can be identical.
Only context tells you whether the pullback deserves your money —
or your patience.
Only context tells you whether the breakout deserves conviction —
or caution.
Only context tells you whether the structure deserves participation —
or avoidance.
Context tells the truth.
Everything else is noise.

How Smart Money Trap Retailer 22 Dec 2025This video explains how smart money traps retail traders by focusing on how institutional participants think and operate as a coordinated group rather than as individuals. The discussion highlights how liquidity is created around obvious price levels, how collective positioning works, and why retail traders often react emotionally while smart money plans strategically.
The objective of this video is to build awareness about smart money behavior, team-based execution, and liquidity-driven market movement, helping viewers understand market dynamics from a learning perspective rather than a signal-based approach.

Neural Networks in Trading: Separating Hype from Reality
"99% Accurate AI" Sounds Great — Until You See the Equity Curve
If you've been around markets lately, you've seen the pitch:
Our revolutionary AI uses deep neural networks to predict the market with 99% accuracy.
In the era of big models and buzzwords, it's easy to get hypnotized by charts that go straight up. The problem isn't that neural networks are useless — it's that most people use them (and sell them) in ways that have nothing to do with real trading.
What Neural Networks Actually Do
Underneath the hype, a neural network is just a flexible function approximator:
You feed it inputs (price, volume, indicators, sentiment, etc.)
It learns internal weights that map those inputs to outputs
It adjusts those weights to reduce error on past data
They are powerful because they can model complex, non‑linear relationships. But that power is a double‑edged sword: they can also memorize noise and call it "pattern".
The Big Myths (and the Boring Reality)
Myth: "AI predicts direction with high accuracy"
Reality: Markets are adaptive. High "accuracy" often means tiny moves or rare trades.
A model that wins 90% of the time by making 0.1% might still blow up on the 10% it loses.
Myth: "Deeper = Better"
Reality: Extra layers don't magically create edge.
Often, simple models with clear logic survive regimes better than giant black boxes.
Myth: "The AI will find hidden alpha humans can't"
Reality: It can only find what exists in the data you give it .
Garbage in, overfit magic out.
The AI revolution doesn't remove the need for market understanding — it punishes the lack of it faster.
Where Neural Nets Make Sense in Trading
In the AI era, the realistic edge isn't "my network predicts the next candle". It's using ML for jobs humans are bad at:
Sentiment and Text – Classifying news and social feeds as bullish/bearish/neutral.
Regime Detection – Clustering periods into "trend", "range", "crisis", etc.
Feature Extraction – Turning raw data into useful signals that simpler rules can trade.
Execution Optimization – Deciding how to slice orders to minimize impact and cost.
In all of these, the network is a component of your system, not the entire strategy.
The Overfitting Trap (Where Most AI Traders Die)
Neural networks are overfitting machines if you don't constrain them.
Signs you're in trouble:
Almost perfect backtest equity curve
Hundreds of parameters and indicators in the input
Performance collapses when you shift the date range or symbol
A few trades account for most of the profit
Remember: the network is trying to minimize past error, not maximize future robustness.
Practical Guidelines for Using Neural Nets in the AI Era
Start With the Problem, Not the Model
"I want to forecast tomorrow's close" is vague.
"I want to classify if we're in a high‑volatility regime" is concrete.
Keep Inputs Honest
No look‑ahead data.
Use realistic, survivorship‑aware histories.
Hold Out Real Out‑of‑Sample Data
Data the model never touches during training.
Use it once as a final exam, not 20 times as another tuning set.
Prefer Simple Uses Over "Magic"
Use nets to rank or score, not to call exact highs and lows.
Combine ML outputs with transparent risk rules.
AI Is a Tool, Not a Free Lunch
Neural networks are part of the AI trading toolkit — not the holy grail.
In this era, the traders who win are the ones who can:
Ask precise questions
Understand what their models are actually doing
Say "no" to beautiful but fragile backtests
Use AI to extend your edge, not to replace thinking.

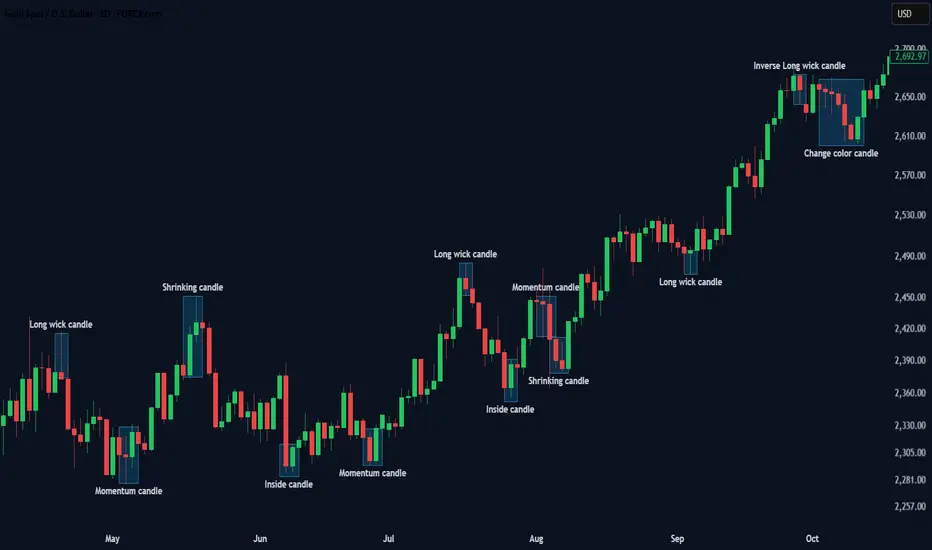
The Language of Price | Lesson 2 – Candlestick PracticeLesson Focus: Candlestick Types (Practice)
This post is a practical continuation of the previous candlestick theory lesson.
If you have not reviewed the previous theoretical lesson , it is recommended to do so first, as this chart directly builds upon those concepts .
Here, candlestick concepts are shown directly on a real price chart to illustrate how they appear within live market structure.
📘 PURPOSE OF THIS CHART
The goal of this chart is to visually connect theory with practice by identifying candlestick behaviors explained in the previous lesson.
No trading signals are given.
No entries, exits, or predictions are suggested.
🧠 CANDLESTICK BEHAVIORS SHOWN ON THE CHART
• Long Wick Candle
Shows price rejection , where the market attempted to move further but was pushed back.
• Inverse Long Wick Candle
Represents acceptance in the direction of the prevailing trend and rejection on the opposite side.
• Shrinking Candle
Indicates loss of momentum as price continues with reduced strength.
• Momentum Candle
Represents a sudden imbalance where one side temporarily dominates price movement.
• Inside Candle
Forms completely within the range of the previous candle , signaling consolidation and indecision.
• Change Color Candle
Reflects weakening pressure or a pause in the current directional move.
📌 KEY REMINDER
Candlesticks do not move price .
They reflect past decisions made by buyers and sellers .
Their meaning becomes clearer only when viewed within:
• market context
• market structure
• surrounding price behavior
This lesson is part of an ongoing educational market structure series .
If you find value in this approach, you may follow to stay connected with the upcoming lessons where concepts are built step by step .
ETHICAL & EDUCATIONAL NOTICE
This content is presented solely for educational and analytical purposes , based on historical price data.
It does not promote or encourage any specific trading method, financial instrument, gambling, leverage, margin usage, short selling, or interest-based activity .
Readers are encouraged to align any financial activity with their own ethical, legal, and religious principles .
⚠️ DISCLAIMER
This material is strictly educational and informational .
It does not constitute financial advice, investment recommendations, or trading instructions.
The author does not provide personalized guidance.
Any decisions made based on this content are the sole responsibility of the individual.
Mastering MACDTurning a Popular Indicator Into a Structured Decision Tool
Many traders use MACD as a simple signal generator. They see a crossover, enter a trade, and later realise the result does not match the expectation. MACD becomes useful only when it is applied inside a clear framework built on trend, momentum, and timing. Its real value lies in reading shifts in participation rather than delivering standalone entry signals.
Understanding what the indicator represents is the first step. MACD measures the relationship between two moving averages and reveals how fast price is accelerating or slowing down. The histogram shows the rate of change. When used with intent, MACD helps you read the strength behind a move instead of trying to predict direction. Momentum confirms structure and brings clarity to the decision process.
Define the market environment before looking at MACD. Trending markets and ranging markets produce different behaviours. In a trend, a rising histogram often supports continuation and helps you judge whether a pullback is healthy or the start of a deeper rotation. In a range, the histogram moves around the zero line and highlights areas where momentum is fading. Without this context, MACD signals tend to mislead more than they help.
The next step is aligning MACD with the locations your system already relies on. Use it as part of the confluence, not as a trigger. When price reaches a higher-timeframe level, a liquidity area, or a clear structural pivot, the histogram can show whether momentum is shifting in your favour. You are not asking MACD to discover the trade. You are using it to confirm the logic you have prepared.
With structure and location in place, create specific decision rules for MACD behaviour. Examples include shrinking momentum when price approaches a level, expansion that supports a breakout, crossovers that match the higher-timeframe direction, or divergences that signal exhaustion at important zones. Every rule needs to serve a practical purpose. Reacting to every crossover removes discipline and weakens the system. Well-defined conditions make MACD a reliable filter.
Risk management remains outside the indicator. MACD does not define stops, invalidation, or how much to risk. Those rules come from structure. Stops should respect swing highs or lows, well-defined invalidation areas, or volatility-based distances. Combining this approach with MACD’s momentum read protects you from chasing trades that lack strength and reduces over-engagement during slow conditions.
Validation closes the loop. Backtest the exact behaviours you rely on, not the indicator as a whole. Study how histogram shifts behave at your chosen levels. Compare momentum against structure. Track how timing improves when MACD is used to refine execution instead of generate entries. When the data confirms the rules across different market conditions, the system gains stability.
MACD becomes a valuable asset when integrated into a disciplined process. On its own, it produces too much noise. Inside a structured system, it sharpens momentum reading, filters out weak trades, and builds cleaner execution. Traders who use MACD to support their framework instead of driving it achieve far greater consistency over time.

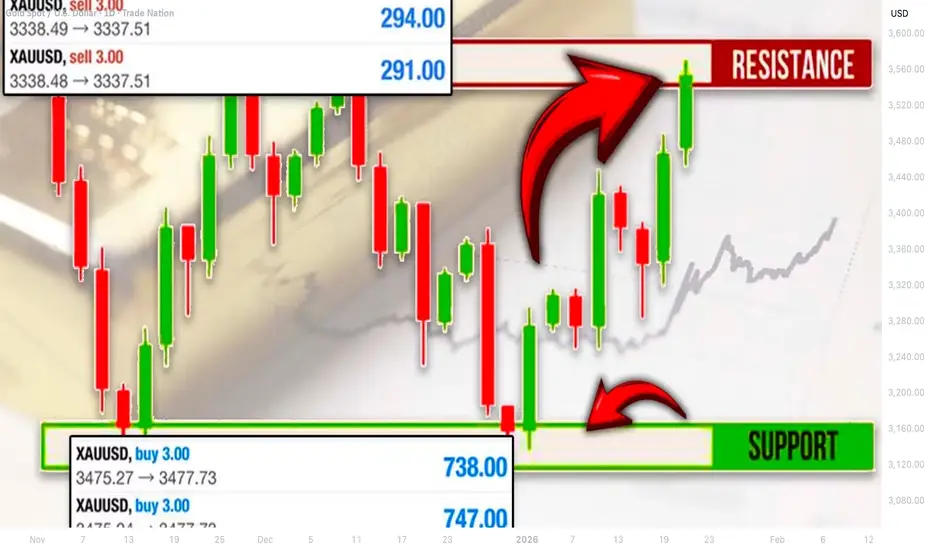
How to Trade Sideways Price Action on GOLD XAUUSD
Turn boring ranging market into your biggest advantage.
The truth is that consolidation trading can be even more profitable than trend following trading Gold XAUUSD.
In this article, I will teach you a simple consolidation strategy to day-trade sideways price action.
In order to trade a ranging market, first, you should learn to identify that correctly.
This simple rule will help you to identify that on Gold on any time frame. (for this strategy, we will look for a consolidation on a 4H time frame strictly )
Gold price should simply stop updating:
lower lows and lower highs (if the trend was previous bearish),
higher highs and higher lows (if the trend was previously bullish).
Examine a price action on Gold on a 4H time frame:
Trading in a bearish trend, we can easily identify 2 periods of consolidation.
The price temporarily started ranging, not managing to update lower lows in the first instance and lower lows and lower highs in the second one.
Such a market behavior is a clear indication of a sideways price action.
After you confirmed a consolidation on Gold, you will need to identify its boundaries .
Usually, the price will start respecting some horizontal support and resistance, forming a range.
I have underlined the boundaries of 2 ranges that we spotted.
Once you identified a sideways price action on Gold, with the absence of high impact fundamental news, such a price behavior will most likely continue .
The price will continue respecting the boundaries of the range, falling from its resistance and growing from its support.
You should patiently wait for a test of a support or resistance of the range first.
In our example, we see a test of a resistance.
We can expect that the price will drop from that.
But the problem is that the underlined resistance is quite wide and from such a perspective, we can not predict the exact level from where it will drop.
Multiple time frame analysis will help you to spot an accurate entry signal.
I suggest looking for a channel or a wedge on an hourly time frame.
The price formed a rising wedge on an hourly.
Your signal to sell will be a breakout and an hourly candle close below its support.
It will indicate a highly probable bearish movement to the support of the range.
After a confirmed violation of a trend line, open a sell position immediately or set a sell limit order on its retest.
Stop loss should be above the highs of the wedge/channel.
Take profit will be the upper boundary of a range's support.
76 pips of profit were made.
Using this strategy, we could easily predict a previous bullish movement from a support.
A bullish breakout of a resistance of the wedge provided a strong confirmation.
Entering on a retest of its broken resistance, be TP should have been based on the lower boundary of the range's resistance.
Stop loss should have lied below the lows of the wedge.
Consolidations may last for days, weeks and even months on Gold.
Not trading it, you will miss a lot of profitable opportunities.
This strategy will help you to trade a sideways ranging market easily.
❤️Please, support my work with like, thank you!❤️
I am part of Trade Nation's Influencer program and receive a monthly fee for using their TradingView charts in my analysis.
Professional Fibonacci Trading GuideMost professional traders use Fibonacci for one reason
It defines where risk and opportunity are asymmetric
Fibonacci levels highlight where pullbacks tend to pause before trend continuation
Not because of magic
Because order flow and trader behavior cluster there
The Only Levels That Matter
✓ 0.50 psychological balance
✓ 0.618 highest probability continuation zone
✓ 0.786 trend validation level
These zones are where professionals wait
Not chase
How It’s Used
✓ Identify a clean impulse move
✓ Draw from swing low to swing high
✓ Wait for price to retrace into 0.50 to 0.618
✓ Enter only after price shows acceptance
✓ Stops sit below 0.786
✓ First target is prior high
✓ Extensions project continuation targets
Why Daily Timeframe
✓ Filters noise
✓ Aligns with institutional flow
✓ Cleaner structure
✓ Better risk to reward
✓ Less overtrading
Lower timeframes distort Fibonacci
Daily charts reveal intent
Key Rule
Fibonacci is not an entry signal
Price reaction is
Wait for price to reach the level
Then wait for confirmation
That patience is the edge
RB Trading
Education only
Risk management required

Is Globalization Fading Out?Understanding the Shift in the Global Economic Order
For more than three decades, globalization has been the defining force shaping the world economy. Goods, capital, technology, and labor flowed across borders at unprecedented speed, integrating national economies into a tightly connected global system. Multinational corporations built complex supply chains, financial markets became deeply interlinked, and global trade expanded faster than global GDP. However, in recent years, a growing debate has emerged: is globalization fading out, or is it simply transforming into a new form?
This question has gained urgency due to rising geopolitical tensions, trade wars, pandemics, technological rivalry, and shifting political priorities. While globalization is not disappearing entirely, evidence suggests that the era of hyper-globalization is slowing, giving way to a more fragmented, cautious, and regionally focused global system.
The Rise of Globalization: A Brief Context
Globalization accelerated rapidly after the Cold War. The collapse of the Soviet Union, the rise of free-market capitalism, and the creation of institutions like the World Trade Organization (WTO) fostered an environment of trade liberalization. China’s entry into the WTO in 2001 marked a turning point, integrating a massive labor force into global manufacturing and lowering production costs worldwide.
Corporations optimized efficiency by outsourcing production, countries specialized based on comparative advantage, and consumers benefited from cheaper goods. Financial globalization also deepened, with capital flowing freely across borders in search of higher returns. For many years, globalization was seen as inevitable and irreversible.
Signs That Globalization Is Slowing Down
In the last decade, several indicators suggest that globalization has lost momentum. Global trade growth has slowed relative to GDP growth, cross-border investment flows have become more volatile, and multinational supply chains are being restructured.
One major signal was the U.S.–China trade war, which challenged the assumption that economic integration would override political rivalry. Tariffs, export controls, and sanctions became tools of statecraft. Similarly, Brexit represented a political rejection of economic integration by a major developed economy.
The COVID-19 pandemic further exposed the vulnerabilities of global supply chains. Shortages of medical equipment, semiconductors, and essential goods highlighted the risks of over-dependence on distant suppliers. As a result, governments and firms began prioritizing resilience over efficiency.
Geopolitics and Economic Nationalism
Geopolitical risk is now one of the strongest forces reshaping globalization. Strategic competition between major powers, particularly the United States and China, has introduced the concept of economic security into trade and investment decisions. Technologies such as semiconductors, artificial intelligence, and clean energy are increasingly treated as national security assets rather than purely commercial goods.
Economic nationalism has gained political support across many countries. Governments are encouraging domestic manufacturing, protecting strategic industries, and imposing restrictions on foreign investment. Policies like “Make in India,” U.S. industrial subsidies, and Europe’s strategic autonomy agenda reflect this shift. These trends suggest a move away from unrestricted globalization toward controlled and selective integration.
From Globalization to Regionalization
Rather than a complete collapse, globalization appears to be reconfiguring into regional blocs. Supply chains are being shortened through near-shoring and friend-shoring, where production is relocated to politically aligned or geographically closer countries. Asia, North America, and Europe are increasingly functioning as semi-independent economic zones.
Trade agreements are also becoming more regional than global. Frameworks like the Regional Comprehensive Economic Partnership (RCEP) in Asia and renewed focus on regional trade in the Americas indicate that countries still value trade—but prefer it within trusted networks. This marks a shift from global integration to regional interdependence.
Technology and Digital Globalization
While traditional globalization in goods and manufacturing may be slowing, digital globalization is expanding. Cross-border data flows, digital services, e-commerce, and remote work are growing rapidly. Technology allows firms to collaborate globally without relying on physical supply chains to the same extent as before.
However, even digital globalization faces fragmentation. Data localization laws, digital taxes, and competing technology standards are creating “digital borders.” The internet itself is becoming more segmented, reflecting broader geopolitical divides. Thus, even in the digital realm, globalization is evolving rather than expanding freely.
Impact on Emerging and Developing Economies
For emerging markets, a slowdown in globalization presents both risks and opportunities. Countries that relied heavily on export-led growth may face challenges as global demand weakens and supply chains shift. At the same time, diversification away from China has created opportunities for nations like India, Vietnam, and Mexico to attract new investment.
Developing economies now need to focus more on domestic demand, regional trade, and value-added production rather than relying solely on global export markets. Policy reforms, infrastructure development, and skill enhancement will determine which countries benefit from the new global order.
Is Globalization Ending or Just Changing?
The evidence suggests that globalization is not ending, but the rules governing it are changing. The era of maximum efficiency, lowest cost, and borderless integration is being replaced by a system that balances efficiency with security, resilience, and political alignment.
Global trade, capital flows, and international cooperation still exist, but they are increasingly shaped by strategic considerations. Instead of one unified global market, the world is moving toward a multipolar economic structure with multiple centers of power and influence.
Conclusion: The Future of Globalization
Globalization is fading in its old form, but it is not disappearing. What we are witnessing is a transition—from hyper-globalization to a more fragmented, regionalized, and cautious model. Governments and businesses are adapting to a world where geopolitics, technology, and resilience matter as much as cost and efficiency.
For policymakers, investors, and traders, understanding this shift is critical. The future will likely be defined by selective globalization, where countries remain interconnected but with clearer boundaries and strategic priorities. In this sense, globalization is not fading out—it is being reshaped to fit a more complex and uncertain world.

Market ShiftingHow Global Financial Markets Are Entering a New Phase of Transformation
Financial markets across the world are undergoing a profound shift. The forces that once defined market behavior—cheap liquidity, synchronized global growth, predictable central bank support, and deep globalization—are no longer dominant. Instead, markets are being reshaped by structural changes in geopolitics, technology, monetary policy, demographics, and investor behavior. This “market shifting” phase is not a temporary correction or a short-term cycle; it represents a transition into a new market regime where volatility, selectivity, and adaptability matter more than ever.
At its core, market shifting refers to the reallocation of capital, changes in leadership among asset classes and sectors, evolving risk-return dynamics, and altered relationships between traditional financial indicators. Understanding this shift is essential for investors, traders, policymakers, and businesses alike, as strategies that worked in the past decade may fail in the decade ahead.
From Easy Money to Tight Financial Conditions
One of the most important drivers of today’s market shift is the global move away from ultra-loose monetary policy. For more than a decade after the 2008 financial crisis, central banks flooded markets with liquidity through near-zero interest rates and quantitative easing. This environment inflated asset prices, reduced volatility, and encouraged risk-taking across equities, bonds, real estate, and alternative assets.
That era has now ended. Persistent inflation forced central banks such as the U.S. Federal Reserve, European Central Bank, and others to raise interest rates aggressively. Higher rates increase the cost of capital, compress valuations, and shift investor preference from speculative growth assets to cash-flow-generating and defensive investments. As a result, markets are recalibrating what assets are truly worth in a world where money is no longer free.
Shifting Asset Class Leadership
Another defining feature of the current market shift is the rotation in asset class leadership. During the previous cycle, equities—especially technology and growth stocks—consistently outperformed. Bonds served as reliable hedges, and correlations between asset classes were relatively stable.
Today, those relationships are changing. Bonds are no longer guaranteed safe havens during inflationary periods, commodities have regained importance as inflation hedges, and currencies are becoming active trading instruments rather than background variables. Gold, energy, industrial metals, and even agricultural commodities have taken center stage as investors seek protection against inflation, supply shocks, and geopolitical risk.
This shift means diversification strategies must be rethought. Traditional 60/40 portfolios are under pressure, pushing investors to explore alternatives such as commodities, infrastructure, private credit, and tactical trading strategies.
Geopolitics and Fragmentation of Global Markets
Geopolitical tensions are accelerating the market shift. The U.S.–China rivalry, regional conflicts, trade wars, sanctions, and the reshoring of supply chains are fragmenting global markets. Instead of one integrated global financial system, the world is moving toward regional blocs with distinct rules, risks, and capital flows.
This fragmentation impacts markets in multiple ways. Supply chain disruptions increase costs and inflation volatility. Trade restrictions alter corporate earnings and sector leadership. Capital controls and sanctions affect currency stability and cross-border investments. For markets, geopolitical risk is no longer a tail risk—it is a core pricing factor.
Technology, Automation, and Market Structure Changes
Technology is also reshaping how markets function. Algorithmic trading, artificial intelligence, high-frequency strategies, and retail participation through digital platforms have altered market microstructure. Price movements can be faster, sharper, and sometimes disconnected from fundamentals in the short term.
At the same time, technology-driven sectors are themselves undergoing a shift. Investors are now distinguishing between profitable, scalable tech businesses and those reliant on cheap funding. Innovation remains powerful, but valuation discipline has returned. This change reflects a broader market shift toward quality, earnings visibility, and balance sheet strength.
Behavioral Shifts Among Investors
Investor psychology is changing as well. The “buy the dip” mentality that dominated during central-bank-supported markets is no longer universally effective. Increased volatility, sudden drawdowns, and macro-driven price swings have made market participants more cautious.
Retail investors are more active but also more selective. Institutional investors are shortening time horizons, using derivatives for hedging, and actively managing risk rather than relying on passive exposure alone. This behavioral shift reinforces market volatility and creates frequent rotations between risk-on and risk-off environments.
Emerging Markets and Capital Flow Realignment
Market shifting is also visible in emerging markets. Higher global interest rates have reversed capital flows that once favored emerging economies. Stronger reserve currencies, especially the U.S. dollar, have pressured emerging market currencies, debt, and equities.
However, this shift is uneven. Countries with strong fundamentals, manageable debt, domestic growth drivers, and stable policy frameworks are attracting selective investment. Others face capital outflows and market stress. This divergence highlights how the new market environment rewards differentiation rather than broad-based exposure.
Implications for Traders and Long-Term Investors
The ongoing market shift demands a new approach to strategy and risk management. For traders, volatility creates opportunity, but it also increases the importance of discipline, position sizing, and macro awareness. Technical analysis must be combined with macro context, as news events and policy signals can override chart patterns.
For long-term investors, patience and selectivity are crucial. Instead of chasing momentum, focus is shifting toward valuation, earnings resilience, dividends, and real assets. Flexibility—across asset classes, geographies, and styles—is becoming a competitive advantage.
Conclusion: Adapting to the New Market Reality
Market shifting is not a crisis; it is a transition. Financial markets are adjusting to a world defined by higher interest rates, geopolitical complexity, technological disruption, and changing investor behavior. While this environment is more volatile and uncertain, it also offers opportunities for those who understand the new rules.
Success in this phase depends on adaptability, risk awareness, and a willingness to move beyond outdated assumptions. Markets are no longer driven by a single narrative or policy backstop. Instead, they reflect a complex interplay of economics, politics, and psychology. Recognizing and respecting this shift is the first step toward navigating the markets of today—and thriving in the markets of tomorrow.

Geopolitical Risk and Its Role in Causing Market VolatilityGeopolitical risk refers to the uncertainty and instability arising from political events, international conflicts, diplomatic tensions, trade disputes, sanctions, wars, terrorism, and changes in government policies across countries. In an increasingly interconnected global economy, geopolitical developments in one region can rapidly spill over into global financial markets. As a result, geopolitical risk has become one of the most powerful and unpredictable drivers of market volatility, affecting equities, bonds, commodities, currencies, and even cryptocurrencies.
Understanding the Link Between Geopolitics and Markets
Financial markets thrive on stability, predictability, and confidence. Geopolitical events disrupt these conditions by introducing uncertainty about future economic outcomes. When investors are unable to accurately assess risks or forecast returns due to political instability, they tend to react emotionally—often selling riskier assets and moving capital toward safer investments. This sudden shift in investor behavior leads to sharp price movements, higher volatility, and sometimes prolonged market turbulence.
Markets are forward-looking by nature. Even the expectation of a geopolitical event—such as a potential war, sanctions, or breakdown of trade negotiations—can trigger volatility well before the event actually occurs. This makes geopolitical risk particularly dangerous, as markets may overreact to rumors, media headlines, or speculative assessments.
Types of Geopolitical Events That Trigger Volatility
Several forms of geopolitical risk have historically caused significant market disruptions:
Wars and Military Conflicts: Armed conflicts directly impact global supply chains, energy markets, and investor confidence. Wars often lead to spikes in oil, gold, and defense stocks, while equities and emerging market assets may decline sharply.
Trade Wars and Economic Sanctions: Trade disputes between major economies can disrupt global commerce, raise inflation, and reduce corporate profits. Tariffs and sanctions increase uncertainty for multinational companies, leading to stock market volatility.
Political Instability and Regime Changes: Coups, revolutions, contested elections, or sudden policy shifts can destabilize domestic markets and cause capital flight, especially in developing economies.
Terrorism and Security Threats: Major terrorist attacks often trigger immediate market sell-offs due to fear and uncertainty, particularly in travel, tourism, and financial sectors.
Diplomatic Tensions: Breakdown in diplomatic relations between powerful nations can affect currency markets, defense stocks, and global investor sentiment.
Impact on Different Asset Classes
Geopolitical risk does not affect all markets equally. Its impact varies across asset classes:
Equity Markets: Stock markets usually react negatively to rising geopolitical tensions. Higher uncertainty leads to lower risk appetite, reduced valuations, and sharp intraday swings. Defensive sectors like utilities and consumer staples may outperform, while cyclical sectors suffer.
Bond Markets: Government bonds of stable economies often benefit from “flight-to-safety” behavior. Yields fall as investors seek protection, while bonds from politically unstable regions face rising yields and falling prices.
Commodities: Commodities are highly sensitive to geopolitical risk. Oil prices often surge during Middle East tensions, while gold tends to rise as a safe-haven asset. Agricultural and industrial commodities may also face supply disruptions.
Currency Markets: Safe-haven currencies such as the US dollar, Swiss franc, and Japanese yen usually strengthen during geopolitical crises, while currencies of emerging markets and conflict-affected regions weaken sharply.
Cryptocurrencies: Although sometimes viewed as alternative safe assets, cryptocurrencies often experience heightened volatility during geopolitical shocks due to speculative behavior and liquidity concerns.
Investor Psychology and Volatility Amplification
Geopolitical risk amplifies volatility largely through investor psychology. Fear, uncertainty, and herd behavior play a crucial role in market reactions. News headlines, social media, and 24/7 global media coverage intensify emotional responses, often leading to exaggerated price movements. Algorithmic and high-frequency trading systems further accelerate volatility by reacting instantly to geopolitical news triggers.
In many cases, markets initially overreact to geopolitical events, followed by partial recoveries once the situation becomes clearer. However, prolonged or escalating conflicts can lead to sustained volatility and long-term repricing of assets.
Role of Globalization and Interconnected Markets
Globalization has magnified the impact of geopolitical risk on financial markets. Modern supply chains span multiple countries, meaning disruptions in one region can affect production, inflation, and earnings worldwide. Financial institutions are also deeply interconnected, allowing shocks to spread rapidly across borders. This interconnectedness ensures that geopolitical risk is no longer a local issue—it is a global market concern 🌐.
Risk Management and Strategic Implications
For investors and traders, understanding geopolitical risk is essential for effective risk management. Diversification across asset classes, regions, and sectors helps reduce exposure to political shocks. Hedging strategies using options, commodities like gold, or safe-haven currencies can also mitigate downside risk. Long-term investors often benefit from maintaining discipline and avoiding panic-driven decisions during geopolitical crises.
From a policy perspective, central banks and governments closely monitor geopolitical developments, as they can influence inflation, growth, and financial stability. In extreme cases, geopolitical shocks may prompt emergency monetary or fiscal interventions to stabilize markets.
Conclusion
Geopolitical risk is a persistent and unavoidable feature of global financial markets. By disrupting economic stability, altering investor sentiment, and triggering rapid capital flows, geopolitical events are a major cause of market volatility. As global political dynamics continue to evolve—with rising multipolar tensions, trade fragmentation, and regional conflicts—markets are likely to experience frequent bouts of uncertainty and sharp price swings.
For market participants, the key lies not in predicting geopolitical events—which is often impossible—but in understanding their potential impact and preparing resilient investment strategies. In an era where politics and markets are deeply intertwined, geopolitical risk will remain one of the most powerful forces shaping financial market volatility 📊⚠️.

Global Finance History: Evolution of Money, Markets, and PowerThe history of global finance is deeply intertwined with the evolution of human civilization. From the earliest systems of barter to today’s complex web of digital currencies, stock exchanges, and global capital flows, finance has shaped economic growth, political power, and social change. Understanding global financial history helps explain how modern markets function, why financial crises recur, and how wealth and influence are distributed across nations.
Early Origins: Barter, Money, and Banking
In ancient societies, economic exchange began with barter—direct trade of goods and services. However, barter was inefficient due to the “double coincidence of wants.” To overcome this, early civilizations introduced money in the form of commodities such as cattle, grains, shells, and precious metals. Around 600 BCE, the Lydians (in modern-day Turkey) minted the first standardized coins, marking a turning point in financial history.
Ancient Mesopotamia and Egypt laid the foundations of banking. Temples and palaces acted as financial centers, accepting deposits, extending loans, and keeping records. The Code of Hammurabi (circa 1750 BCE) included laws regulating interest rates and debt, highlighting the early importance of financial regulation.
Classical and Medieval Finance
In ancient Greece and Rome, financial systems expanded alongside trade and empire-building. Money changers, maritime loans, and early forms of insurance supported long-distance commerce. Rome developed sophisticated taxation and public finance systems, funding infrastructure and military expansion. However, the collapse of the Roman Empire led to economic fragmentation in Europe.
During the medieval period, global finance re-emerged through trade networks connecting Europe, the Middle East, Africa, and Asia. Islamic civilizations played a crucial role, advancing credit instruments such as checks (sakk), bills of exchange, and partnership contracts. These innovations later influenced European banking.
Italian city-states like Venice, Florence, and Genoa became financial powerhouses between the 12th and 15th centuries. Merchant banks financed trade, governments, and wars. The Medici Bank, for example, pioneered double-entry bookkeeping, a system still fundamental to modern accounting.
The Rise of Capitalism and Financial Markets
The early modern period marked the transition from mercantilism to capitalism. European exploration and colonial expansion created global trade routes and massive capital flows. Joint-stock companies such as the Dutch East India Company (VOC) and the British East India Company allowed investors to pool capital and share risk, a major milestone in financial innovation.
The first stock exchange emerged in Amsterdam in the early 17th century, enabling the trading of shares and bonds. This period also saw the development of government debt markets, as states borrowed to finance wars and expansion. Central banking began to take shape with institutions like the Bank of England (founded in 1694), which helped stabilize government finances and manage currency.
Industrial Revolution and Modern Finance
The Industrial Revolution of the 18th and 19th centuries transformed global finance. Rapid industrialization required large-scale investment in factories, railways, and infrastructure. Banks, stock markets, and bond markets expanded to meet these needs. Financial centers such as London and later New York emerged as global hubs of capital.
Gold became the backbone of the international monetary system. Under the gold standard, currencies were pegged to a fixed amount of gold, promoting stability in exchange rates and international trade. However, this system also limited governments’ ability to respond to economic shocks.
20th Century: Crises, Regulation, and Globalization
The 20th century was marked by extreme financial volatility and institutional reform. World War I disrupted the gold standard, and the Great Depression of the 1930s exposed weaknesses in unregulated financial markets. Massive bank failures and stock market crashes led governments to intervene more actively in finance.
In response, new regulatory frameworks emerged. The United States introduced banking reforms, while globally the Bretton Woods system (established in 1944) created institutions such as the International Monetary Fund (IMF) and the World Bank. The US dollar became the world’s reserve currency, pegged to gold, while other currencies were pegged to the dollar.
From the 1970s onward, the collapse of Bretton Woods led to floating exchange rates. Financial globalization accelerated as capital controls were lifted, technology advanced, and multinational banks expanded. Derivatives, hedge funds, and complex financial instruments grew rapidly, increasing both efficiency and risk.
The Digital Age and Contemporary Finance
The late 20th and early 21st centuries ushered in the digital revolution in finance. Electronic trading, online banking, and real-time global markets transformed how money moves across borders. Financial innovation brought benefits such as efficiency and inclusion but also new vulnerabilities.
The global financial crisis of 2008 was a defining moment, revealing systemic risks in interconnected financial systems. Governments and central banks responded with unprecedented monetary stimulus and tighter regulations. Since then, issues like sovereign debt, inequality, and financial stability have remained central concerns.
Today, global finance is evolving again with the rise of fintech, cryptocurrencies, central bank digital currencies (CBDCs), and sustainable finance. Emerging markets play a larger role, while geopolitical tensions increasingly influence capital flows and monetary policy.
Conclusion
Global financial history is a story of innovation, expansion, crisis, and reform. Each era built upon the successes and failures of the past, shaping today’s complex financial system. By understanding this history, policymakers, investors, and citizens can better navigate modern financial challenges and anticipate future transformations in the global economy.

The U.S.–China Trade War: Origins, Escalation, and Global ImpactBackground and Origins
The roots of the U.S.–China trade war lie in the rapid rise of China as a global economic power. Over the past four decades, China transformed itself into the world’s manufacturing hub, benefiting from low labor costs, export-oriented policies, and integration into global trade institutions such as the World Trade Organization (WTO) in 2001. This rise led to a massive bilateral trade imbalance, with the U.S. importing far more goods from China than it exported.
U.S. policymakers increasingly argued that this imbalance was not merely market-driven but the result of unfair trade practices. These concerns included forced technology transfer, intellectual property theft, heavy state subsidies to Chinese firms, currency management, and restricted access for foreign companies to Chinese markets. By the mid-2010s, bipartisan consensus in the U.S. had formed around the idea that China’s economic model posed a structural challenge to the global trading system.
Escalation of the Trade War
The trade war officially escalated in 2018 when the United States imposed tariffs on billions of dollars’ worth of Chinese imports under Section 301 of the Trade Act of 1974. These tariffs targeted a wide range of goods, including electronics, machinery, steel, and consumer products. China responded swiftly with retaliatory tariffs on U.S. exports such as agricultural products, automobiles, and energy commodities.
What followed was a cycle of escalation. Each round of tariffs was met with countermeasures, increasing uncertainty in global markets. At its peak, the U.S. had imposed tariffs on over $360 billion worth of Chinese goods, while China targeted more than $110 billion of U.S. exports. Beyond tariffs, the conflict expanded into non-tariff measures, including export controls, investment restrictions, and blacklisting of companies.
Technology and Strategic Competition
A defining feature of the U.S.–China trade war is its strong focus on technology. The U.S. increasingly viewed China’s technological ambitions—such as the “Made in China 2025” initiative—as a threat to its economic and national security. Restrictions were placed on Chinese technology firms, most notably in semiconductors, telecommunications, and artificial intelligence.
The case of Huawei became symbolic of this phase of the conflict. The U.S. restricted the company’s access to American technology and pressured allies to exclude Huawei from 5G networks. China, in turn, accelerated efforts to achieve technological self-reliance, investing heavily in domestic semiconductor production and critical technologies.
Economic Impact on the United States
In the U.S., the trade war produced mixed results. Some domestic industries, particularly steel and aluminum producers, benefited from tariff protection. However, many U.S. manufacturers faced higher input costs, squeezing profit margins. American consumers also bore part of the cost, as tariffs increased prices on everyday goods.
Farmers were among the hardest hit, as China imposed tariffs on U.S. agricultural exports like soybeans. To offset these losses, the U.S. government introduced large-scale subsidy programs. While the trade deficit with China narrowed temporarily, overall trade deficits persisted as imports shifted to other countries rather than returning to domestic production.
Economic Impact on China
China’s economy also felt significant pressure. Export growth slowed, manufacturing confidence weakened, and foreign investment decisions became more cautious. The trade war coincided with an already slowing Chinese economy, amplifying concerns about growth and employment.
However, China demonstrated resilience by diversifying export markets, stimulating domestic demand, and strengthening trade ties with Asia, Africa, and Europe. Over time, Chinese firms adapted by moving parts of their supply chains to Southeast Asia or focusing more on the domestic market.
Global Supply Chain Disruptions
One of the most profound consequences of the trade war has been the restructuring of global supply chains. Companies sought to reduce reliance on China by adopting a “China plus one” strategy, shifting production to countries like Vietnam, India, Mexico, and Indonesia. While this diversification improved supply chain resilience, it also increased costs and complexity.
Global trade uncertainty affected business investment worldwide. Multinational corporations delayed capital expenditure, while emerging markets experienced both opportunities and risks as supply chains were reconfigured.
Phase One Agreement and Beyond
In early 2020, the U.S. and China signed the so-called “Phase One” trade deal. China committed to increasing purchases of U.S. goods and services, improving intellectual property protections, and opening certain sectors to foreign firms. In return, the U.S. paused further tariff escalation and reduced some existing tariffs.
Despite this agreement, most tariffs remained in place, and many structural issues were unresolved. The outbreak of the COVID-19 pandemic soon overshadowed trade negotiations, but underlying tensions persisted.
Geopolitical and Long-Term Implications
The U.S.–China trade war is not merely an economic dispute; it reflects a deeper geopolitical rivalry. It has accelerated the fragmentation of the global economy into competing blocs, with countries increasingly pressured to align with either the U.S. or China. This fragmentation challenges the multilateral trading system and raises the risk of prolonged economic inefficiencies.
In the long term, the trade war may reshape globalization itself. Rather than a single integrated global market, the world may move toward regionalized supply chains and strategic trade policies focused on national security rather than pure economic efficiency.
Conclusion
The U.S.–China trade war marks a turning point in global economic relations. It exposed vulnerabilities in global supply chains, highlighted the limits of existing trade frameworks, and underscored the growing intersection between economics and geopolitics. While outright escalation has slowed, the underlying rivalry remains unresolved. As a result, the trade war should be seen not as a temporary conflict, but as part of a broader and lasting transformation in the global economic order.

Analyzing the Federal Reserve, ECB, BOJ, and Bank of EnglandGlobal Interest Rate Trends
Interest rates are among the most powerful tools used by central banks to influence economic activity, control inflation, stabilize financial systems, and manage growth cycles. Over the past few years, global interest rate trends have undergone a dramatic shift as the world economy transitioned from ultra-loose monetary policy to aggressive tightening. The Federal Reserve (Fed), European Central Bank (ECB), Bank of Japan (BOJ), and Bank of England (BOE) represent four of the most influential central banks, and their policy decisions collectively shape global liquidity, capital flows, currency movements, and financial market behavior. Understanding their interest rate trends provides crucial insight into the global macroeconomic environment.
The Federal Reserve (United States): From Ultra-Low Rates to Aggressive Tightening
The U.S. Federal Reserve has played a leading role in shaping global interest rate trends. Following the global financial crisis of 2008 and later during the COVID-19 pandemic, the Fed maintained near-zero interest rates and implemented large-scale quantitative easing (QE) to support economic recovery. However, the post-pandemic surge in inflation—driven by supply chain disruptions, fiscal stimulus, and strong consumer demand—forced a sharp pivot.
The Fed entered one of the most aggressive rate-hiking cycles in decades, rapidly increasing the federal funds rate to curb inflation. This tightening phase aimed to slow demand, cool labor markets, and anchor inflation expectations. As inflation showed signs of moderation, the Fed shifted from rapid hikes to a more data-dependent stance, emphasizing the importance of economic indicators such as inflation, employment, and wage growth.
The Fed’s interest rate policy has global consequences. Higher U.S. rates strengthen the dollar, attract global capital, and tighten financial conditions worldwide. Emerging markets often feel pressure as capital flows toward U.S. assets, increasing borrowing costs and currency volatility. As a result, the Fed remains the most influential central bank in the global interest rate ecosystem.
European Central Bank (Eurozone): Fighting Inflation Amid Fragmentation Risks
The European Central Bank faced a unique challenge in its interest rate journey. For years, the ECB operated with negative interest rates to stimulate growth and prevent deflation across the Eurozone. However, inflation surged sharply due to energy price shocks, supply disruptions, and geopolitical tensions, particularly the Russia–Ukraine conflict.
In response, the ECB abandoned its negative-rate policy and initiated a series of rate hikes. The objective was to contain inflation while avoiding financial instability in weaker Eurozone economies. Unlike the U.S., the Eurozone consists of multiple countries with varying fiscal strength, making uniform monetary policy more complex.
The ECB had to balance tightening with tools designed to prevent bond yield spreads from widening excessively between core economies (like Germany) and peripheral nations (such as Italy or Spain). This delicate balancing act highlights the ECB’s dual challenge: controlling inflation without triggering sovereign debt stress.
ECB rate decisions have influenced the euro’s valuation, cross-border investment flows, and borrowing costs across Europe. While tightening has helped reduce inflationary pressures, growth concerns remain, keeping the ECB cautious and highly data-driven.
Bank of Japan (Japan): The Last Defender of Ultra-Loose Policy
The Bank of Japan stands out as an exception among major central banks. For decades, Japan has struggled with deflation, weak demand, and stagnant wage growth. As a result, the BOJ maintained ultra-low interest rates and implemented unconventional policies such as yield curve control (YCC), which caps government bond yields.
Even as global inflation surged, the BOJ was slow to tighten policy. It viewed inflation as largely cost-push rather than demand-driven and remained focused on achieving sustainable wage growth. This divergence caused a significant depreciation of the Japanese yen, as interest rate differentials widened between Japan and other major economies.
Eventually, the BOJ began adjusting its stance, allowing more flexibility in bond yields and signaling a gradual normalization path. However, its approach remains cautious compared to other central banks. Any rate hikes are expected to be slow and measured to avoid disrupting Japan’s highly leveraged public sector and fragile growth dynamics.
The BOJ’s policy divergence has played a major role in global currency markets, carry trades, and capital allocation strategies.
Bank of England (United Kingdom): Balancing Inflation and Growth Risks
The Bank of England was among the earliest major central banks to begin raising interest rates in response to rising inflation. The UK faced particularly strong inflationary pressures due to energy costs, labor shortages, and post-Brexit structural challenges.
The BOE embarked on a steady tightening cycle to bring inflation under control while managing risks to economic growth. Unlike the U.S., the UK economy is more sensitive to interest rate changes due to higher levels of variable-rate borrowing, especially in the housing market.
BOE policy decisions also had to account for financial stability concerns, particularly after episodes of market stress in the UK bond market. As inflation began to ease, the BOE adopted a more cautious tone, signaling that rates may remain elevated for an extended period rather than rising aggressively.
The BOE’s interest rate trajectory has influenced the British pound, domestic credit conditions, and investor confidence in UK assets.
Global Implications of Diverging Interest Rate Policies
The divergence in interest rate trends among the Fed, ECB, BOJ, and BOE has created complex global dynamics. Higher rates in the U.S. and Europe have tightened global liquidity, increased borrowing costs, and reshaped investment strategies. Meanwhile, Japan’s accommodative stance has fueled carry trades, where investors borrow in low-yield currencies to invest in higher-yielding assets elsewhere.
Currency volatility has increased as interest rate differentials widened. Trade balances, capital flows, and asset valuations have all been affected. For emerging markets, global rate trends determine access to capital, debt sustainability, and exchange rate stability.
Conclusion
Global interest rate trends reflect a world adjusting to post-pandemic realities, inflationary pressures, and structural economic changes. The Federal Reserve leads with a strong anti-inflation stance, the ECB balances tightening with regional stability, the BOJ cautiously exits ultra-loose policy, and the BOE navigates inflation amid growth constraints. Together, these central banks shape the global financial landscape, influencing everything from currencies and commodities to equities and bonds. Understanding their interest rate trajectories is essential for policymakers, investors, and businesses operating in an interconnected global economy.

Global Trade Imbalance: Causes and ConsequencesGlobal trade imbalance refers to a persistent difference between a country’s exports and imports when trading with the rest of the world. When a nation consistently exports more than it imports, it runs a trade surplus; when it imports more than it exports, it runs a trade deficit. While short-term imbalances are a normal part of international trade, long-lasting and large imbalances can shape global economic stability, influence currency movements, affect employment, and even create geopolitical tensions. In today’s interconnected world, understanding global trade imbalance is crucial for policymakers, investors, businesses, and traders.
Understanding the Concept of Trade Imbalance
At its core, a trade imbalance reflects differences in economic structure, productivity, consumption patterns, and savings behavior among countries. Developing economies often run trade deficits as they import capital goods and technology to support growth, while export-oriented economies may generate surpluses by focusing on manufacturing and external demand. Trade imbalances are recorded in a country’s current account, which also includes services, income flows, and transfers, but goods trade usually dominates the discussion.
Trade imbalances are not inherently negative. For example, the United States has run trade deficits for decades while maintaining strong economic growth and attracting global capital. However, when imbalances become excessive or politically sensitive, they can trigger policy responses such as tariffs, currency interventions, or trade agreements.
Major Causes of Global Trade Imbalance
One of the most important drivers of global trade imbalance is differences in savings and investment rates. Countries with high domestic savings and relatively lower consumption—such as China, Germany, and Japan—tend to export more than they import, creating trade surpluses. In contrast, countries with high consumption and lower savings—such as the United States—often rely on imports, resulting in trade deficits.
Exchange rate policies also play a critical role. A weaker currency makes exports cheaper and imports more expensive, supporting trade surpluses. Some countries have historically managed or intervened in their currencies to maintain export competitiveness. Conversely, strong currencies can make exports less competitive, widening trade deficits.
Another key factor is economic structure and competitiveness. Countries specializing in high-value manufacturing, technology, or capital goods often dominate global exports. Meanwhile, economies dependent on commodity imports or consumer goods may experience persistent deficits. Labor costs, productivity levels, infrastructure quality, and innovation capacity all influence trade performance.
Globalization and supply chains have further contributed to trade imbalances. Multinational companies often locate production where costs are lowest, exporting finished goods to consumer markets. As a result, manufacturing hubs accumulate trade surpluses, while consumption-driven economies absorb deficits.
Role of Capital Flows and Financial Markets
Trade imbalances are closely linked to capital flows. A country running a trade deficit must attract foreign capital to finance it, usually through foreign direct investment (FDI), portfolio investment, or borrowing. For example, the U.S. trade deficit is matched by strong inflows into U.S. Treasury bonds, equities, and real estate. This relationship shows that trade deficits are not just about goods, but also about confidence in an economy’s financial markets.
However, reliance on foreign capital can increase vulnerability. Sudden reversals of capital flows may lead to currency depreciation, higher interest rates, and financial instability, especially in emerging markets.
Economic and Social Consequences
Persistent global trade imbalances can have wide-ranging effects. In surplus countries, heavy dependence on exports can make growth vulnerable to external demand shocks. A slowdown in global trade or protectionist policies can quickly hurt employment and industrial output.
In deficit countries, large trade gaps may contribute to industrial decline and job losses in manufacturing sectors. This has been a major political issue in several advanced economies, fueling debates about globalization, outsourcing, and fair trade. Rising income inequality and regional economic disparities are often linked to long-term trade deficits.
Trade imbalances also influence currency markets. Deficit countries may experience downward pressure on their currencies over time, while surplus countries may face appreciation pressure. These movements affect inflation, interest rates, and central bank policies, directly impacting global financial markets.
Trade Imbalances and Geopolitics
Global trade imbalance is not just an economic issue; it is also deeply political. Large imbalances between major economies have led to trade disputes, sanctions, and tariff wars. Governments may accuse trading partners of unfair practices such as subsidies, dumping, or currency manipulation.
Such tensions can disrupt global supply chains, reduce investor confidence, and slow global growth. International institutions like the World Trade Organization (WTO), International Monetary Fund (IMF), and G20 often emphasize the need to reduce excessive imbalances through structural reforms rather than protectionism.
Impact on Emerging and Developing Economies
For emerging markets, trade imbalances present both opportunities and risks. Export-led growth strategies have helped many countries industrialize and reduce poverty. However, over-reliance on exports—especially commodities—can expose economies to volatile global prices and demand cycles.
Trade deficits in developing countries can be manageable if they finance productive investments, such as infrastructure and technology. Problems arise when deficits fund consumption instead of growth, increasing external debt and financial fragility.
Addressing Global Trade Imbalance
Reducing global trade imbalance requires coordinated policy efforts. Surplus countries can encourage domestic consumption, raise wages, and invest more at home. Deficit countries can boost savings, improve productivity, and enhance export competitiveness through innovation and skill development.
Exchange rate flexibility is also crucial. Allowing currencies to reflect economic fundamentals can help correct imbalances over time. Structural reforms, such as improving ease of doing business, strengthening infrastructure, and upgrading manufacturing capabilities, play a long-term role.
At the global level, cooperation is essential. Protectionist measures may reduce deficits temporarily but often lead to retaliation and higher costs. Sustainable solutions focus on balanced growth, open markets, and fair competition.
Conclusion
Global trade imbalance is a complex and multifaceted phenomenon shaped by economic structures, financial flows, currency policies, and global supply chains. While trade surpluses and deficits are natural outcomes of international trade, persistent and large imbalances can create economic vulnerabilities and political tensions. In an increasingly interconnected world, addressing global trade imbalance requires thoughtful domestic reforms and strong international cooperation. Rather than viewing imbalances as purely negative, policymakers and market participants must understand their underlying causes and manage them in a way that supports stable, inclusive, and sustainable global growth.

Trading Sovereign Debt: How Government Bonds Shape Global MarketTrading sovereign debt is one of the most important and influential activities in the global financial system. Sovereign debt refers to bonds and other debt instruments issued by national governments to finance public spending, manage budget deficits, and refinance existing obligations. These instruments are considered the backbone of financial markets because they influence interest rates, currency values, capital flows, and even equity market performance. Understanding how sovereign debt trading works is essential for traders, investors, policymakers, and anyone seeking insight into global macroeconomic dynamics.
What Is Sovereign Debt?
Sovereign debt is money borrowed by a government, typically through the issuance of bonds. These bonds promise to pay periodic interest (known as coupons) and return the principal at maturity. Governments issue debt in their own currency (domestic debt) or in foreign currencies (external debt). Examples include U.S. Treasury bonds, Indian Government Securities (G-Secs), UK Gilts, and Japanese Government Bonds (JGBs).
Sovereign debt is often considered low-risk compared to corporate debt because governments have taxation authority and, in some cases, the ability to print money. However, risk levels vary significantly between developed and emerging economies. While U.S. Treasuries are seen as near risk-free, bonds issued by highly indebted or politically unstable countries can carry substantial default risk.
Why Governments Issue Sovereign Debt
Governments issue debt for several reasons. The most common reason is to finance fiscal deficits when public spending exceeds tax revenue. Sovereign debt is also used to fund infrastructure projects, social welfare programs, defense, and economic stimulus during downturns. Additionally, governments refinance old debt by issuing new bonds, managing maturities to ensure stable funding.
From a macroeconomic perspective, sovereign debt plays a vital role in monetary policy. Central banks use government bonds in open market operations to control liquidity and influence interest rates. As a result, trading sovereign debt is closely linked to central bank decisions and economic data.
How Sovereign Debt Is Traded
Sovereign debt is traded primarily in the bond market, both in primary and secondary markets. In the primary market, governments issue new bonds through auctions. Institutional investors such as banks, insurance companies, pension funds, and foreign investors participate heavily in these auctions.
In the secondary market, existing bonds are bought and sold among investors. Prices fluctuate based on interest rate expectations, inflation outlook, credit risk, currency movements, and global risk sentiment. Sovereign bonds are traded over-the-counter (OTC) rather than on centralized exchanges, although electronic trading platforms have become increasingly popular.
Bond prices and yields move inversely. When demand for a bond increases, its price rises and yield falls. Traders often focus more on yields than prices because yields reflect the cost of borrowing for governments and influence all other asset classes.
Key Drivers of Sovereign Debt Prices
Several factors influence sovereign debt trading. Interest rates are the most important driver. When central banks raise interest rates, existing bonds with lower coupons become less attractive, causing prices to fall and yields to rise. Conversely, rate cuts support bond prices.
Inflation expectations are another major factor. Higher inflation erodes the real value of fixed coupon payments, leading investors to demand higher yields. Economic growth data, employment numbers, and fiscal deficits also play a role, as they affect a government’s ability to service its debt.
Credit ratings issued by agencies such as Moody’s, S&P, and Fitch significantly impact sovereign bond markets. A downgrade can trigger capital outflows and sharp increases in yields, especially for emerging markets. Political stability, elections, geopolitical tensions, and fiscal discipline further influence investor confidence.
Sovereign Debt and Currency Markets
Sovereign debt trading is deeply connected to currency markets. Foreign investors who buy government bonds must convert their capital into the local currency, affecting exchange rates. High yields often attract foreign inflows, strengthening the currency, while rising debt concerns can lead to capital flight and currency depreciation.
For example, if a country raises interest rates to combat inflation, its sovereign bonds may offer higher yields, attracting global investors. This can lead to currency appreciation. However, if higher rates signal economic stress or debt sustainability issues, the opposite may occur. Macro traders often analyze sovereign bond yields and yield differentials to predict currency movements.
Developed vs Emerging Market Sovereign Debt
Developed market sovereign debt, such as U.S. Treasuries or German Bunds, is typically characterized by low yields and high liquidity. These bonds are often used as safe-haven assets during periods of global uncertainty. Traders use them for capital preservation, hedging, and relative value strategies.
Emerging market sovereign debt offers higher yields but comes with higher risk. These risks include currency volatility, political instability, weaker institutions, and external debt burdens. Trading emerging market debt requires careful analysis of fiscal balances, foreign exchange reserves, and external vulnerabilities. Despite the risks, many investors are attracted by the potential for higher returns and portfolio diversification.
Trading Strategies in Sovereign Debt
Sovereign debt traders employ a variety of strategies. Duration trading involves positioning for changes in interest rates by buying or selling bonds with different maturities. Yield curve trading focuses on the shape of the yield curve, such as steepening or flattening trades.
Carry trades are popular in sovereign debt markets, where investors borrow in low-yielding currencies and invest in higher-yielding sovereign bonds. Relative value trades compare yields between countries or maturities, aiming to profit from mispricing. Macro hedge funds often trade sovereign bonds based on expectations of central bank policy, inflation trends, and economic cycles.
Risks in Sovereign Debt Trading
Despite its reputation for safety, sovereign debt trading carries risks. Interest rate risk is the most common, as bond prices can fall sharply when rates rise. Credit risk, though low for developed nations, can be significant for highly indebted countries.
Liquidity risk can emerge during market stress, making it difficult to exit positions. Currency risk affects foreign investors holding local-currency bonds. Political risk, including sudden policy changes or fiscal slippage, can also disrupt sovereign bond markets. Effective risk management is essential, even in government bond trading.
Importance of Sovereign Debt in Global Finance
Sovereign debt markets form the foundation of the global financial system. Government bond yields serve as benchmarks for pricing corporate bonds, loans, mortgages, and other financial instruments. Central banks rely on sovereign debt markets to transmit monetary policy.
For traders and investors, sovereign debt provides opportunities across economic cycles, from capital preservation in downturns to yield generation in stable periods. Understanding sovereign debt trading is crucial for navigating global markets, as it reflects the intersection of economics, politics, and finance.
Conclusion
Trading sovereign debt is far more than buying and selling government bonds. It is a sophisticated activity that reflects economic health, monetary policy, fiscal discipline, and global investor sentiment. From safe-haven Treasuries to high-yield emerging market bonds, sovereign debt offers diverse opportunities and risks. For anyone involved in trading or investing, mastering sovereign debt dynamics is essential to understanding how global financial markets truly operate.

Axis Bank | Gann Square of 9 – 45° Reversal Case Study | 4 Apr 2This idea documents a historical intraday case study on Axis Bank Ltd, demonstrating how Gann Square of 9 degree levels act as precise resistance zones.
On 4 April 2022, Axis Bank initiated an upward move from the 0° reference near ₹767. Using the Gann Square of 9 calculation, the 45° projection was identified near ₹781.
Price advanced steadily and formed a high at ₹780.55, coming within 0.5 points of the calculated 45° level.
This reaction fell well within the acceptable tolerance range and resulted in a clear intraday rejection from the 45° degree zone.
📐 Key Gann Levels Observed
0° → ₹767
45° → ₹781
🧠 Concept Highlight
According to Gann’s price-degree structure, when price approaches a 45° level within the intraday time window, it often behaves as a temporary resistance or reversal zone.
This example shows:
Respect for angular resistance
Precision of degree-based levels
How small deviations can still validate Gann structure
Disclaimer:
This chart is shared for educational and analytical purposes only. It does not constitute a buy or sell recommendation.
